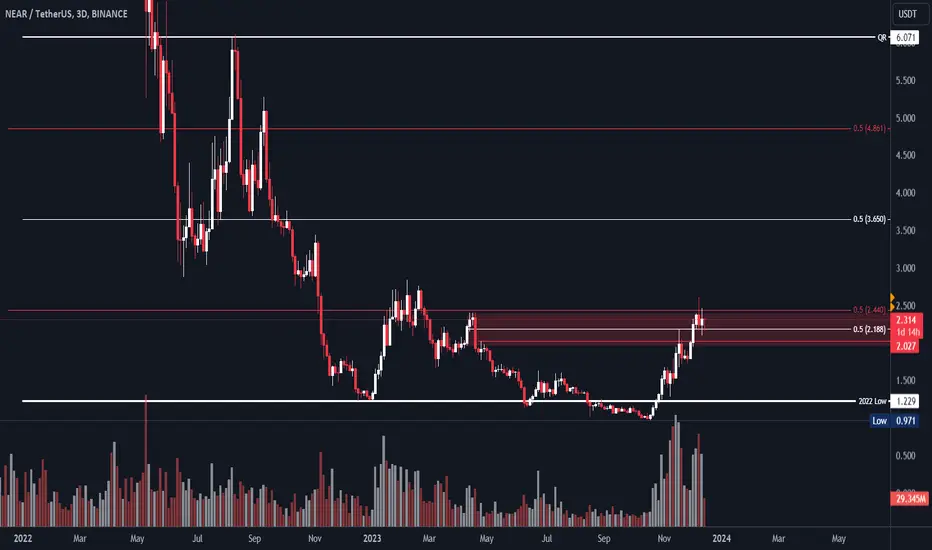
NEAR: DECEMBER 16, 2023Currently we are above the median line of the weekly OB, which is the dim red rectangle. The wick above the OB leads me to believe that further upthrust is on the cards. The market has been suffering from indecision for the past week, except for some assets. However, I believe we are going through a breather, which will lead to further upward pressure in the near future. This holds especially true for altcoins, such as Near, that are about to make an official exit from their accumulation range and make a move. The highs, I believe, will most probably taken out in case we flip 2.44. Any acceptance below 2.027 is a sign to get out of this trade for me. I am aiming for 3.443. Please share the idea if you find it useful.
NEARUSD
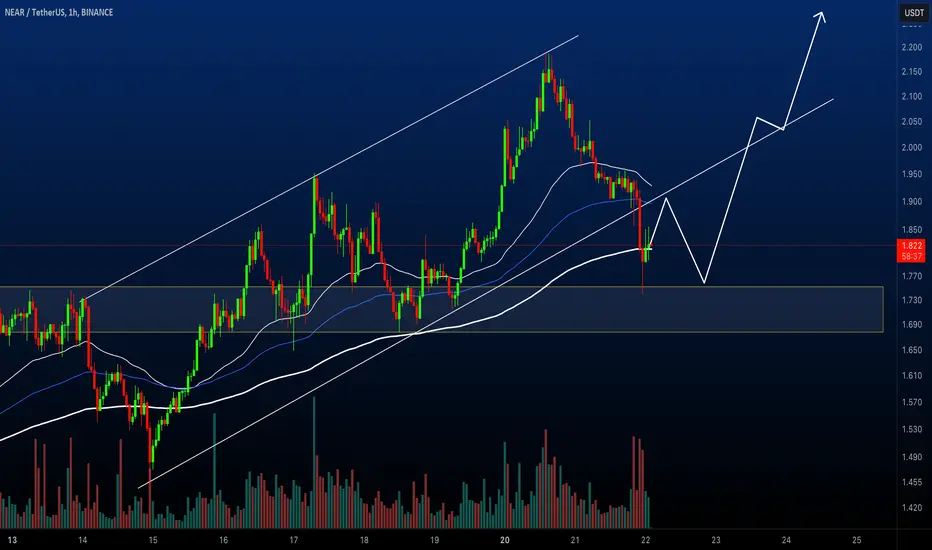
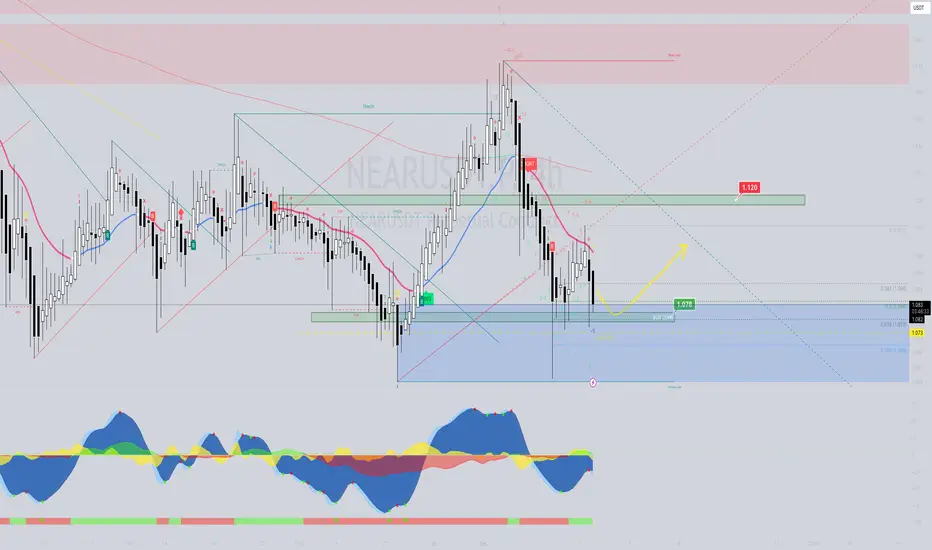
NEAR: UP or DOWN ?
Near had a significant price correction recently and currently it is trying to establish it support level
We can expect this price uncertainty to continue for a while as shown in the above chart.
With the current bullish market sentiment we can expect NEAR price to bounce back.
Im expecting price to move up once it settles in the support zone.
We will keep you posted about our trade entries. Stay tuned
Like and share your thoughts in the comments.
Cheers!
GreenCrypto
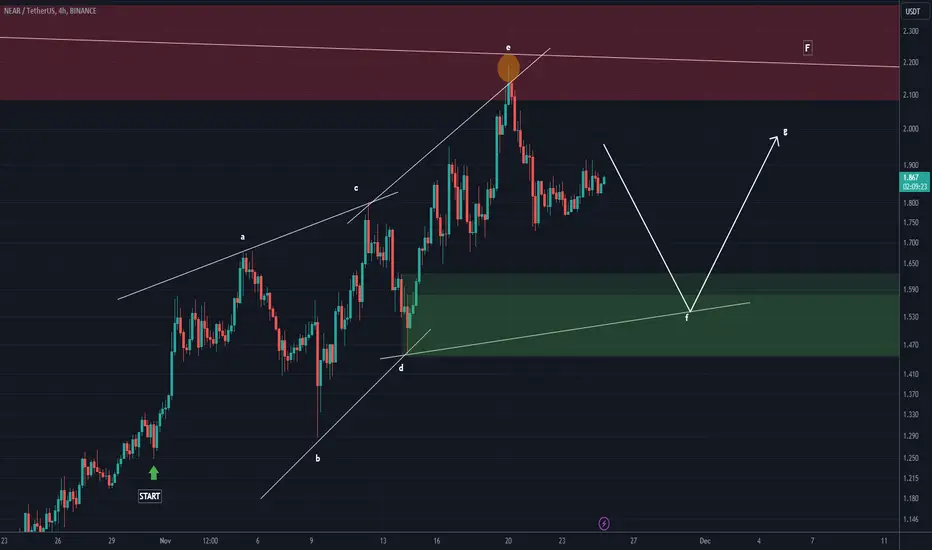
NEAR ANALYSIS (4H)It seems that the NEAR currency is in a diametric, and now we are in the F wave of this diametric.
After completing wave F on the green box, we can move up for wave G.
For risk management, please don't forget stop loss and capital management
Comment if you have any questions
Thank You
The key is whether it can rise above 2.24Hello traders!
If you "Follow" us, you can always get new information quickly.
Please also click “Boost”.
Have a good day.
-------------------------------------
(NEARUSDT chart)
Among the coins that are expanding the coin ecosystem, NEAR is one of the coins that has not yet risen above the MS-Signal indicator on the 1M chart.
Accordingly, the key is whether the price can be maintained above 1.99 and rise above the M-Signal indicator on the 1M chart.
(1W chart)
To do so, it is necessary to check whether the price can be maintained by rising above 2.24.
If that happens, it is expected to lead to a movement to rise above the M-Signal indicator of the 1M chart and an attempt to break through the MS-Signal indicator of the 1M chart.
(1D chart)
The key is whether the price can be maintained by receiving support around the 1.870-1.964 range and rising above 2.272.
Accordingly, it is becoming important whether the price can be supported by rising to the box range of 2.086-2.404.
--------------------------------------------------
- The big picture
The full-fledged upward trend is expected to begin when the price rises above 29K.
This is the section expected to be touched in the next bull market, 81K-95K.
-------------------------------------------------- -------------------------------------------
** All explanations are for reference only and do not guarantee profit or loss in investment.
** Trading volume is displayed as a candle body based on 10EMA.
How to display (in order from darkest to darkest)
More than 3 times the trading volume of 10EMA > 2.5 times > 2.0 times > 1.25 times > Trading volume below 10EMA
** Even if you know other people’s know-how, it takes a considerable amount of time to make it your own.
** This chart was created using my know-how.
---------------------------------
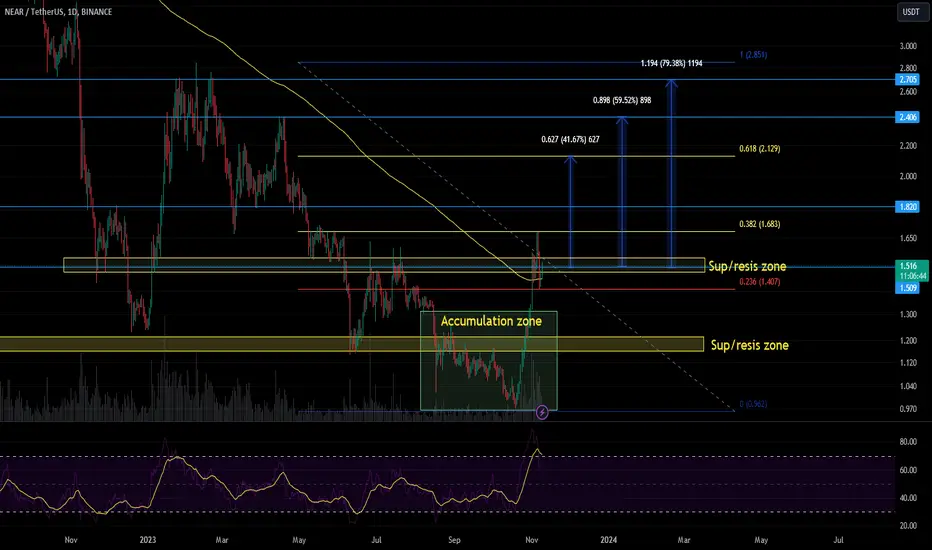
I expect NEAR to rise to $2.12Hello everyone! I have a great idea regarding NEAR.
With the recent upward movement, NEAR has broken out of the accumulation zone, surpassing the first major resistance level, as well as the nearest strong Fibonacci level of 0.236 and the 200-day moving average (EMA 200).
Currently, the asset is within another range of resistance/support, and in a bullish market, it should easily overcome this level.
I believe that the asset is currently in a good range for buying opportunities.
On the chart, the blue horizontal lines indicate other areas of resistance/support for the price.
My final target is a growth up to the 0.618 Fibonacci level, which would bring a profit of 41%.
I also see the possibility of further upward movement towards $2.4 and $2.7.
All targets are shown on the chart.
Please note that this is not financial advice, and any actions you take are at your own risk!
NEAR / NEARUSDTGood Luck >>
• Warning •
Any deal I share does not mean that I am forcing you to enter into it, you enter in with your full risk, because I'll not gain any profits with you in the end.
The risk management of the position must comply with the stop loss.
(I am not sharing financial or investment advice, you should do your own research for your money.)
NEAR updateAMEX:NEAR update...
First attempt failed, this is my second attempt... If this trade is also stopped I'll wait for confirmations around ~1,55...
Be safe...
#trading
@NEARProtocol
#Near #NEARProtocol #altcoins
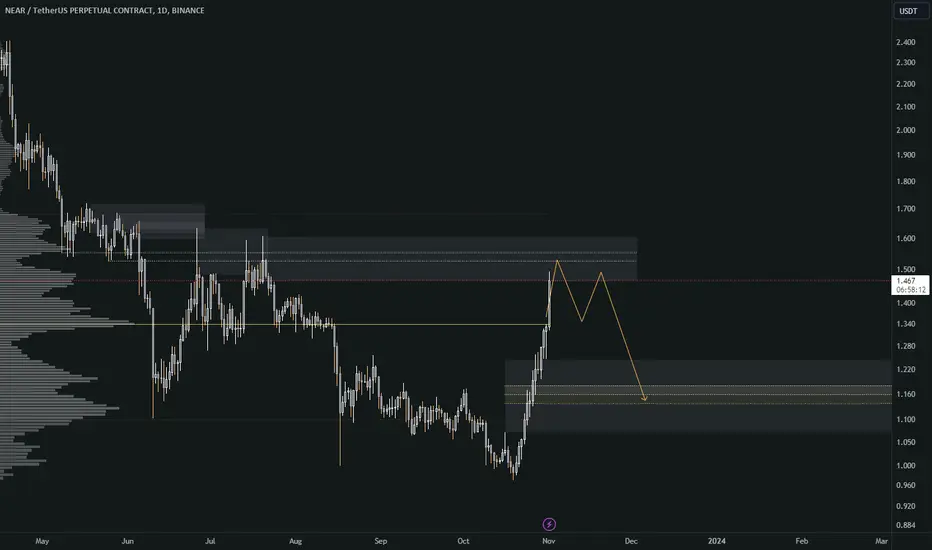
NEAR ready to take action Near ready to take action.
Overall NEARUSDT been bullish over the last days but my trend analysis currently showing some weaknesses and the bouncing from previous fair value gap.
SHORT ENTRY: 1,2
STOPLOSS: 1.265
TAKE PROFIT 1.079
TAKE PROFIT: 1.02

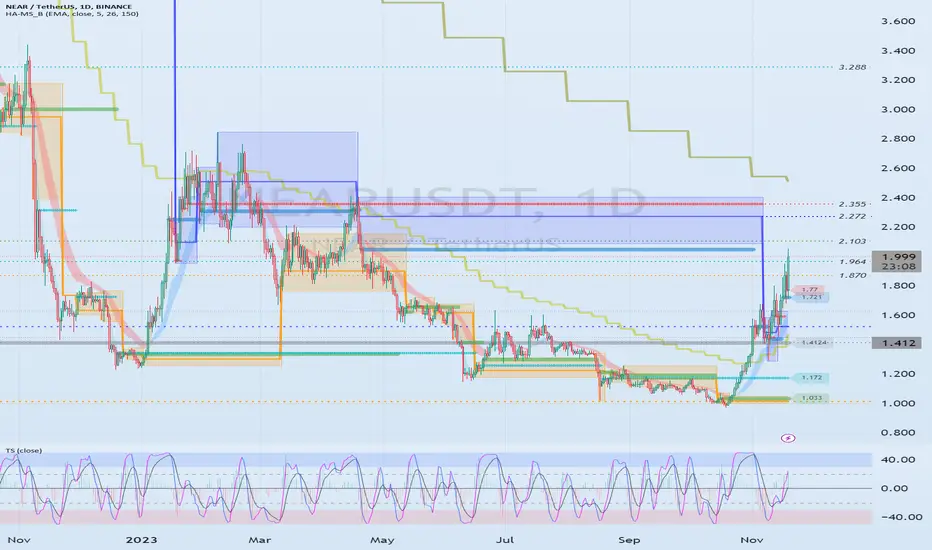
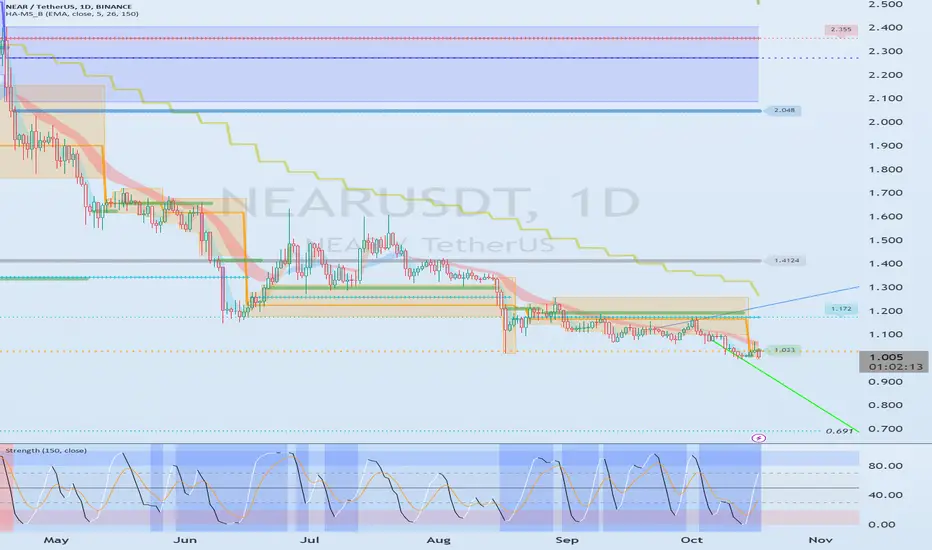
Last support range: 0.830-1.528Hello?
Hello traders!
If you "Follow" us, you can always get new information quickly.
Please also click “Boost”.
Have a good day.
-------------------------------------
(NEARUSDT chart)
(1M charts)
The key is whether the price can be maintained by rising above 1.99.
(1W chart)
The key is whether it can receive support and rise in the 0.830-1.528 range.
(1D chart)
Since the volume profile section is formed around 1.4124, the key is whether it can rise beyond this point.
If the price cannot be maintained by rising above 1.031, there is a high possibility of a new low, so caution is required.
-------------------------------------------------- -------------------------------------------
** All explanations are for reference only and do not guarantee profit or loss in investment.
** Trading volume is displayed as a candle body based on 10EMA.
How to display (in order from darkest to darkest)
More than 3 times the trading volume of 10EMA > 2.5 times > 2.0 times > 1.25 times > Trading volume below 10EMA
** Even if you know other people’s know-how, it takes a considerable amount of time to make it your own.
** This chart was created using my know-how.
---------------------------------
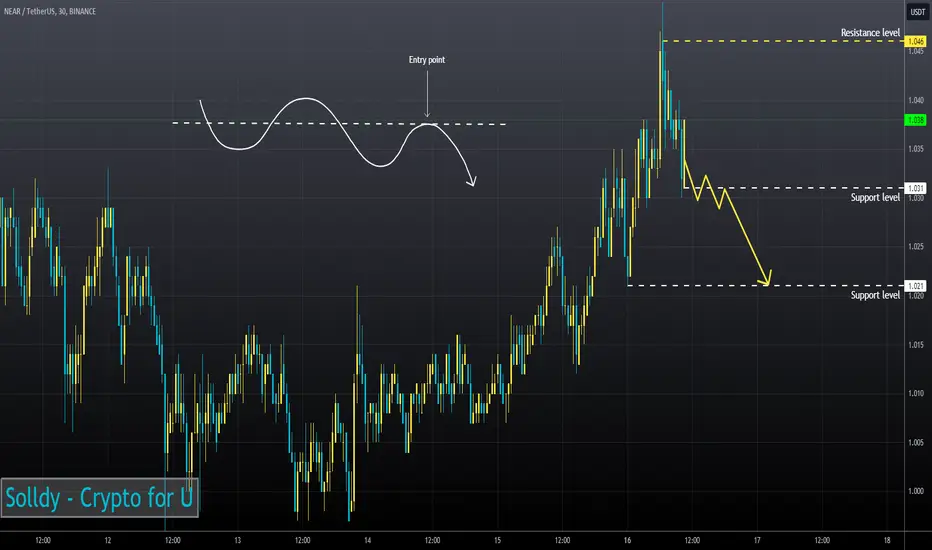
NEARUSD ❕ correctionTD Sequential formed a reversal signal down (4H TF)
Price and RSI chart formed a divergence (30m TF)
I think NEAR may continue the correction if it fixes under the support.
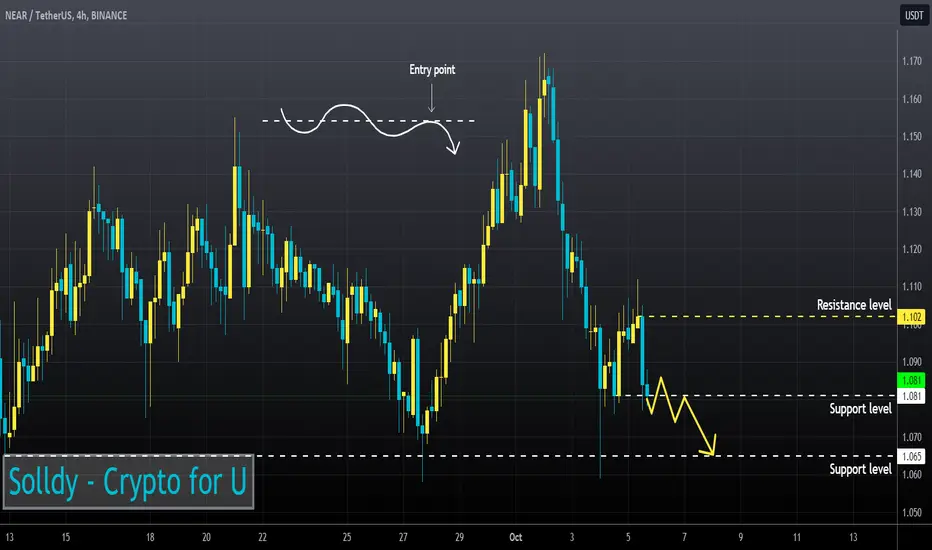
NEARUSD ❕ bearish takeoverNEAR has fixed under 50EMA (4H TF)
RSI is moving in the sellers' zone.
I believe that the asset will continue to decline.
NEAR short term tradeNEAR has been range bound last few weeks and months. 1.08 and below is my buy zone with a stop loss below 1.078 and a profit target of 1.12 and 1.16.
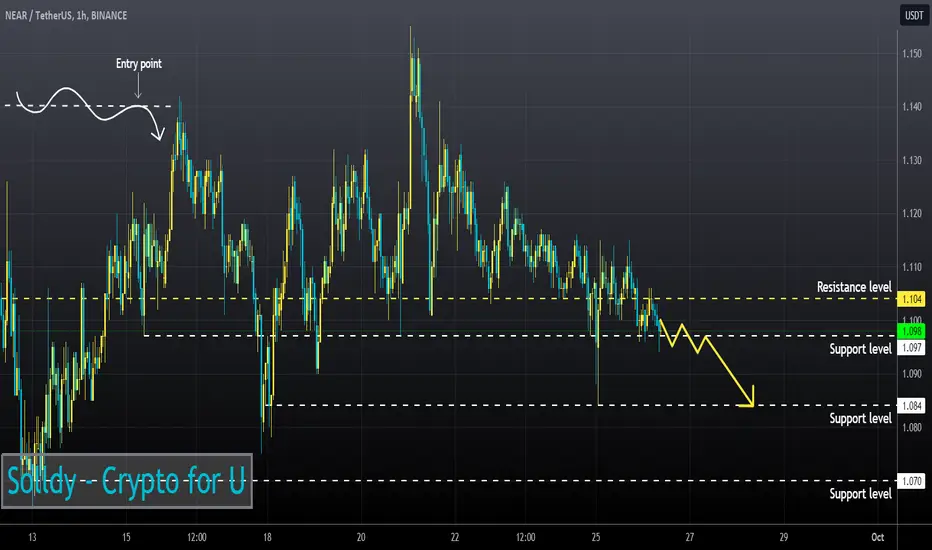
NEARUSD ❕ downtrendNEAR has consolidated under 50EMA (1H and 30m TFs)
RSI is moving in the sellers zone
I believe that the price chart will continue the downward movement.
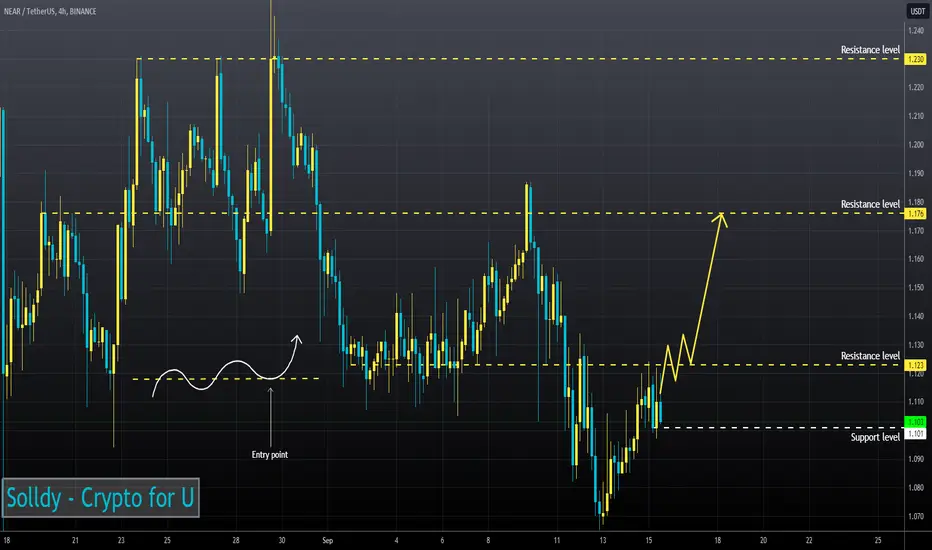
NEARUSD ❕ neutral RSINEAR has consolidated above 50EMA (1H TF)
RSI is near neutral values.
I expect a bounce after a fixation above the resistance.
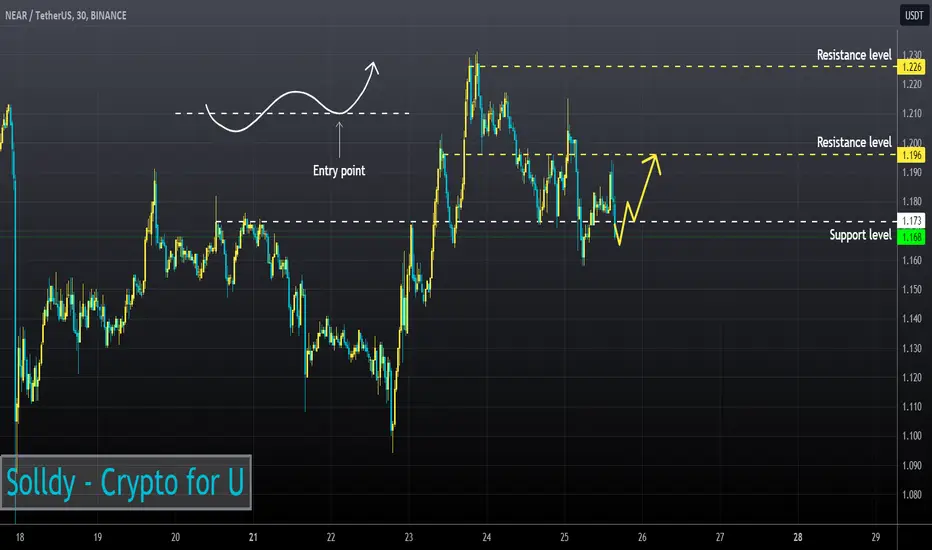
NEARUSD ❕ reached the supportRSI is at neutral values.
50EMA broke upwards 200EMA (30m TF)
I believe it will start a bounce if it holds support.

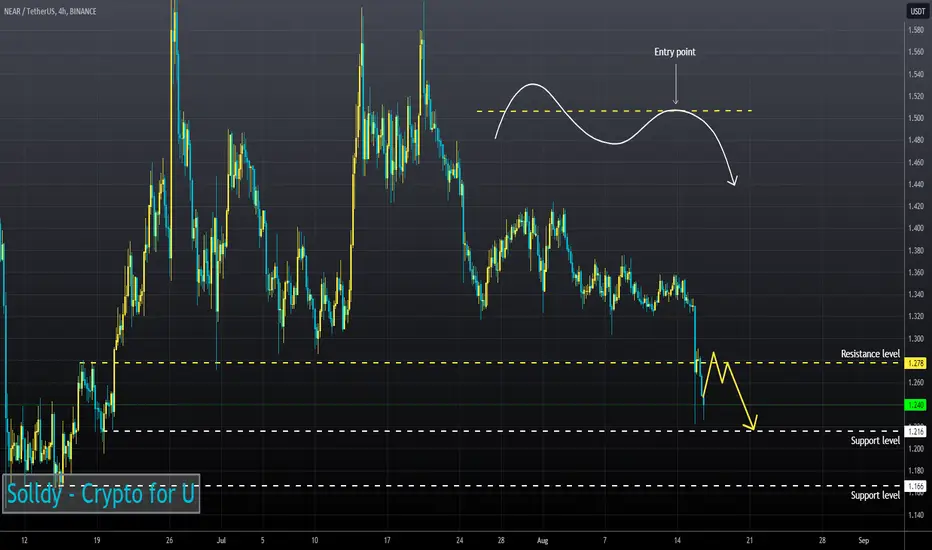
NEARUSD ❕ low volumeNEAR fixed above 50EMA (4H TF)
Volumes are declining on price correction.
I think the asset will rebound from the support again.
NEARUSD ❕ declineNEAR decreased as expected.
RSI indicates local oversold.
I believe that after correction the asset will continue to decline.
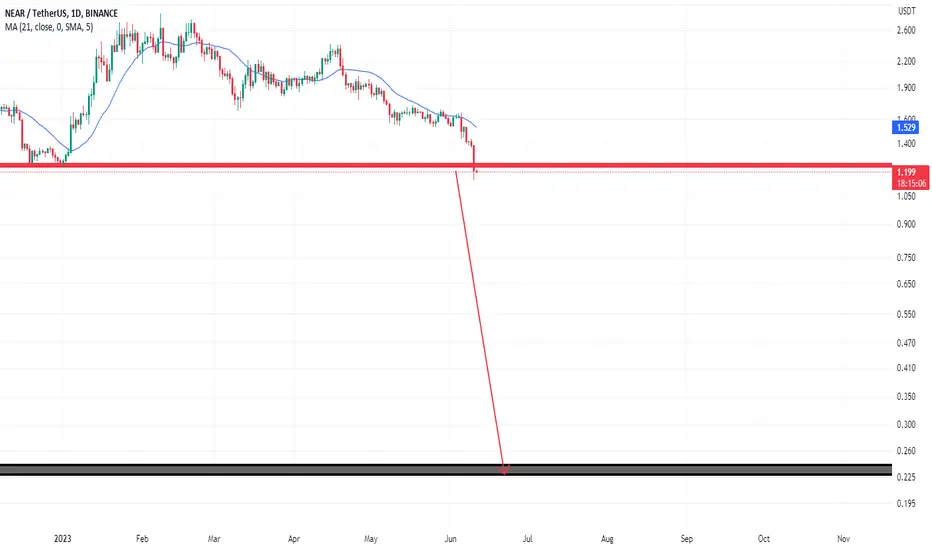
NEAR/USDTIn the continuation of the downward trend, we can give the possibility that we will enter a serious downward phase by correcting to the broken breakeven.

NEARUSDTHello
Another broken trendline for this one.
So I think you've found where target is?
Be with me spread dollars in the air!
Be patient.

NEARUSDTI put my last chart about DOT in down this chart.
As you see a major support is broken and goes down to black .
NEARUSD ❕ descending triangleRSI is moving in the sellers' zone.
The price has fixed under 200EMA (30m TF)
I expect a decline after fixing under the support level.

NEARUSD ❕ tests the resistance levelSellers have stepped up the pressure.
The chart broke down the 50EMA at 30m TF.
I expect the decline to continue.

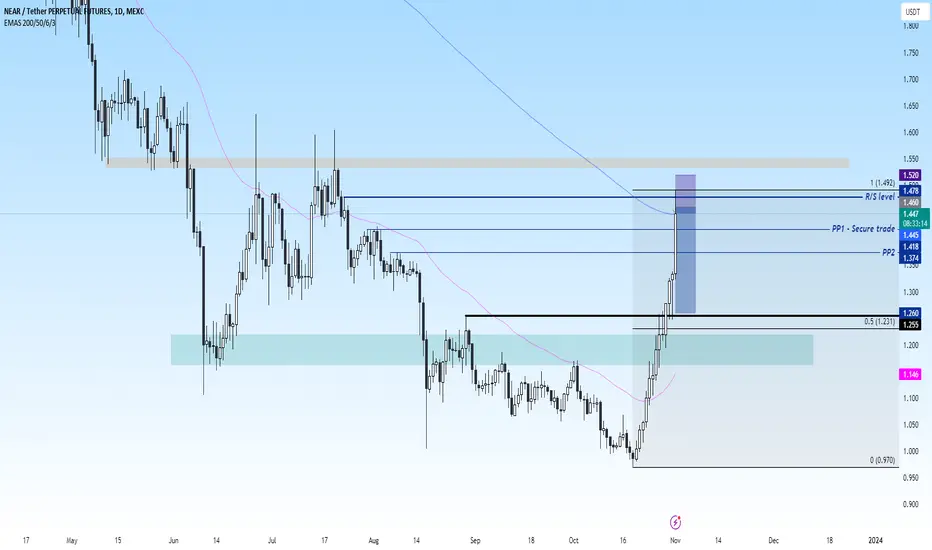
NEAR - getting ready for a strong exit from the downtrend?!Hello trader! Today I have a new idea for you. Like and subscribe to the channel, there is a lot of useful information.✅
The NEAR coin, after a strong fall, was able to recover and exit the global downtrend by breaking through the global countertrend line.
At the moment, there is a slight rebound in altcoins on the market, but soon everything can also change and we will again get a rollback in the NEAR coin to the $1.4-1.35 zone
So here you need to act according to the situation, if you are going to speculate on a price increase, then I recommend waiting for a small rollback and already acting according to the situation. I take such coins in the long run with a leverage of no more than 1-2X
