NEARUSDT sk analysis buying signalMarket is on the way to our blue BC buying zone after the unfinished bulls blue sequence RR: 2.77:1 this analysis is based on SK strategy
NEARUSDT
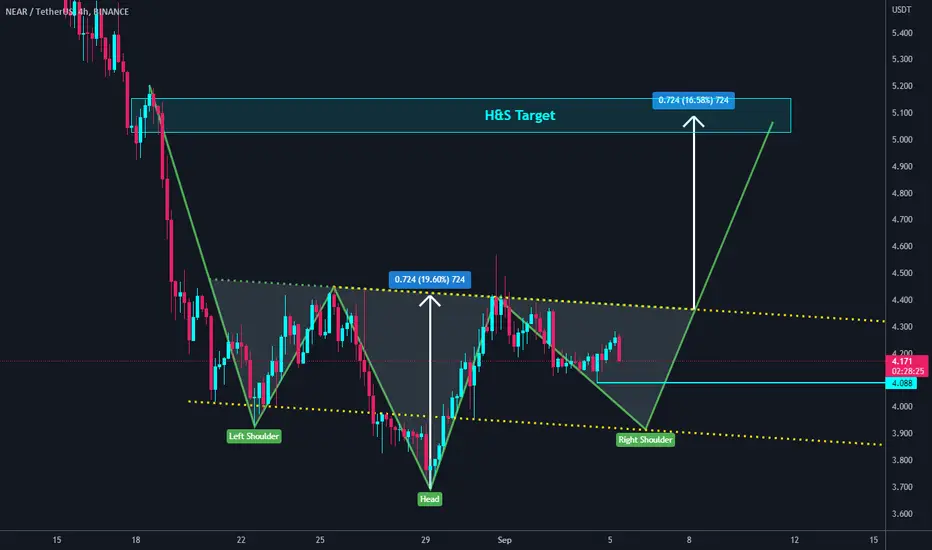
NEAR inverted head and shoulders#NEAR/USDT
$NEAR shaped an inverted head and shoulders pattern.
🐮 if price hold the previous low at $4.088, the right shoulder is completed and price can head up to break out the neck line and rise as high as head.
🐻🐮 I think price can have another leg down to make the low of right shoulder around $3.9 which is around parallel trend line of neckline, then increase to complete the H&S pattern.
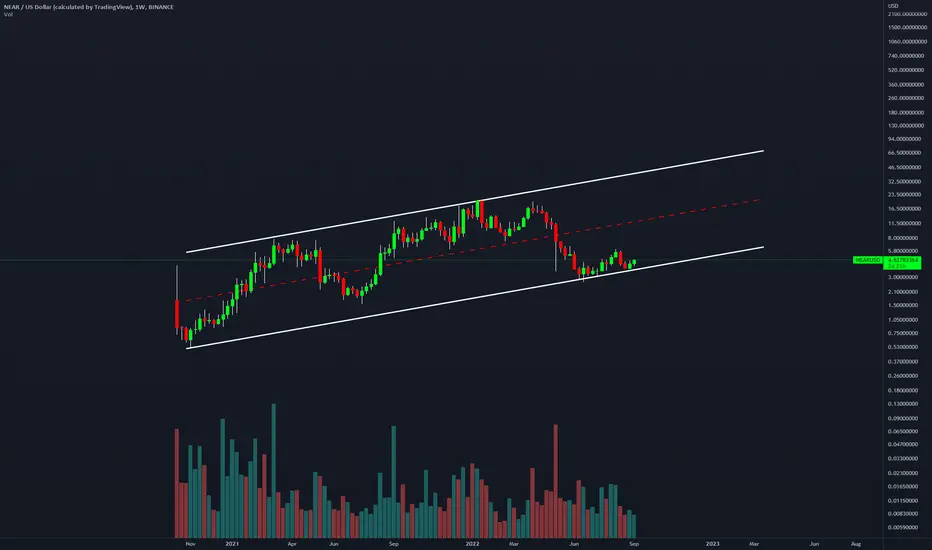
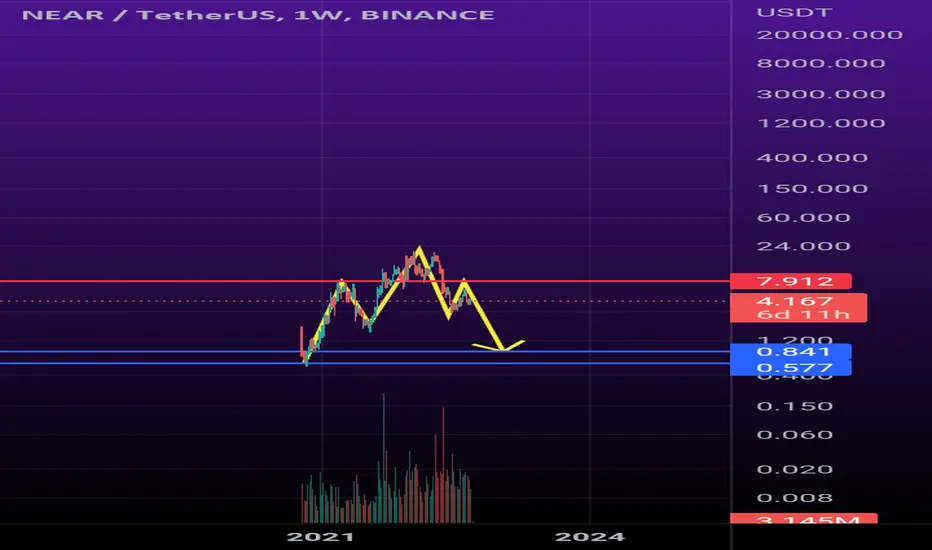
Long Term Channel Up - Near ProtocolLong term channel up --
Weekly Double Potentially forming
Swing to top of channel
NEARUSDT BIG PUMP SOON#NEAR completed an inverse head & shoulders formation on 4h timeframe and now testing the neckline of the one👀
Send it to 5$ & 5.4$ if we breakout📈

$NEARUSDT UPDATE!!!Hi Snipers,
Please refer to the recording for the next price levels and scenarios.
Thanks
MS

NEAR/USDT 4HOUR Up or Down ?🌞Hello guys🌝
The NEAR digital currency has reached the daily support range of $3.7 and returned to the resistance area of $4.6, which is considered the most important resistance area for the growth of this cryptocurrency.
By fixing the price above the resistance area of $4.6, it has the ability to realize the targets of $4.95 and $5.2.
Otherwise, with the loss of the daily support area of $3.7, the price will see the levels of $3.3 and the green support area of $3.
If needed, a new update will be available to you.
Arztoday🌈

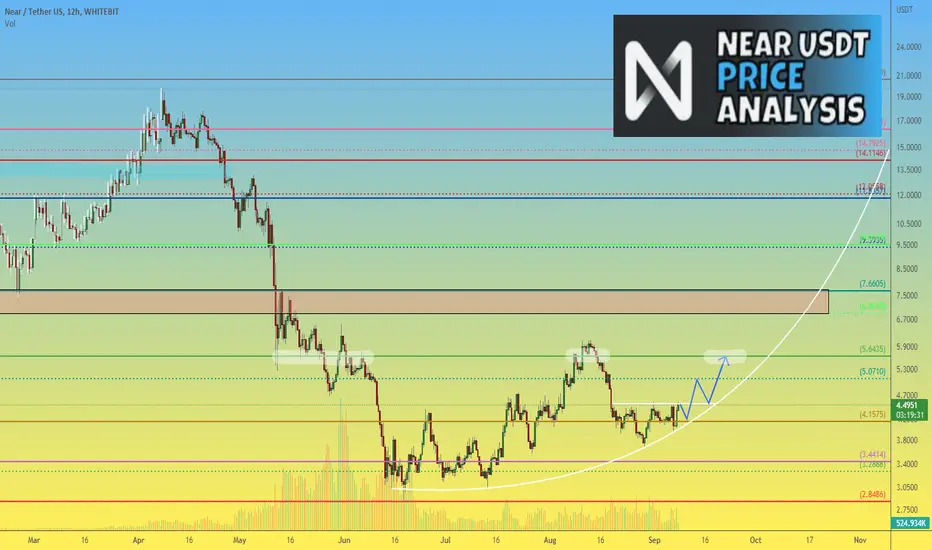
NEARUSDT 12h Strong rebound and good prospects for NEAR priceAfter the market crash on 09/06/22, when BTCUSDT price updated the local low, many altcoins partially repeated this maneuver, but without updating the lows.
But already today we see that the NEARUSDT price not only did not renew the lows of the previous months, but also showed one of the best rebounds upwards.
Well, with such strength and enthusiasm of NEAR buyers, we can expect a continuation of good growth in the area of $5.60
Local correction to $4.15 before the continuation of growth will also be within adequate limits without breaking the structure of the future growth pattern.
Globally, the reversal and change of the trend is a long process, not everyone has the patience to sit out in the crypt. As a result, units will be rewarded for patience, and the rest will be catching up in the course of growth, pumping the market with fresh money.
_______________________________
Since 2016, we have been analyzing and trading the cryptocurrency market.
We transform our knowledge, trading moods and experience into ideas. Each "like under the idea" boosts the level of our happiness by 0.05%. If we help you to be calmer and richer — help us to be happier :)

NEAR HTFAs you can see where is the buy zone on the chart, I think that would be decent spot to pick NEAR for long term!

NEAR/USDT :: Range box , Safe lines .NEAR/USDT :::
_ As long as the crypto market takes direction, it will move between these lines .

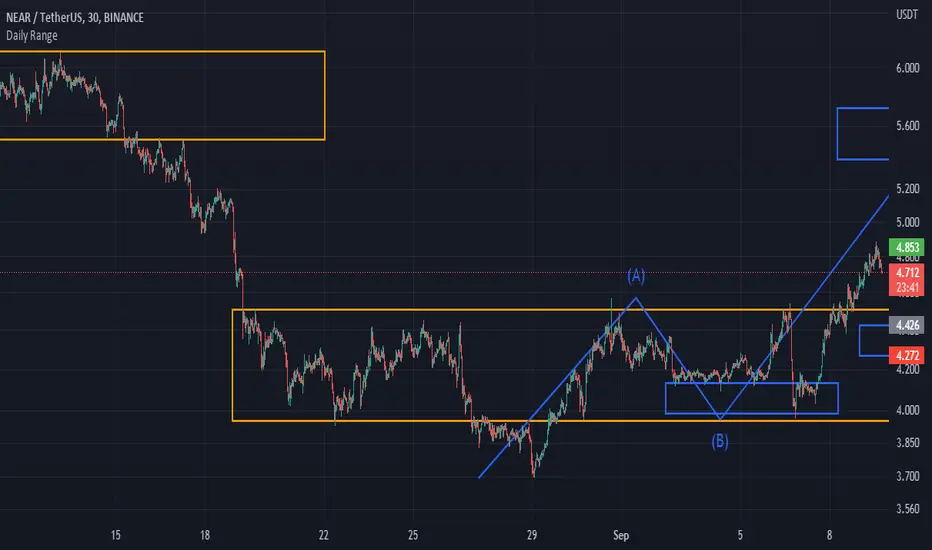
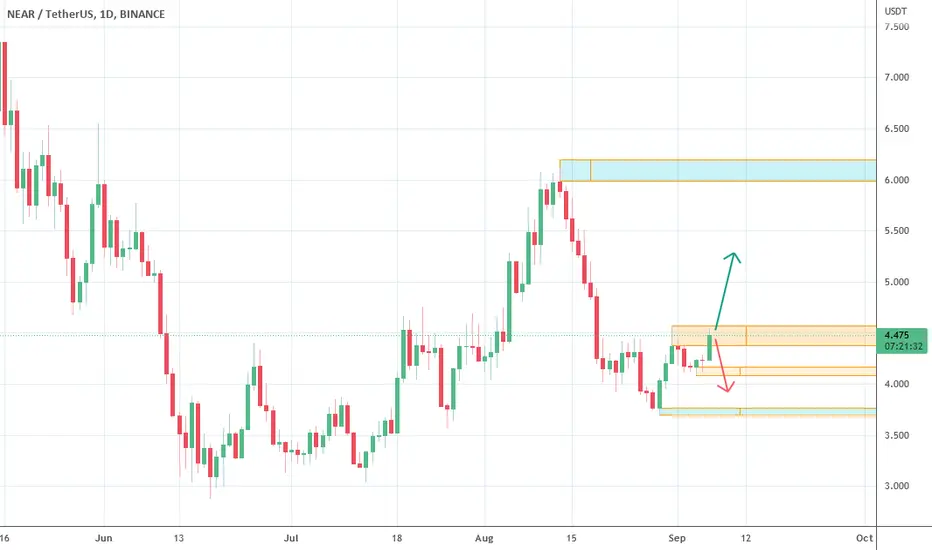
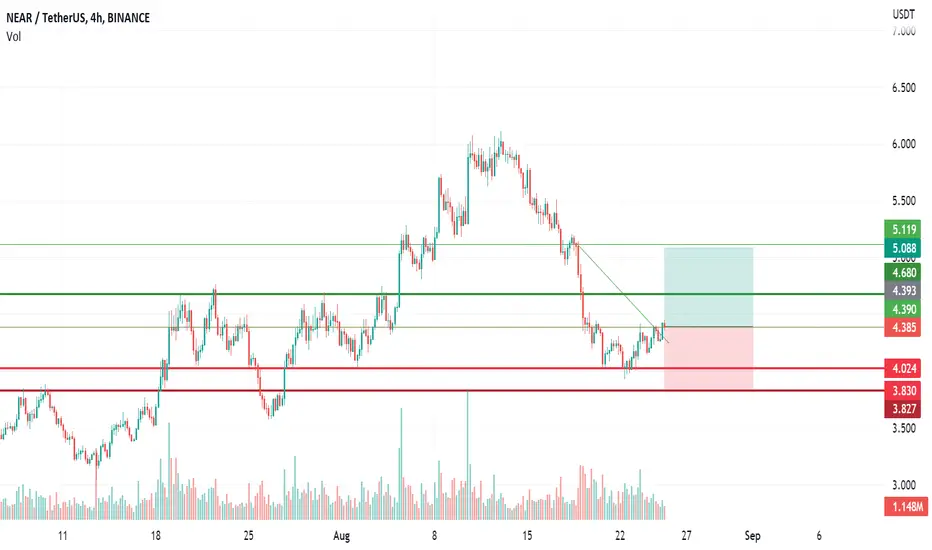
NEAR: market analysis fir NEAR starts forming a converging formation on the Daily timeframe. The upper border of this price range is the resistance level formed on August 30 – September 2. The borders of this resistance are $4.57 – $4.37. The nearest support was formed on September 2 – 5. Its borders are $4.07 – $4.17.
This price range is likely to be broken through soon. The price is in the resistance zone now.
After the bullish candle on the Daily timeframe is closed above the resistance level the market will reverse and the uptrend will start. The first target in this case is the resistance level formed on August 10 – 14 with the borders of $5.95 – $6.20 .
When breaking through the support, the trend will continue and we should look for selling opportunities. In this case the target will be around the support level with the borders of $3.70 – $3.76.
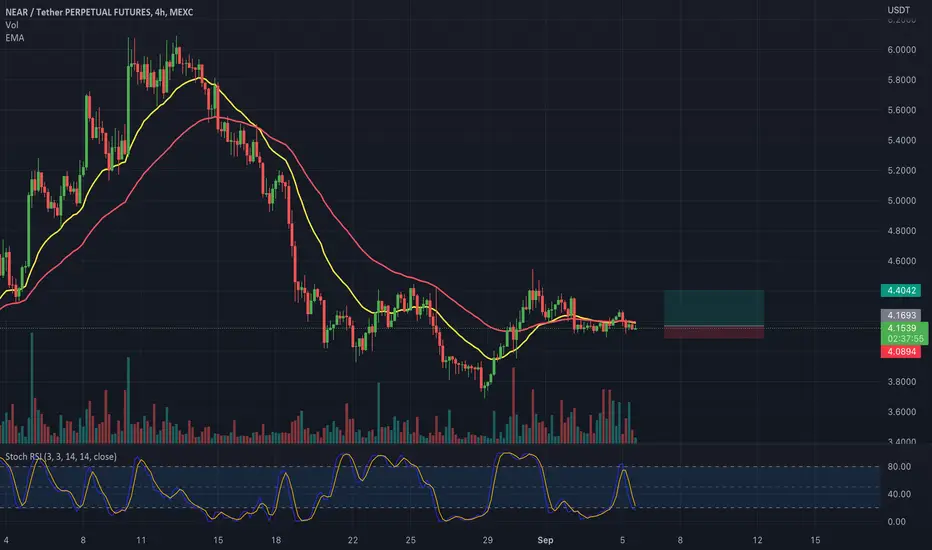
NEAR Quick Long PlayOn the 4HR NEAR is been going sideways and could have a quick pop.
Stock RSI at bottom and should be turning around.
TP 4.40
SL 4.08
Always DO YOUR OWN Research.
I took this trade on a small 4X leverage over on the MEXC exchange.
For more IDEAS be sure to follow me here on TradingView
Carlos

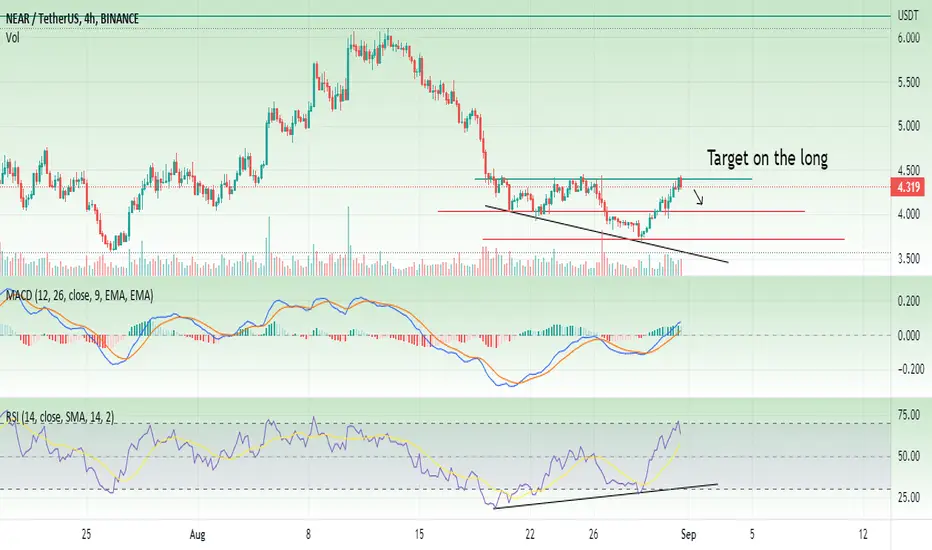
There is a trouple bottom on NEAR 4h !Price is in the downtrend channel and try to break out .
If it break out with the short wicks
TP1: 1(4.570)
TP2: 1.272(4.809)
TP3: 1.382(4.905)
TP4: 1.5(5.009)
SL : 4.088

NEAR Protocol (NEAR) - September 2Hello?
Welcome, traders.
By "following", you can always get new information quickly.
Please also click "Like".
Have a good day.
-------------------------------------
(NEARUSDT 1W Chart)
The key is to keep the price above 3.802 and break out of the downtrend line.
(1D chart)
The price must remain above the HA-Low indicator to transition to an uptrend.
So, you need to make sure you keep the price above 4.063.
- The Stoch RSI indicator is entering the overbought zone.
So, when the Stoch RSI moves out of the overbought zone, you need to see if the price holds at or above the 3.802-4.063 range.
- In order to continue the uptrend, the price must be maintained above the HA-High indicator.
Therefore, it should find support near 4.184 and move above 5.543 or shake up and down to cause the HA-High to decline.
------------------------------------------------------------ -------------------------------------------
** All descriptions are for reference only and do not guarantee a profit or loss in investment.
** The MRHAB-T indicator, which is inactive on the chart, contains indicators that indicate support and resistance points.
** Background color of Long/Short-S indicator: RSI oversold and overbought sections
** Background color of CCI-C indicator: When the short-term CCI line is below -100 and above +100, oversold and overbought sections are displayed.
** The OBV indicator was re-created by applying a formula to the DepthHouse Trading indicator, an indicator disclosed by oh92. (Thanks for this.)
(Short-term Stop Loss can be said to be a point where profit and loss can be preserved or additional entry can be made through split trading. It is a short-term investment perspective.)
---------------------------------

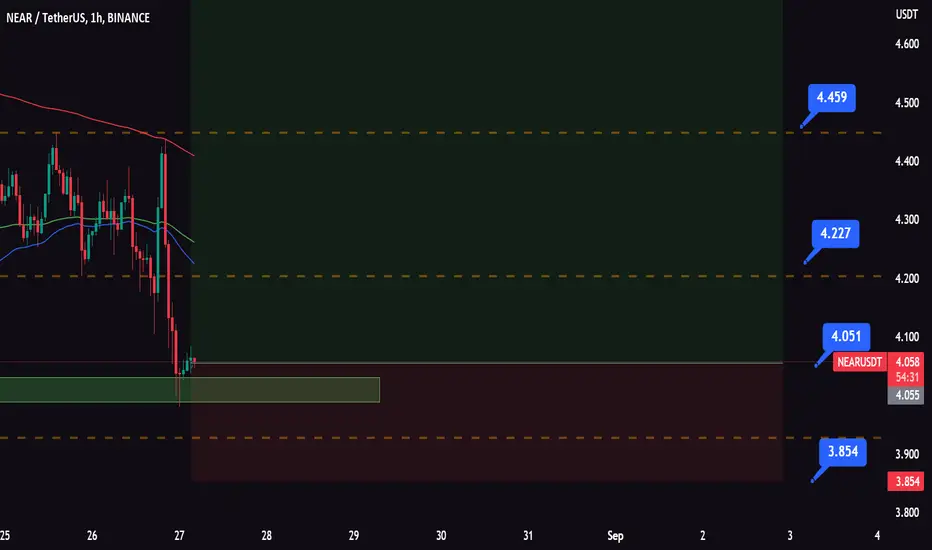
NEAR/USDT ChartHi, I try to post often so if you could follow and like it would mean a lot to me
I did this prediction a while ago on my stream and we just reached the target. After a consistent run, it is time so short NEAR. My main target is 4.06$ and after that we can see a bounce or just go down to 3.70$. Comment what you think.
I did a BTC idea today, so check that out. Late night stream today at 00.30 UK time/BST. I will be answering your questions and talk about the market. If you want me to do an analysis about a coin that you hold come to the stream. I hope I see you there.
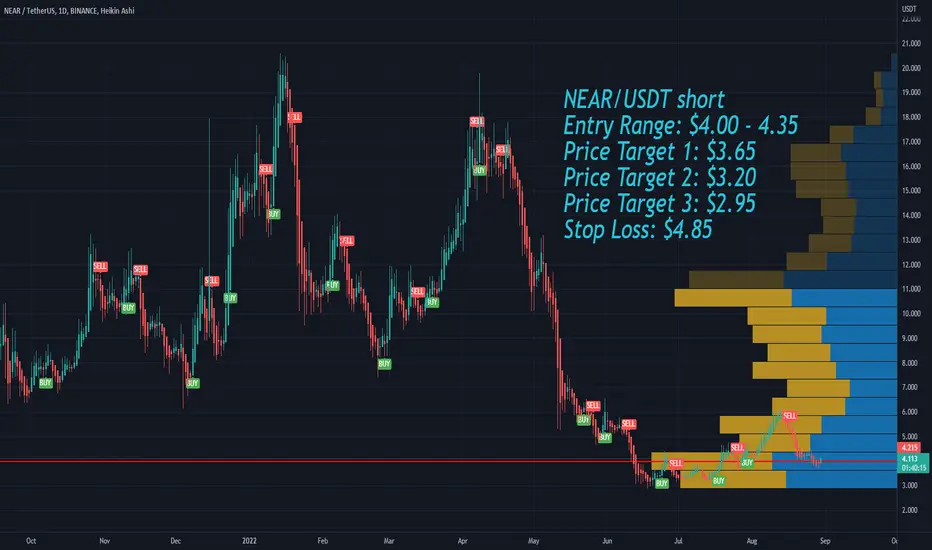
Near bearish sentiment September has major catalysts for the crypto market as well as for the stock market.
The Ethereum merge on September 6th, that will end on Sept 20, the inflation report on September 13 and the next FOMC meeting afterwards with the new interest rates hike.
That is reflected in the crypto space in general as a bearish outlook.
NEAR is a cypto with a negative overall sentiment recently.
I have the following price targets:
NEAR/USDT short
Entry Range: $4.00 - 4.35
Price Target 1: $3.65
Price Target 2: $3.20
Price Target 3: $2.95
Stop Loss: $4.85
NEARUSDT WILL GO UP BIGNEAR is testing its support level. If it holds then a big move will come towards 5.5-6.
short NEAR$NEAR broke through the ascending trendline. Decline to support level at 4$ is likely to happen.

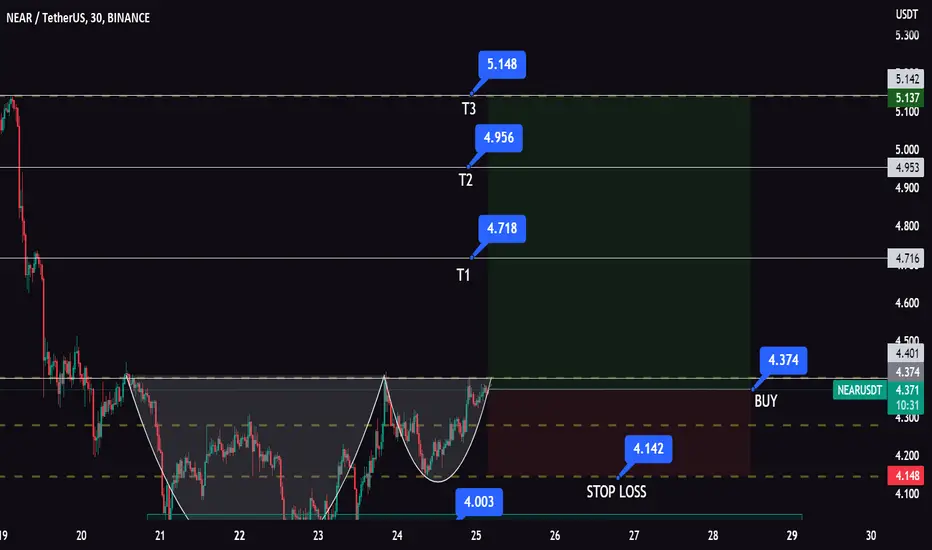
NEARUSDT IS ABOUT TO BREAKOUTNEAR is forming a cup pattern and its about to breakout.
!! BUY &SELL in the chart !!
NEAR - Mixing Harmonic Patterns with WyckoffMixing Harmonic Patterns with Wyckoff Law (and also confirming with Elliot Wave where applicable) can be one of the most effective ways to trade.
The AB=CD pattern comes within many Harmonic patterns such as the Shark, Crab or Bat. You can scalp movements like this within confirmed (or very possible) harmonic patterns that all point to a singular number.
You can also trade smaller harmonics within bigger harmonics, as long as you map out the bigger harmonic first, so you have an idea where the market is heading mid-long term.
In the example above, we use altcoin NEAR Protocol. We first check the 4 hour to find bigger harmonics, and then switch down to the 1 hour or 15 mins and trade those timeframes, depending on what we prefer.
Currently, NEAR on the 1 hour timeframe is pointing towards 4.72 via the 1.618 and the 2/2.14 fibs. It makes sense that price would top here, because of the "Preliminary Supply / PSY" Section as seen in Wyckoff Redistribution Schematic #4 (For more info on this, please check my "Link to Related Ideas" below, where I describe this in more detail on a Bitcoin chart.
You could also use Elliot Wave analysis here to map out the 5 waves upwards towards 4.72. Perhaps the final 5th wave points to a 1.272 or 1.618 expansion?
