Neo 300$Neo is in strong uptrend.
Next target is at around 27$
If you are not trading HOLD it for long term. It has a potential to reach 300$ and even 500$
NEOUSDT
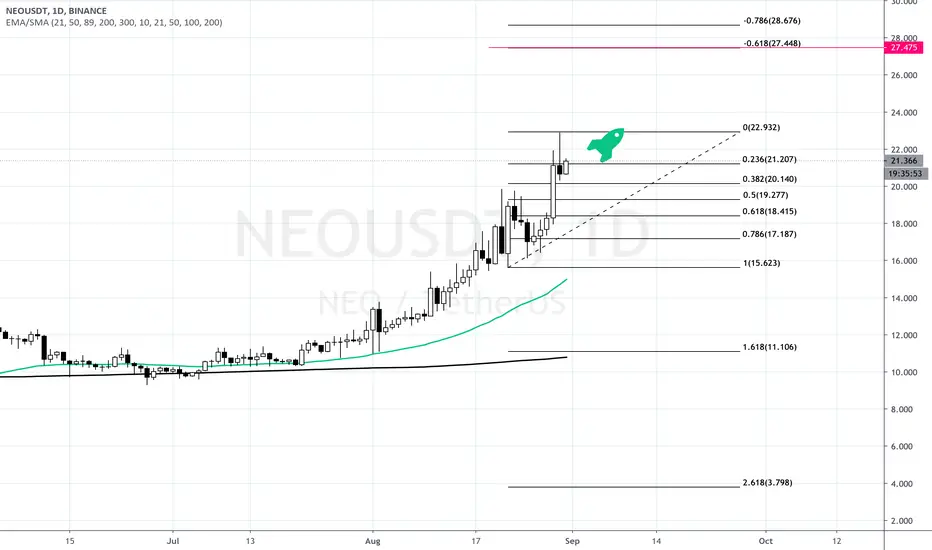
NEOUSDT: Swing Trade Triangle Breakout with current buy levels at 19.6 - 20.1
Target: 24.5 - 26
Invalidation level: 18.5

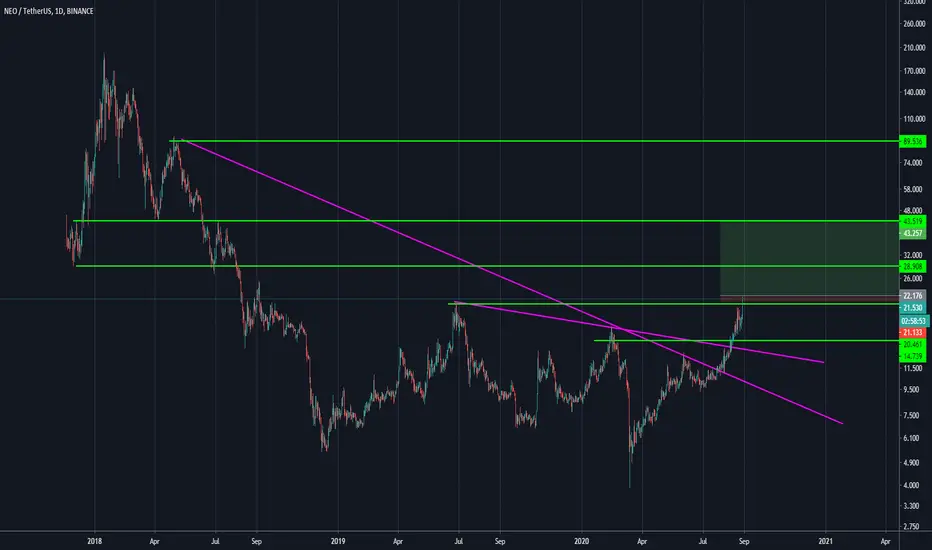
NEO USDT is a long at this moment.Made Higher Highs and clearly broke a 2 year trendline.
Bullish Retests are possible, set risk accordingly.
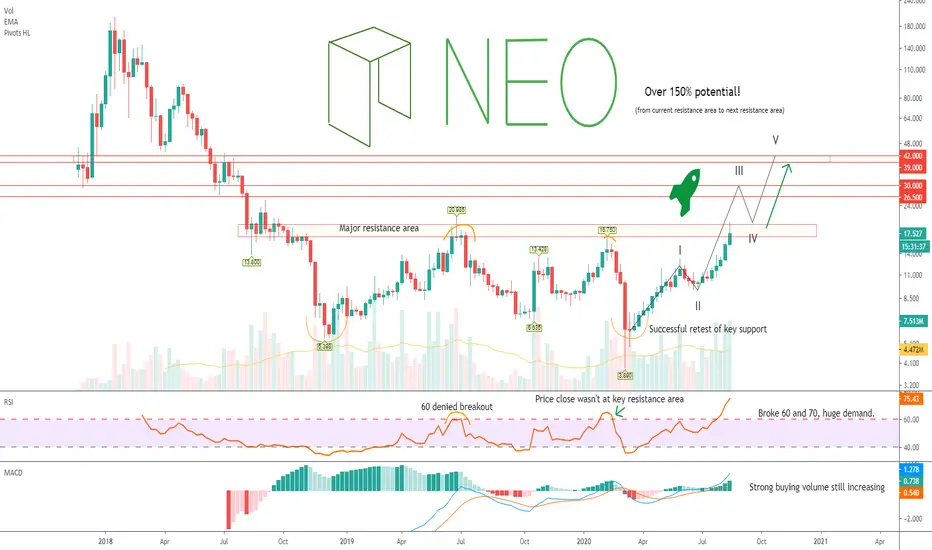
NEO Has Potential to make over 150% Profits! In Depth Analysis.Hey, I am back with another Analysis, but this in more depth looking at NEO/USDT .
So as you may know, many altcoins are breaking out as we are currently in the alternative coins season.
But, do you know how to enter, or spot the breakout before it happens?
Cryptocurrencies makes this very simple in the alt season.
Why you ask? Let me explain.
The alpha and omega of catching a breakout in alt season is for the price to break major resistance area, or even be testing because currently there resistance areas are very likely to be broken. So you can either buy the breakout, or buy in the resistance area.
The reason alts are going so crazy right now is because of Bitcoin's high dominance that is seeing a correction.
Just look at any xxx/BTC chart and you will see how much they are undervalued.
Let's for example look at ICX , the chart looks very much alike NEO chart.
The price has broken resistance level of 0.4380$ and price has popped like crazy! This is a thing you have to search for in charts these days, not fomoing into a Coin that has already seen over 50% move..
Another example, VET.
I could find way more coins that have made similar breakout, but that's not the point here, look on BAT on yourself and try to spot the resistance area and breakout.
I hope you understand my point, now let's continue with NEO.
4H time frame
As you can see, we have a lot of bullish confirmations such as.
- Riding a 50 EMA
- Bullish divergence
- Strong uptrend channel with volume..
Daily time frame has also a bullish divergence and RSI made a higher low also!
And now looking at current chart, weekly.
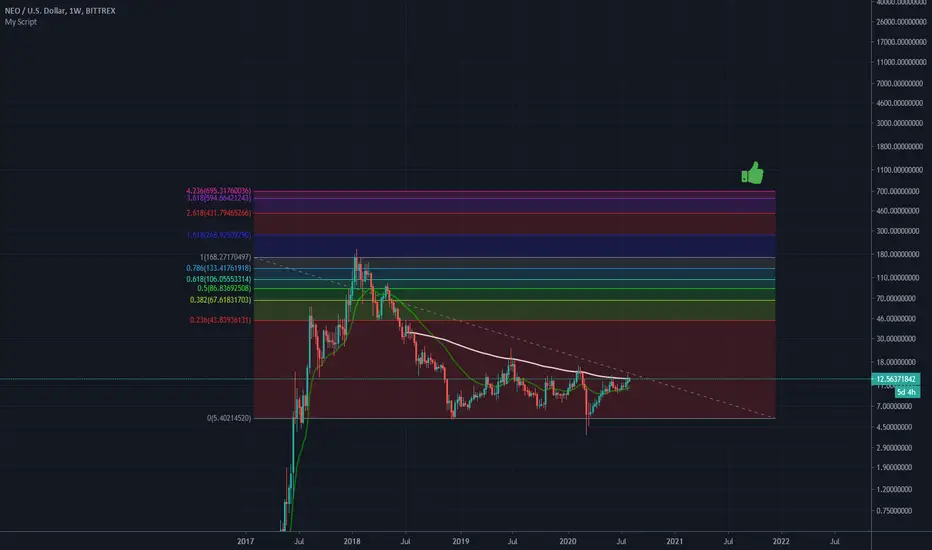
Again, very bullish RSI, MACD and a possible Elliott wave indicating a 150% move!
And that's it, don't forget to follow not to miss on updates and future Crypto analysis, there will be much more in this Alt coins season!
Cheers,
Tibor
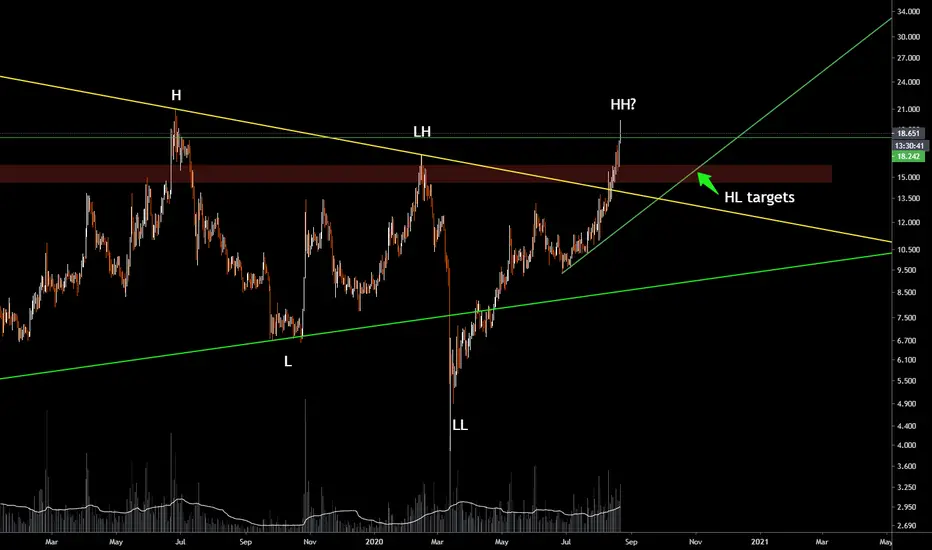
NEO-USDT: First HH after a very long downtrendHello,
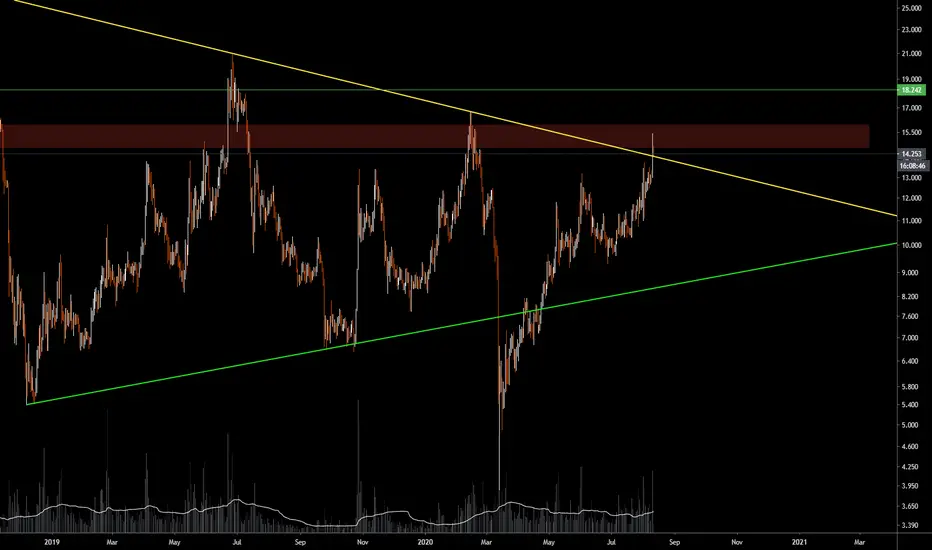
Keep eye on NEO chart, after the break from a symmetrical triangle NEO has been moving very nicely. If we get close above 18.2 $ today then it will confirm a HH after a long downtrend, from here we need to look out for a HL to catch the next move up.
I will be watching recently created support line (green) for possible HL targets.
If you are interested then do check out my previous NEO analysis, which could have got you in this up move earlier.
Happy and safe trading...
Chao...
NEO under Heavy Accumulation neer a pullback when BTC broke out unlike the rest of the alts/btc weekly big bull daily big bull. Time to be bull.
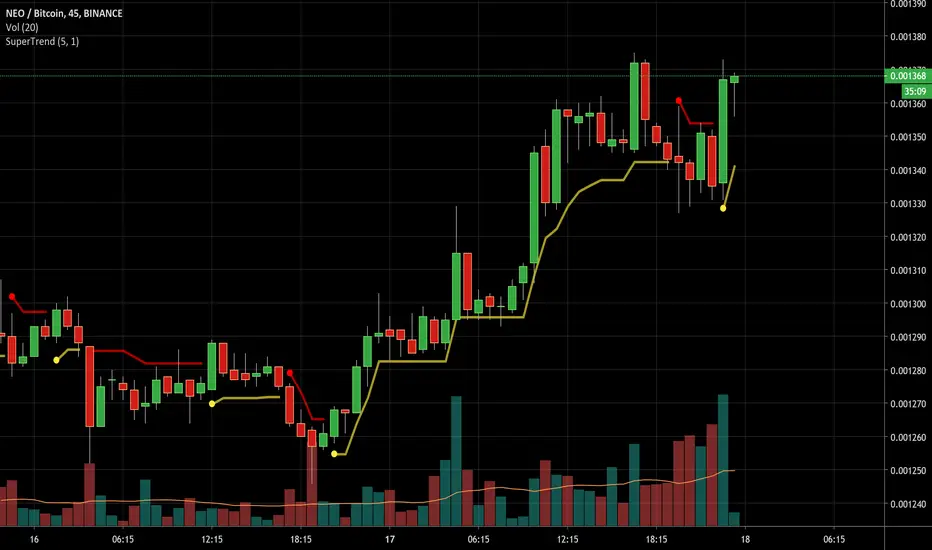
$NEO / #USD, Crossing over ~13.5$ (potential flip on the daily)$NEO / #USD
Crossing over ~13.5$ (potential flip into support on the daily chart) w/ increasing volume..
UCTS bullish across all high timeframes (1D+)
Continuation should allow retest of the ~16.5$ as 1st target (~20%)
#NEO

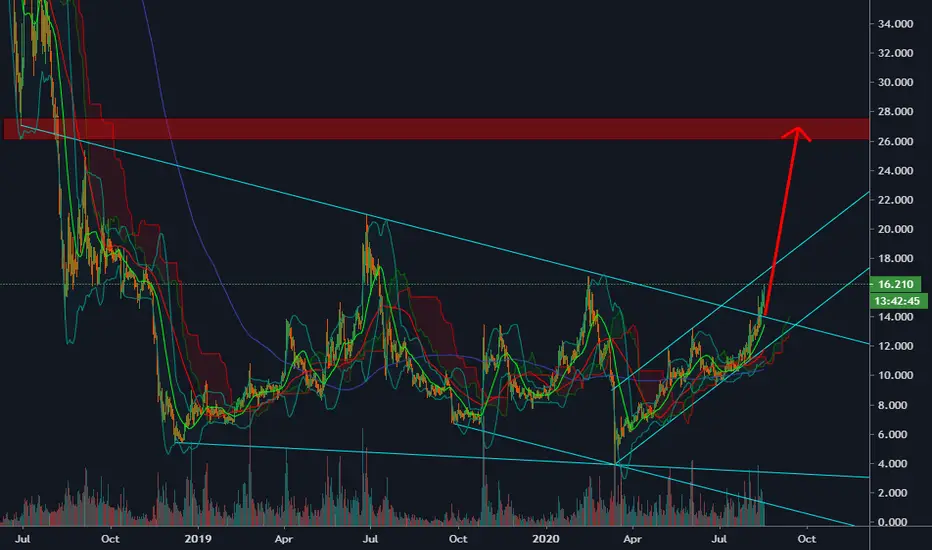
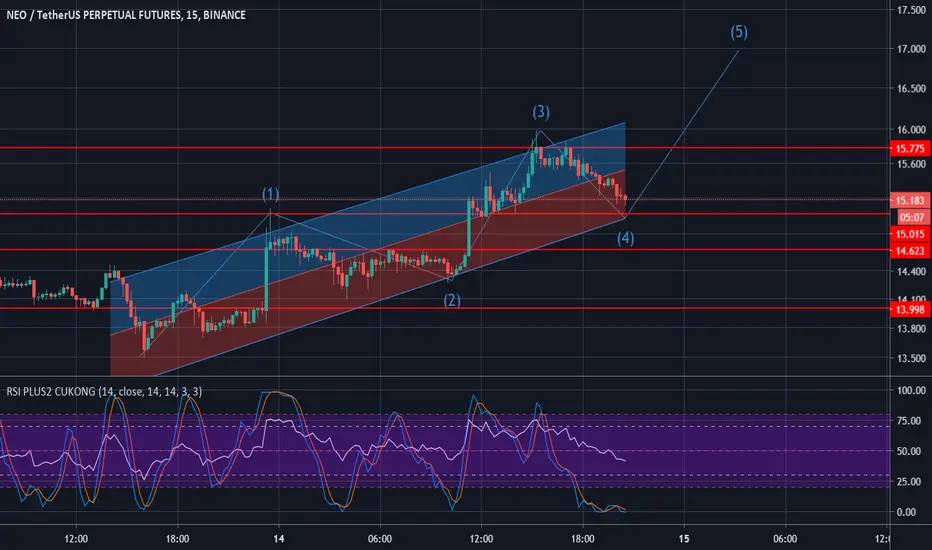
✳️NEO [NEO/USDT] on Aug-17 #NEO $NEO #NEOUSDTNEO has just broken out of downtrend from 2018 and it is heading to 20.5$ and even 26-28$.
However, be careful and do not All-in, because NEO can still re-test the 14$ zone in the next few days. And here is our chance to buy more NEO

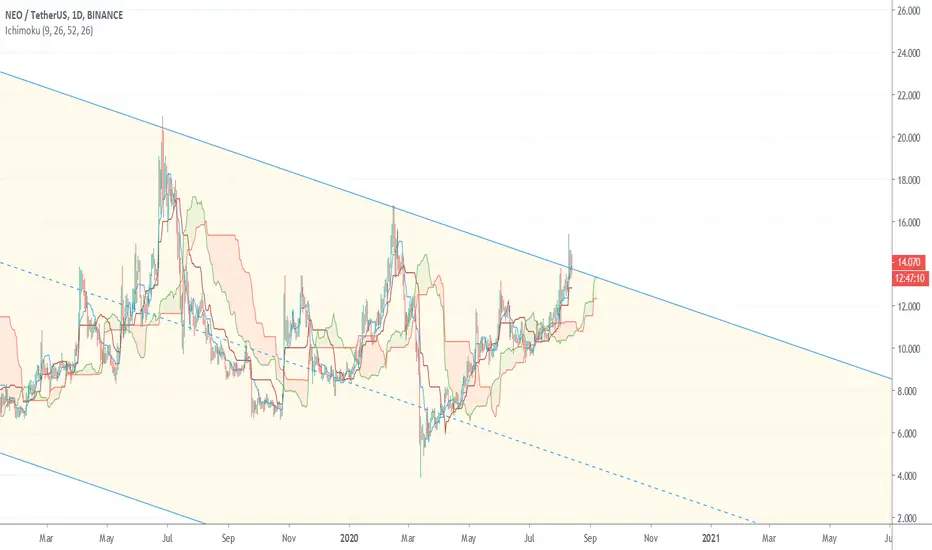
berack roof of channelneo recently breaked the roof of long term channel, if it can consolidate on that it will have another raising wave and ichimoku indicator can prove it raising.
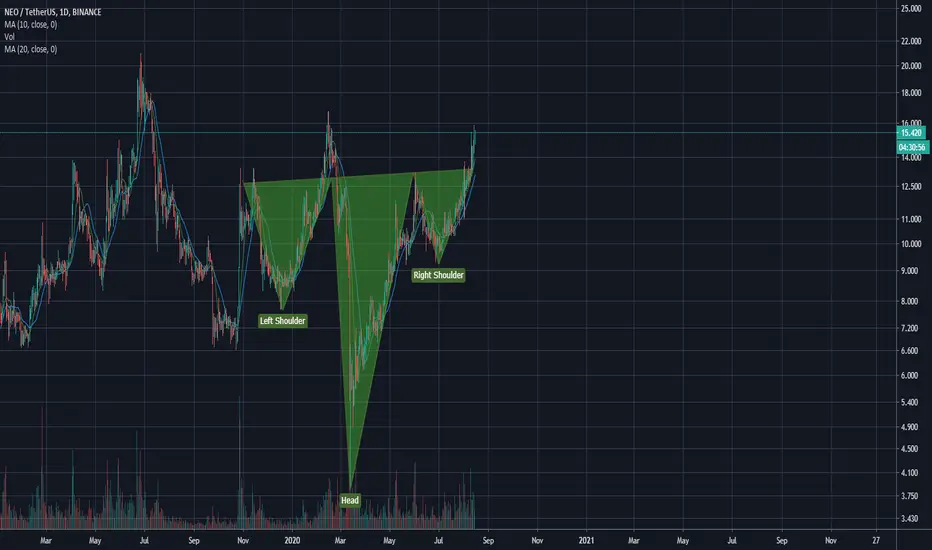
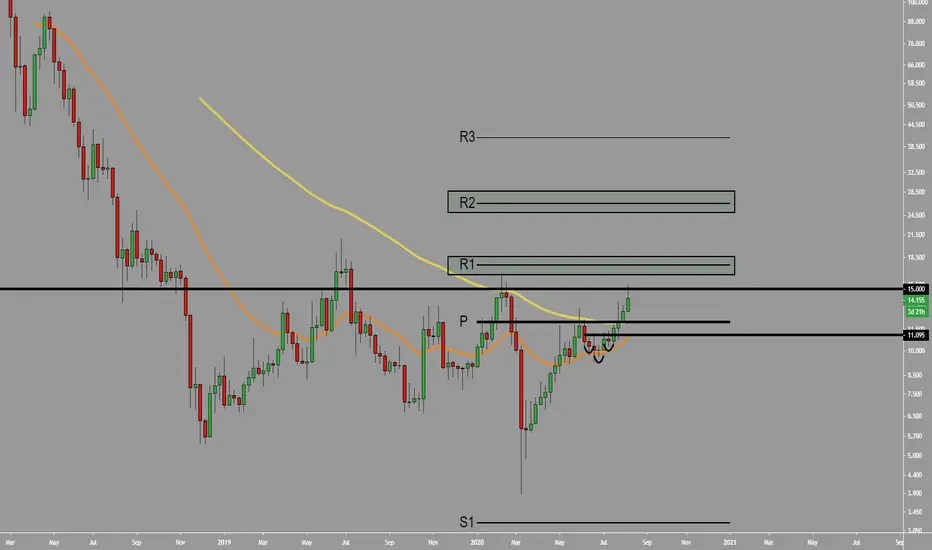
NEO Weekly Breakout Incoming?Looking at the NEO weekly chart we see a clear and defined resistance at the $15 level. A break and close above this on a weekly chart would likely trigger a rally to the R1 at $17 and possibly even as high as the R2 pivot at $26.
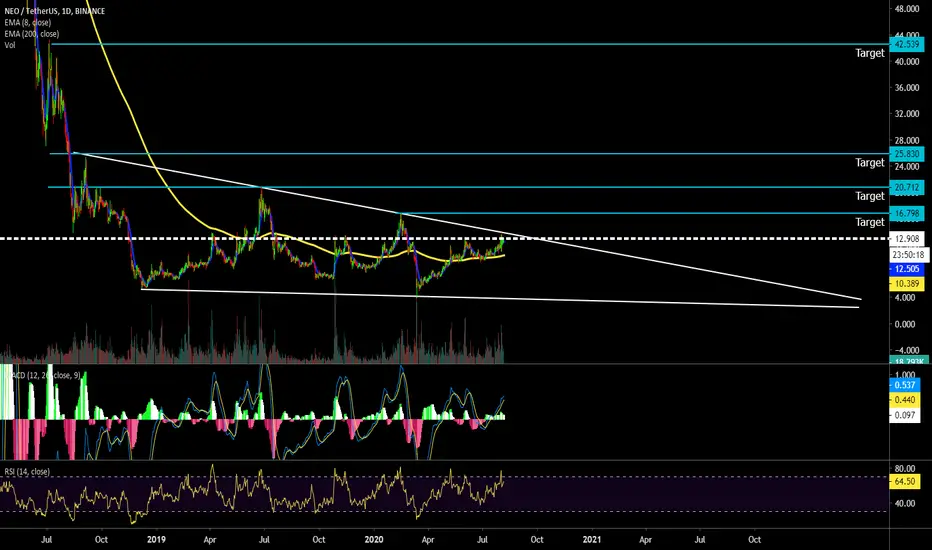
NEO-USDT: Broke above long term resistanceHello,
Here we have NEO Daily chart, where we see NEO broke above the descending resistance line (yellow) yesterday. For today if we see this line getting tested and hold then NEO could have nice move up towards 18$ and 21$ targets.
I will also be watching this green support line for bounces to catch.

Neo USDT Long Term Target. Target is >1k$Building good long position at Binance using their margin x3 option.
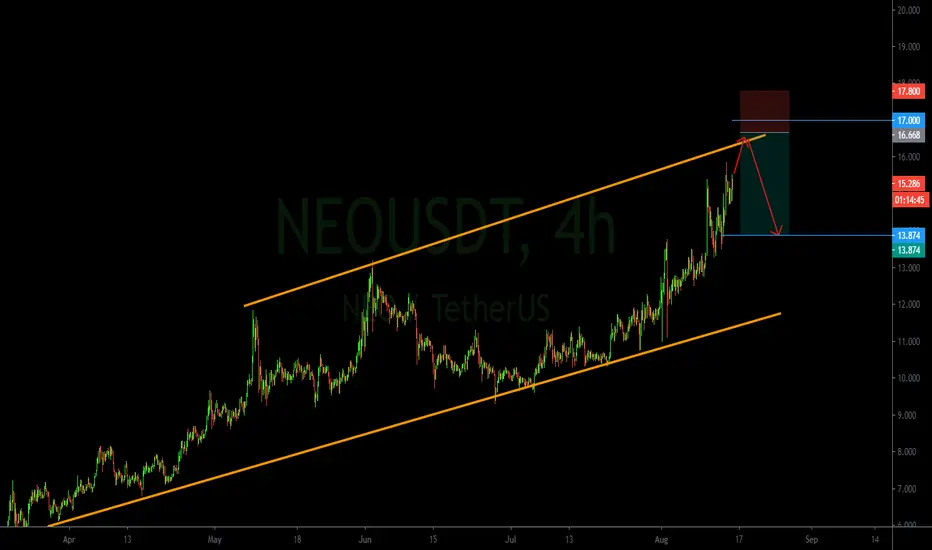
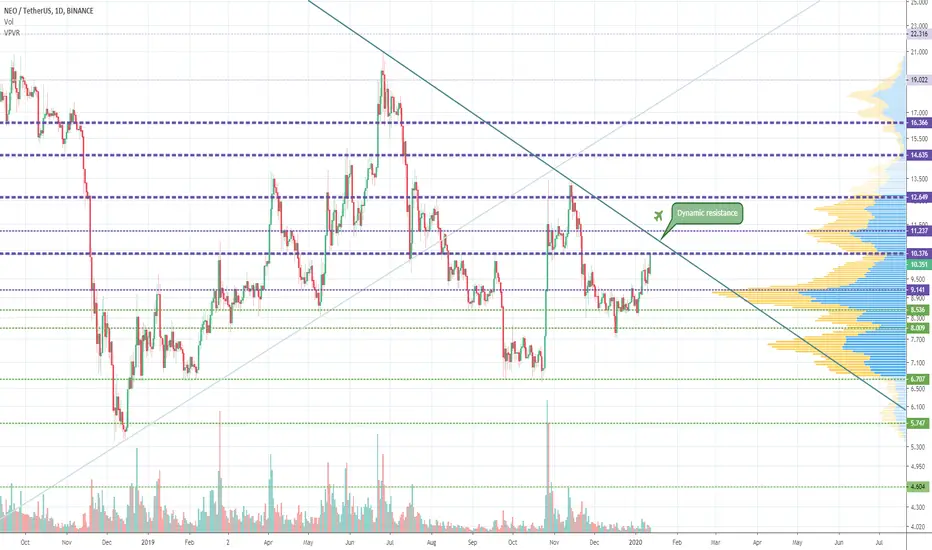
NEO / USDT First Sell Zone, correction and FLY!NEO came to first sell zone, all levels to buy (green) and purple (sell) is actual.
Be careful near dynamic resistance.
Good luck!
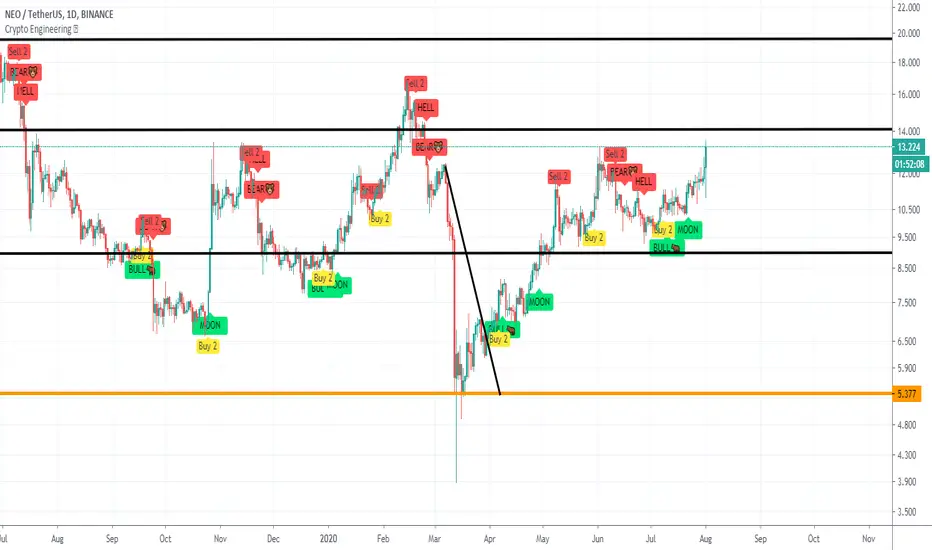
NEOUSDT ANALYSİSI have 4 positive signals If you hold this coin you can sell at the resistance line( $ 14.10) min. % 20 profit guarantee
or you can wait for turning resistance line to the support line ( $ 14.10) after that you can make more profit.
I will buy it if the resistance line turns to support line( $ 14.10) and ı will watch EngineeringRobo' s sell signal
If you want to use EngineeringRobo please dm me .
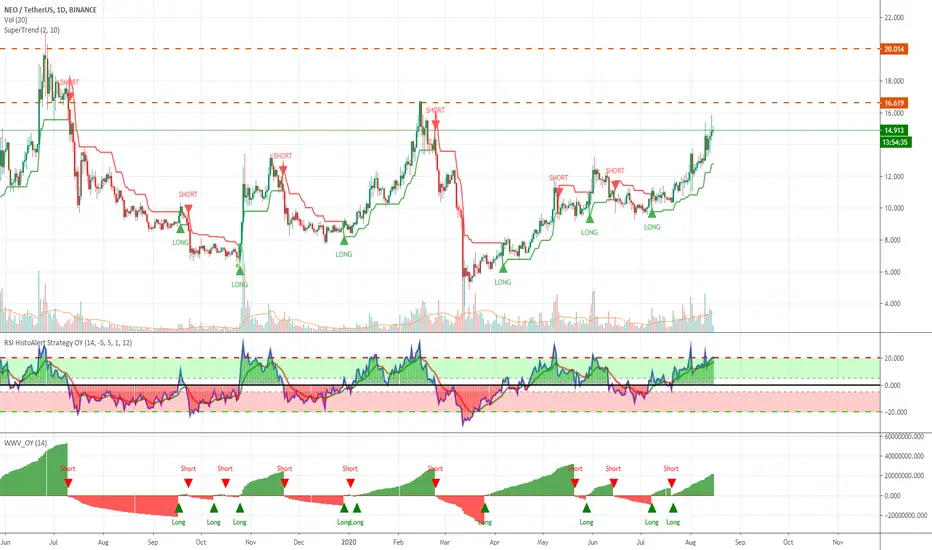
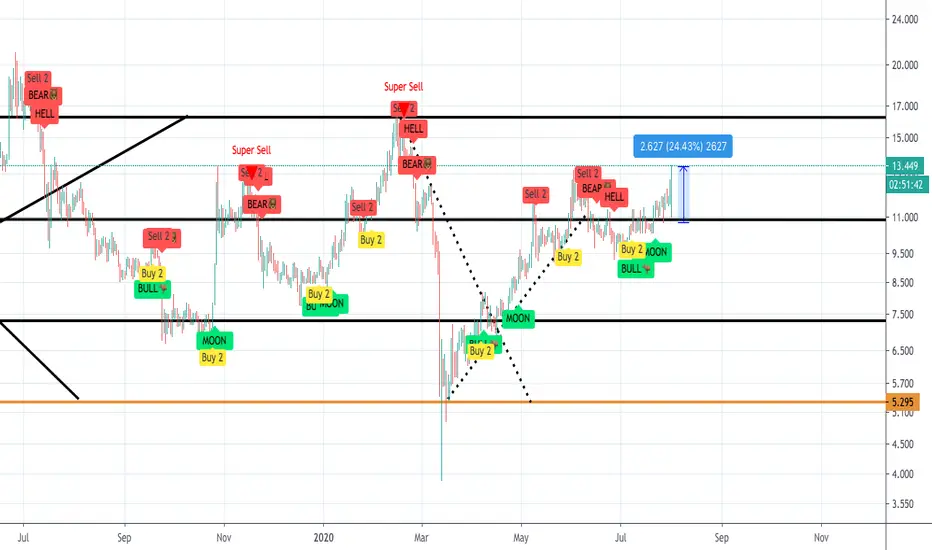
NEOUSDT AnalysisIf you listened EngineeringRobo's BUY 2 signal at the beginning of July and bought, enjoy your 24.43% PROFIT!
If you bought NEO, do not hurry to sell since there are 3 BUY signals from EngineeringRobo, and yet, no SELL signals.
If you want, you can take profit at the resistance level ($16.28) or you can watch EngineeringRobo's Sell signals.
Also, if you haven't bought yet & if you really want to buy right now, I'd recommend you to keep in mind to follow EngineeringRobo's sell signals.
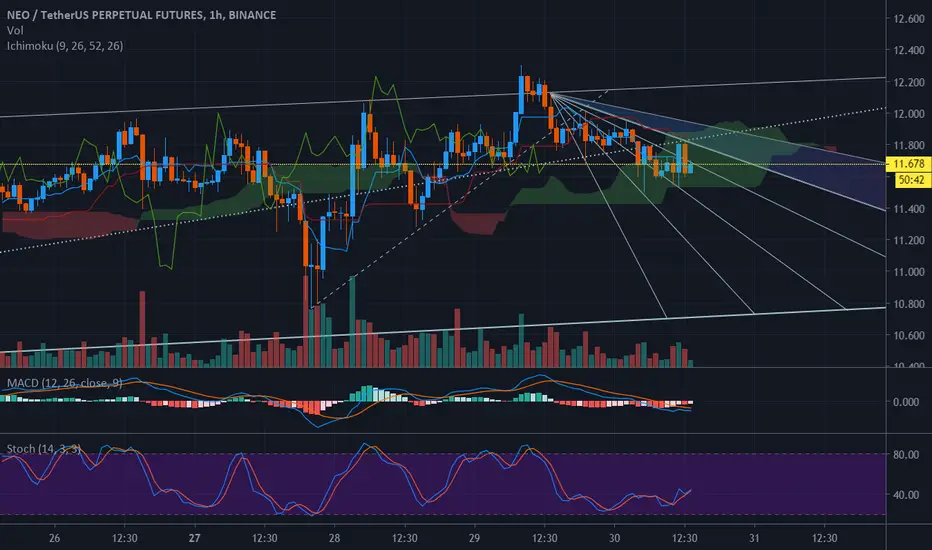
Near Trend Started On Neo, Going to correct itself then go upNEOUSDT Analysis
A few hours back crossover of Kijun (Red Line) and Tenken (Blue Line) which gave us a weak sell signal because the price was above the KUMO cloud and then price went into the KUMO cloud which means it is consolidating and another sign was shown when the crossover of cloud happened which has started Red cloud that also means the price is going down. There will be a Strong sell signal if price closes below the KUMO cloud and other signs are not reversed.
The main trendlines that I have plotted in this secondary trend are around 12.250 which is resistance and around 10.78 which is support. There is also one internal trendline that I plotted before which was support now price has penetrated support and support became the resistance. It will have to cross this internal resistance in order to go upward. There are also other resistances like the border of cloud and Redline.
I initiated a short position when price struck my resistance and now the target is major trendline support of the secondary trend which is around 10.8.