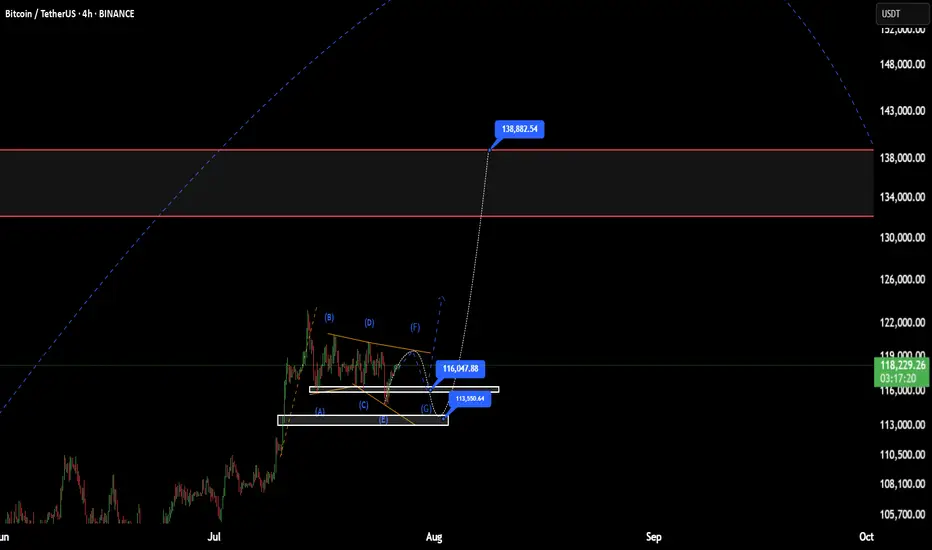
BTC(based on NEo wave)I think wave G is finished and soon it will pump to 138K.
stop loss is 115500.
attention:138K is the first target of these bullish waves.
Neo Wave
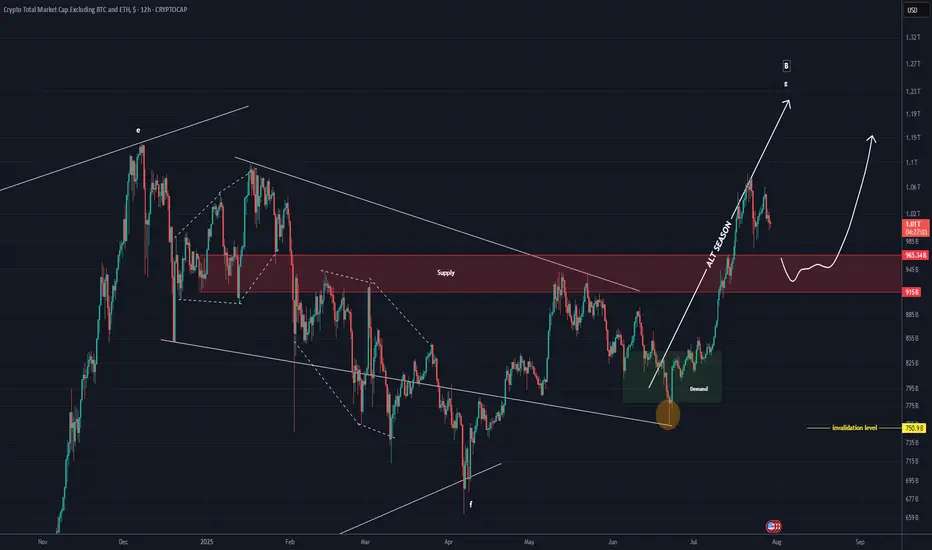
TOTAL 3 New Update (12H)This analysis is an update of the analysis you see in the "Related publications" section
This index has broken below the red zone; if a pullback to this area occurs, it may act as support again and the index could move upward
For risk management, please don't forget stop loss and capital management
Comment if you have any questions
Thank You
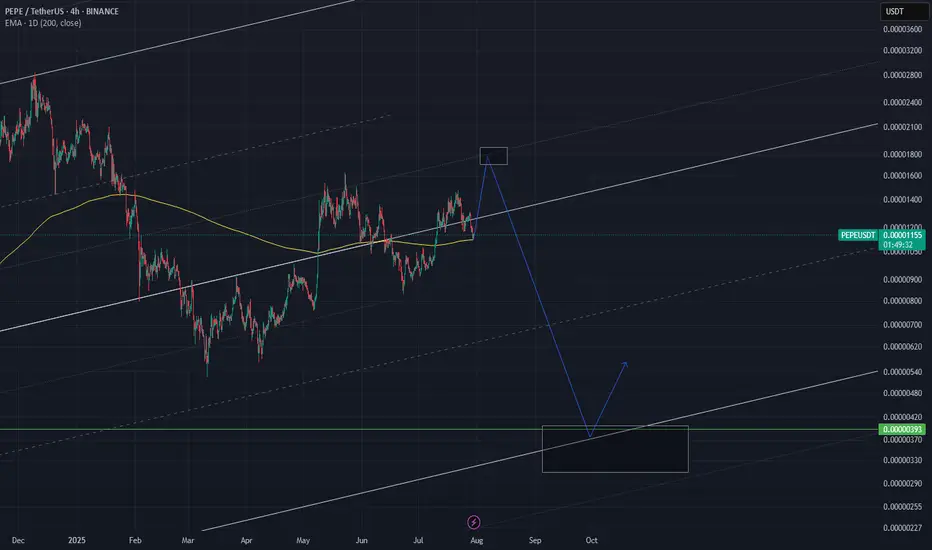
Get Ready to Sell...I'm expecting another swing high (probably by FOMC upcoming statement) just before a an almost 80% drop!
Get ready to sell your PEPE and other crypto before the huge drop.
YOU HAVE BEEN WARNED !!!
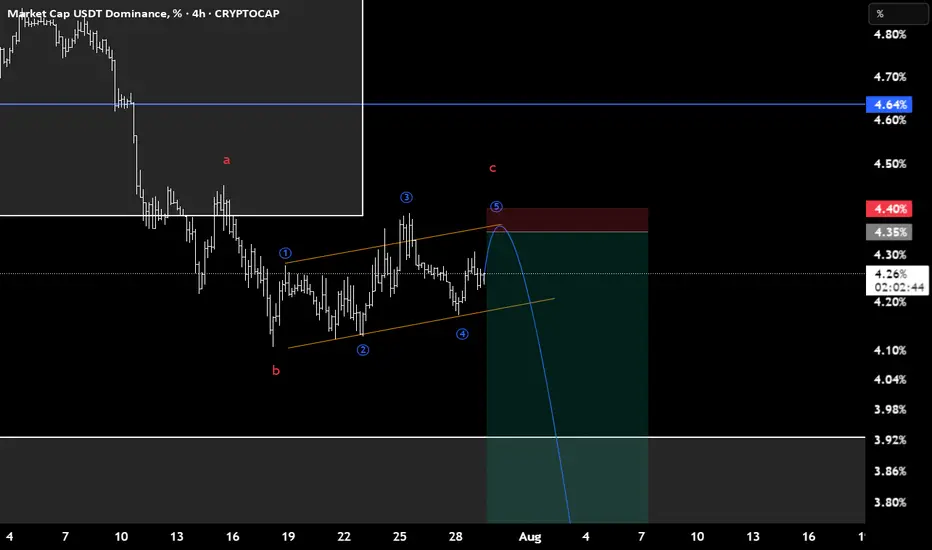
USDT.D(based on NEo wave)I consider this branch as a flat and c wave is the terminal with 3rd extended.
stop loss is 4.4.
Doge(based on NEo wave)confirmation of finishing the E wave of triangle is here now.
it takes about 400 days for all targets to pass.
see the related last chart of doge.

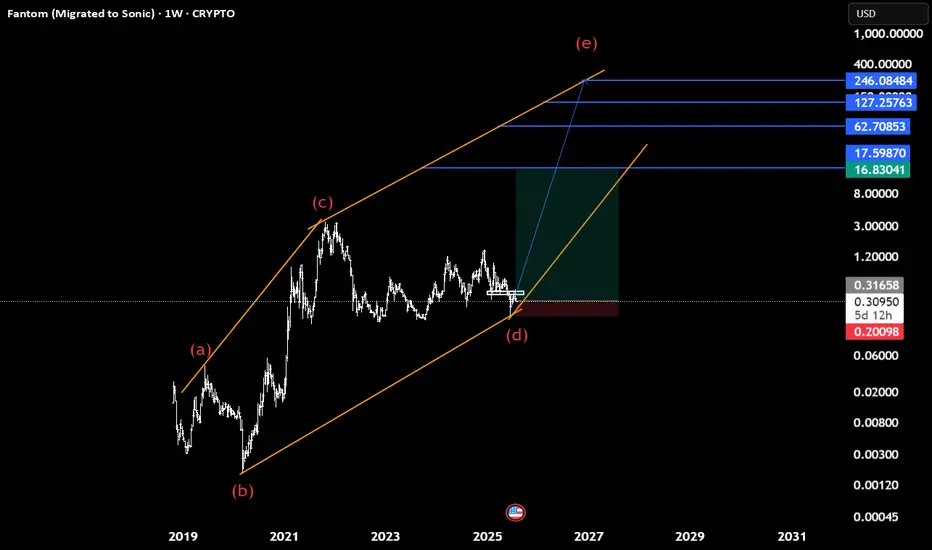
Sonic(based on NEo wave)Soon Sonic will start heavy bullish waves to the targets which shown with blue lines.
95% it is a diamnod diametric and we cant consider this as descending triangle because there is no overlap between wave d and a.
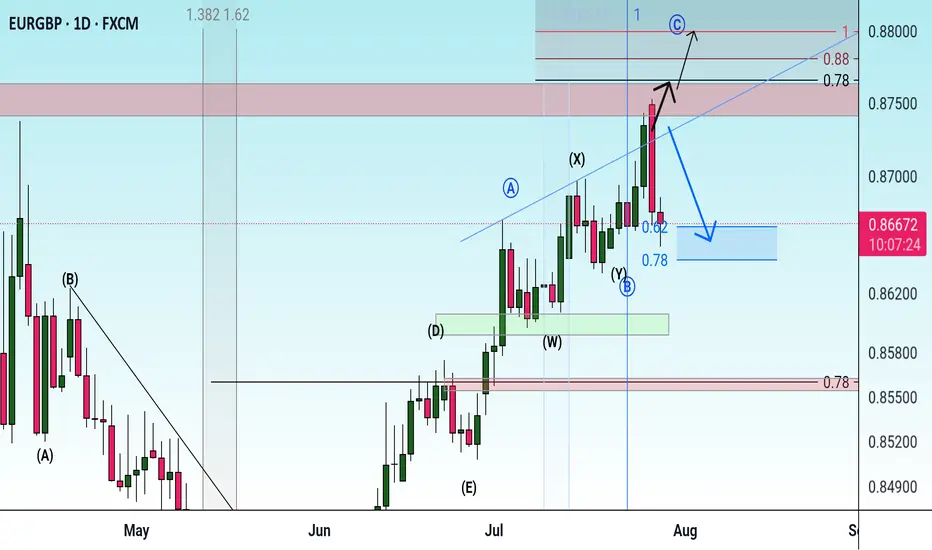
Possibility of uptrend As long as the indicator is above the green resistance zone and the resistance trend line is not consolidated, the continuation of the downtrend is likely. If the strong indicator breaks through the mentioned resistance zone, a long-term uptrend will be formed.
Correction It is expected that the price will consolidate below the trend line and continue the downtrend to the specified support levels. In this case, a three-wave pattern will form.
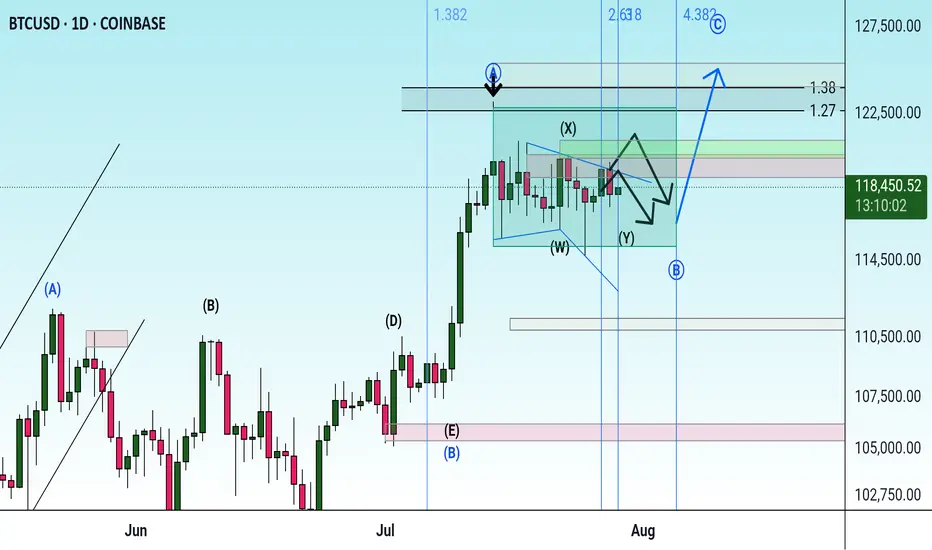
Check the trend Given that there is a possibility of a triangle pattern forming, it is expected that the price will change direction at the current resistance level and a downtrend will begin. If the price consolidates above the green resistance level, the uptrend will likely continue.
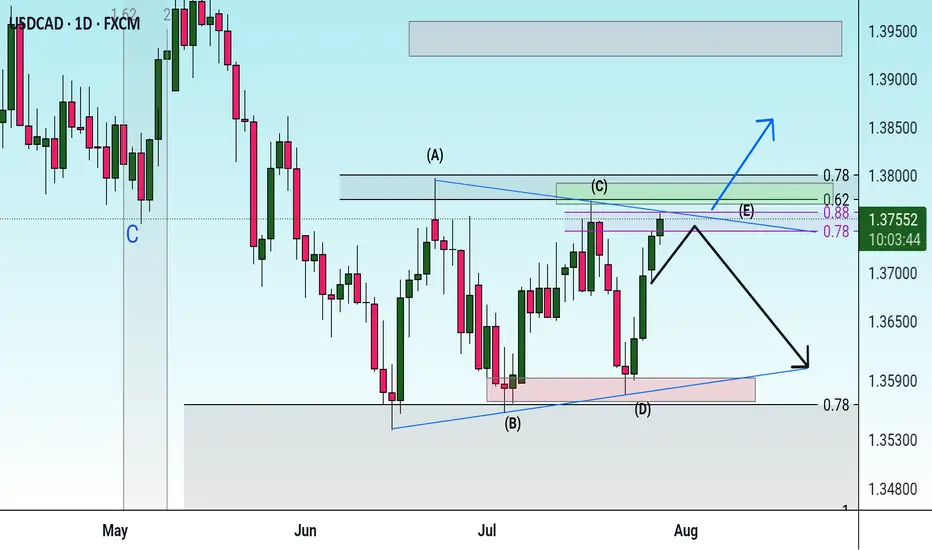
Correction It is expected that the downtrend will continue to form until the specified support levels. Then there is a possibility of a trend change and the start of an uptrend. If the price breaks through the support area, the downtrend will continue to the next support area.
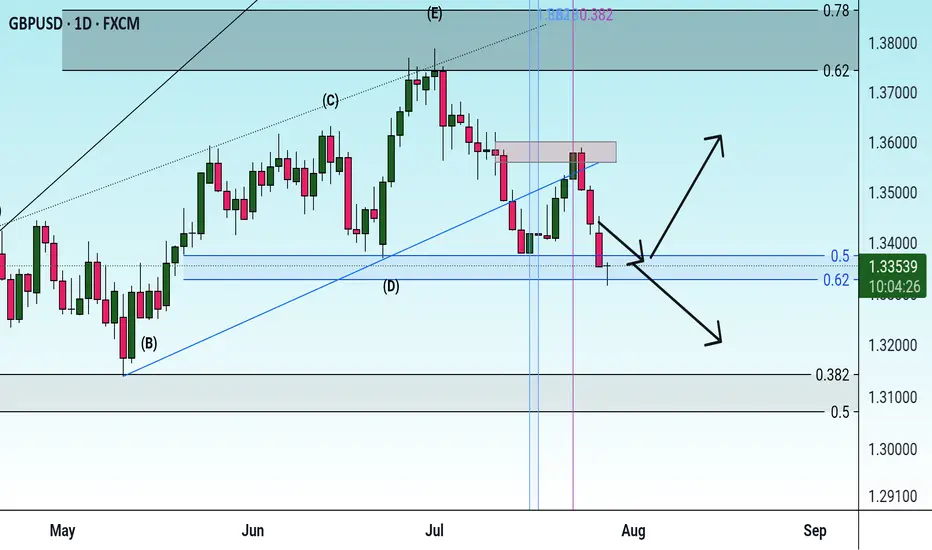
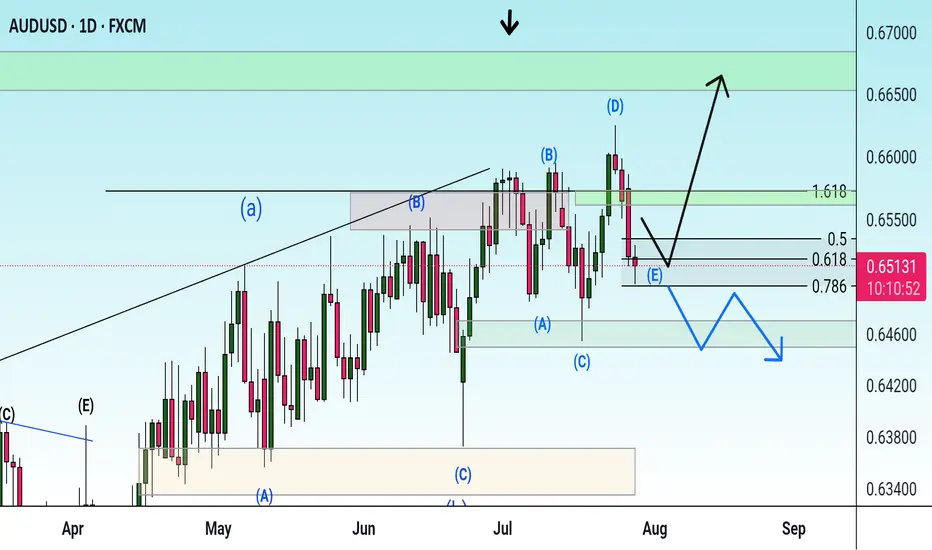
Possibility of correction As long as the price fluctuates above the support trend line, the continuation of the uptrend is likely. If the price crosses the support trend line, it will be a confirmation of the downtrend and the start of a downtrend or correction is likely.
Downtrend If the price can break through the support trend line, a continuation of the downtrend to the support levels is likely. Otherwise, an uptrend is possible with consolidation above the support level.
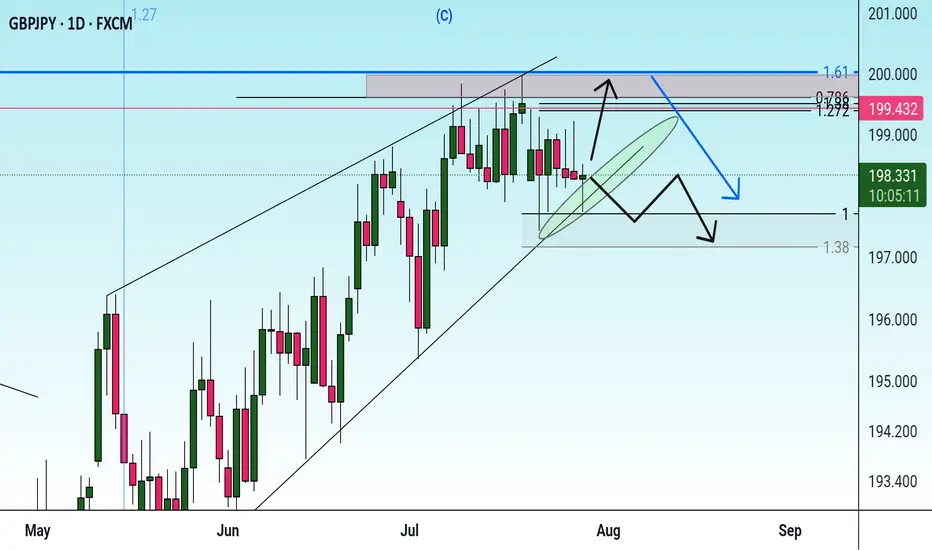
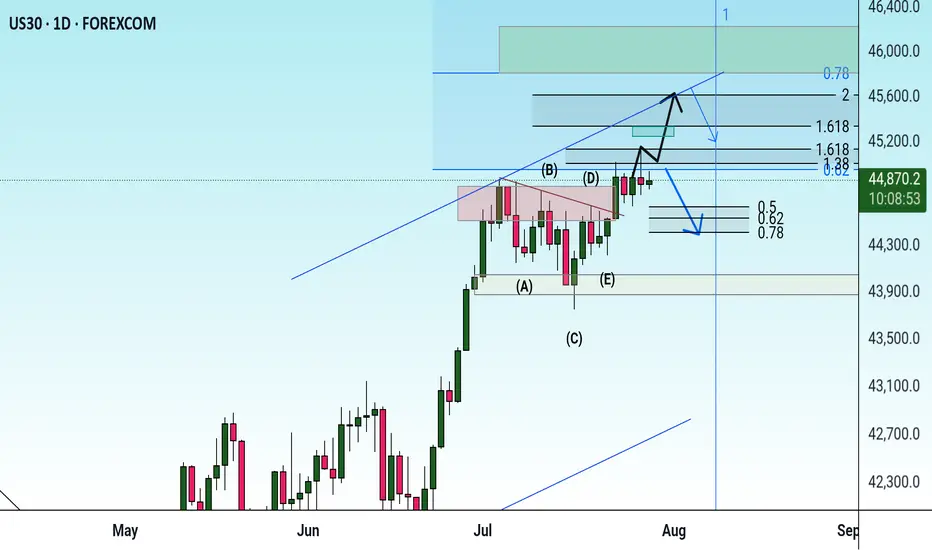
Check the trend Given the price behavior within the current resistance range, possible scenarios have been identified. It is expected that after some volatility and correction, we will see a continuation of the upward trend.
Possibility of uptrend The uptrend is expected to move in the specified direction and advance to the specified targets. If the indicator does not consolidate above the current resistance level, there is a possibility of a double-digit combination pattern. Then a correction is likely.
correction The corrective pattern is expected to move along the specified path and, after reaching the time frame, a trend change is expected to occur.
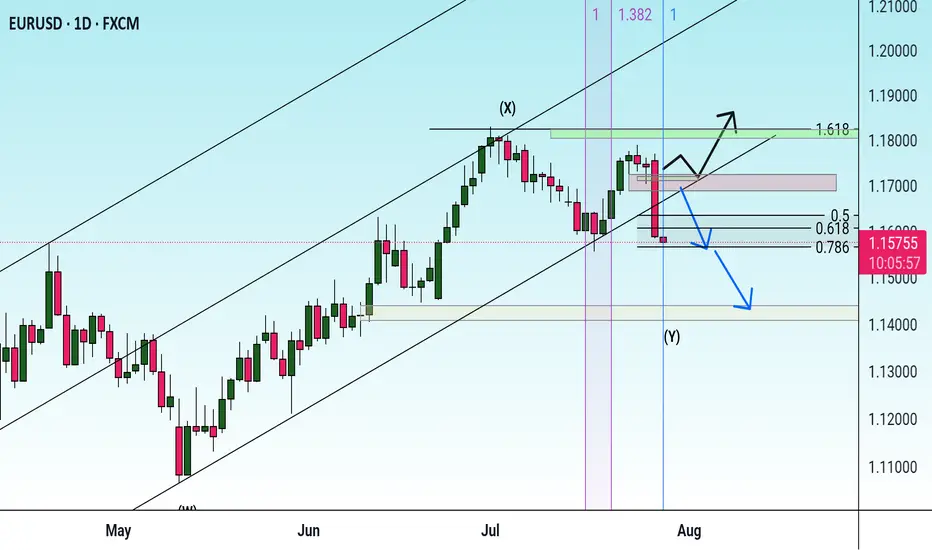
Check the trend A triangle pattern is expected to form within the current support range. Then the start of an uptrend is likely. If the price breaks through the 78.6% level, a continuation of the correction and downtrend is possible.
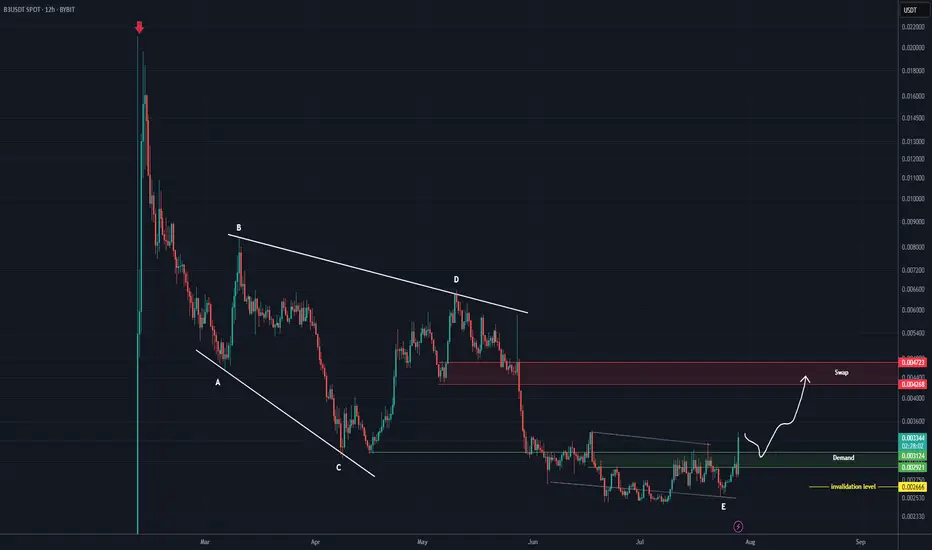
B3 Analysis (12H)From the point where the red arrow is placed on the chart, the B3 correction has started. It appears we have an expanding/diagonal/symmetrical triangle, and wave E now seems to be complete.
As long as the green zone holds, the price could move toward the red box, which is a swap zone.
A daily candle closing below the invalidation level will invalidate this analysis.
For risk management, please don't forget stop loss and capital management
Comment if you have any questions
Thank You
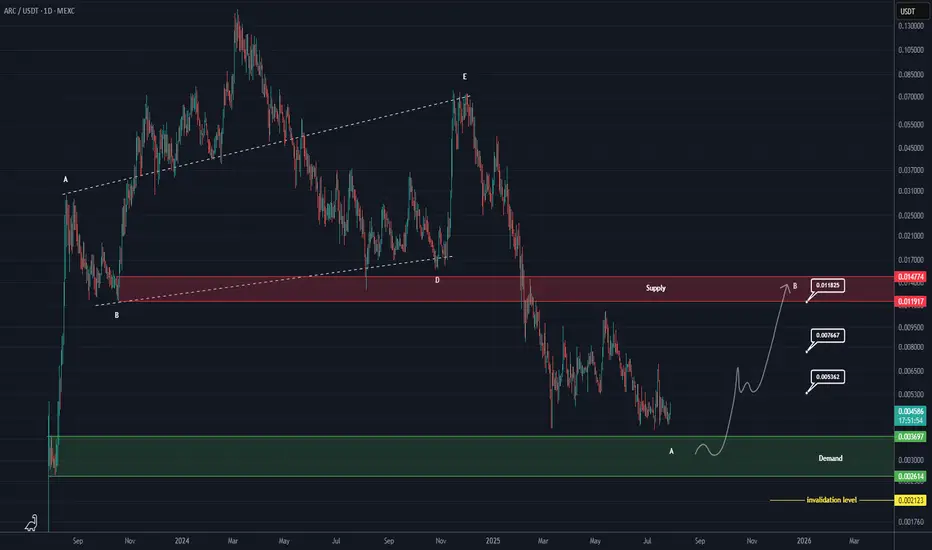
ARC Buy/Lonf Setup (1D)The ARC symbol, after completing a triangle and undergoing significant price and time correction, is approaching a strong and important origin.
It is expected that upon reaching the green zone, it will move toward the specified targets.
Since trading this symbol carries its own risks, make sure to practice proper risk management.
The targets are marked on the chart.
A daily candle closing below the invalidation level will invalidate this analysis.
For risk management, please don't forget stop loss and capital management
When we reach the first target, save some profit and then change the stop to entry
Comment if you have any questions
Thank You
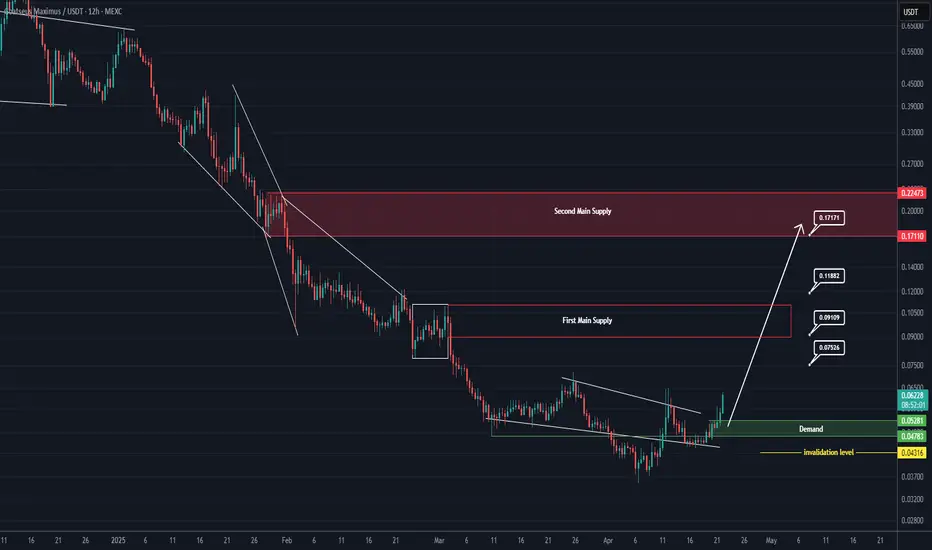
GOAT Looks Bullish (12H)It seems that a wave A of a higher-degree structure has completed, and the price is forming a triangle at the bottom, preparing for an upward movement in the form of either a wave B or a new impulse wave. Since this wave belongs to a higher degree, we expect the upcoming bullish wave to take time and show a significant upward retracement.
Try to avoid entering during pumps, and instead focus on entries during price corrections.
As long as the green zone holds, the price has the potential to move upward.
A daily candle closing below the invalidation level will invalidate this outlook.
For risk management, please don't forget stop loss and capital management
When we reach the first target, save some profit and then change the stop to entry
Comment if you have any questions
Thank You
ALCH Looks Bearish (8H)ALCH is one of the altcoins that began its bullish rally earlier than others.
From the point where we placed the green arrow on the chart, it appears that an ABC correction has completed.
As long as the red box is maintained, price may move toward the FVG zone.
Targets are marked on the chart.
Additionally, a liquidity pool is forming below the candles, which is expected to be swept soon
A daily candle closing above the invalidation level would invalidate this bearish outlook.
For risk management, please don't forget stop loss and capital management
Comment if you have any questions
Thank You

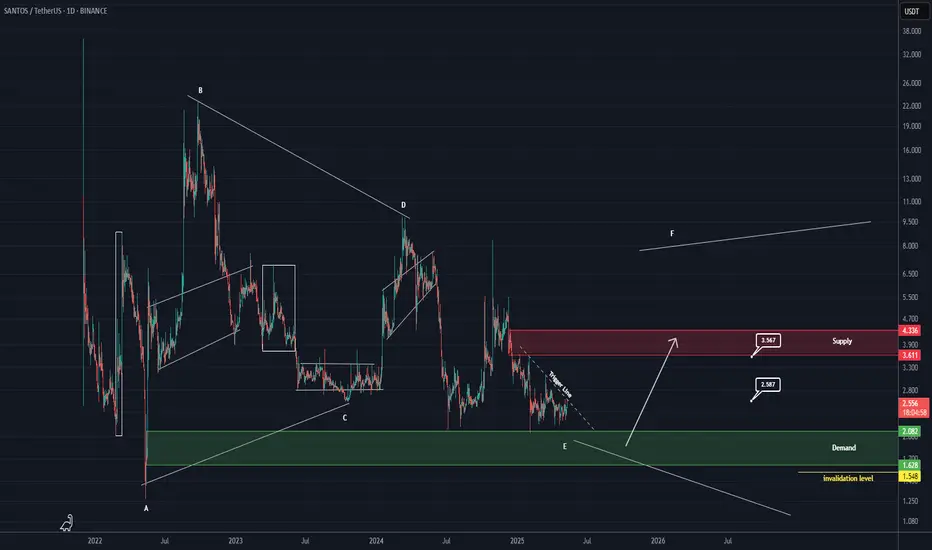
SANTOS ANALYSIS (1D)Football-related tokens in the crypto market have been quiet for a while and seem to be dormant. One of the tokens that shows good inflow during its moves is SANTOS.
SANTOS appears to be forming a symmetrical triangle and is currently at the end of wave E. While there are multiple wave count scenarios for this token, it is sitting on a strong support zone.
As long as it holds the green zone, it has the potential to move toward the targets.
However, a daily candle closing below the invalidation level will invalidate this analysis.
For risk management, please don't forget stop loss and capital management
When we reach the first target, save some profit and then change the stop to entry
Comment if you have any questions
Thank You
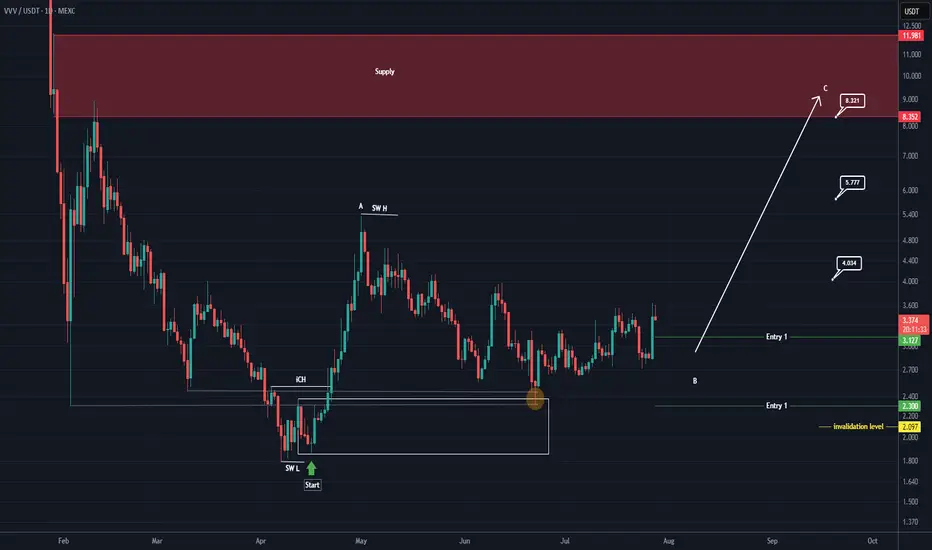
VVV Looks Bullish (1D)From the point where we placed the red arrow on the chart, it seems that the bullish phase VVV has begun.
This phase can be considered as an ABC structure.
We appear to be in the late stages of wave B.
We have identified two entry points to join the continuation of the bullish phase VVV. The likelihood of Entry 2 being reached is low, but you should split the volume you want to invest in this coin into two parts and keep some for Entry 2.
The targets are marked on the chart.
A daily candle closing below the invalidation level will invalidate this analysis.
For risk management, please don't forget stop loss and capital management
When we reach the first target, save some profit and then change the stop to entry
Comment if you have any questions
Thank You
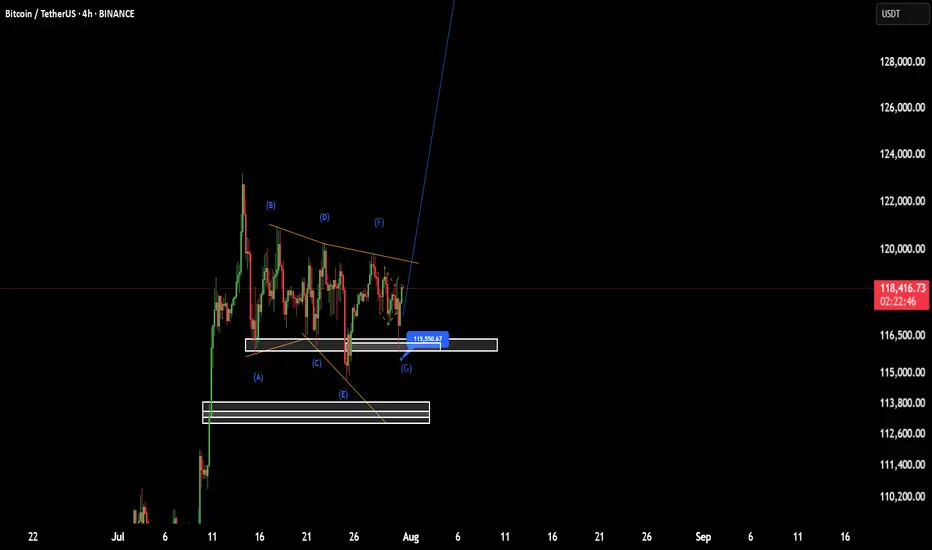
BTC(based on NEo wave)This range price is shown as a bow-tie diametrical.
I think G wave will end at one of those prices, 113 or 116
after this it will start a good bullish wave.
stop loss is 110K and the first target is 138K.