Forecasting the S&P 500Forecasting the S&P 500: A Complex Task
Forecasting the S&P 500, a major US stock market index, is a challenging endeavor due to the multitude of factors influencing its movement. These include economic indicators, corporate earnings, interest rates, geopolitical events, and investor sentiment.
Key Factors to Consider:
Economic Indicators:
GDP Growth: A strong economy generally supports stock prices.
Unemployment Rate: A low unemployment rate indicates a robust labor market, which can boost corporate profits and stock prices.
Inflation: High inflation can negatively impact corporate profits and stock prices due to increased costs.
Corporate Earnings:
Profit Growth: Strong corporate earnings growth can drive stock prices higher.
Earnings Expectations: Market expectations for future earnings play a significant role in stock price movements.
Interest Rates:
Federal Reserve Policy: The Federal Reserve's monetary policy decisions, particularly interest rate changes, can have a substantial impact on stock prices. Rising interest rates can make borrowing more expensive for businesses and reduce the attractiveness of stocks relative to bonds.
Geopolitical Events:
Global Events: Political instability, trade wars, or natural disasters can affect market sentiment and stock prices.
Investor Sentiment:
Risk Appetite: Market sentiment can shift rapidly, influencing stock prices. During periods of risk aversion, investors may be more likely to sell stocks.
Forecasting Methods:
Fundamental Analysis: This method involves analyzing economic indicators, corporate earnings, and other factors to assess the underlying value of stocks.
Technical Analysis: This approach uses historical price data and charts to identify patterns and trends that may predict future price movements.
Quantitative Analysis: This method employs statistical models and algorithms to analyze large datasets and identify correlations between variables that may influence stock prices.
It's important to note that no forecasting method is foolproof. Stock markets are highly volatile, and unexpected events can significantly impact prices. A combination of fundamental, technical, and quantitative analysis can provide a more comprehensive understanding of market dynamics.
Would you like to explore any of these factors or methods in more detail? I can also provide information on specific forecasting tools or resources.
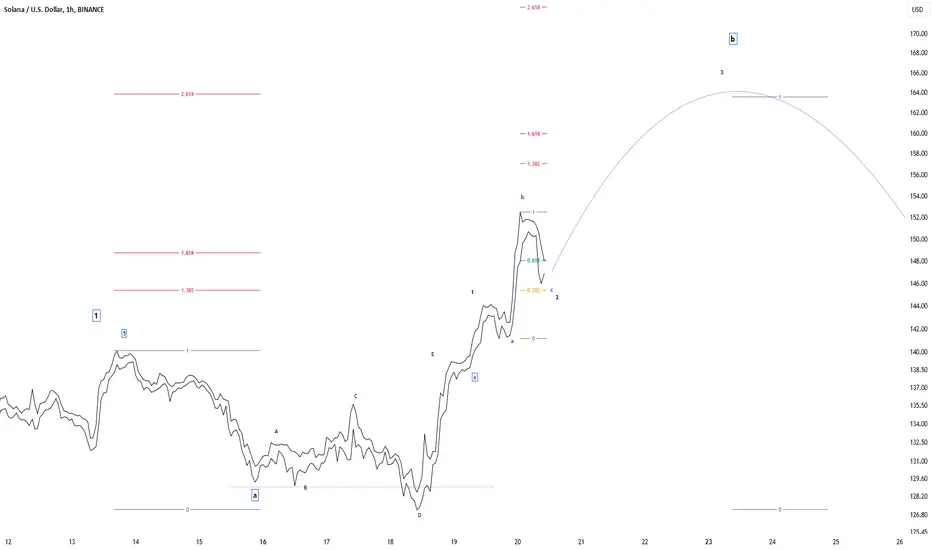
Neowave-forecast

The forecasting of SOLUSDThe forecasting of SOLUSD prices can be a complex task influenced by various factors, including market sentiment, economic conditions, technological developments, and regulatory changes. While there's no guaranteed method to predict future prices, here are some approaches that can be considered:
1. Technical Analysis:
Chart Patterns: Identify recurring patterns in price charts, such as head-and-shoulders, triangles, or double tops/bottoms, to anticipate potential price movements.
Indicators: Use technical indicators like moving averages, relative strength index (RSI), and Bollinger Bands to gauge overbought/oversold conditions and potential trend reversals.
2. Fundamental Analysis:
Market Sentiment: Assess the overall sentiment towards SOLUSD and Solana, considering factors like news, social media discussions, and investor behavior.
Economic Factors: Evaluate the impact of macroeconomic factors, such as interest rates, inflation, and global economic growth, on the cryptocurrency market.
Technological Developments: Analyze advancements in Solana's technology, including scalability improvements, new features, and partnerships, as they can influence investor confidence and demand.
Regulatory Landscape: Monitor regulatory developments in the cryptocurrency space, both globally and domestically, as changes in regulations can significantly impact market dynamics.
3. Quantitative Analysis:
Statistical Models: Employ statistical models, such as time series analysis or machine learning algorithms, to analyze historical price data and identify patterns that could predict future movements.
Algorithmic Trading: Utilize automated trading systems that execute trades based on predefined rules and algorithms, often incorporating technical and fundamental analysis.
4. Expert Opinion:
Analysts and Forecasters: Consult the opinions of financial analysts, cryptocurrency experts, and market forecasters who may provide insights into potential price trends.
5. Risk Management:
Diversification: Consider diversifying your cryptocurrency portfolio to manage risk and reduce exposure to potential price fluctuations.
Stop-Loss Orders: Set stop-loss orders to limit potential losses if the price moves against your expectations.
6. Disclaimer:
Past Performance: Remember that past performance is not indicative of future results. Cryptocurrencies are highly volatile, and prices can fluctuate significantly.
Research and Due Diligence: Conduct thorough research and due diligence before making any investment decisions in cryptocurrencies.
It's important to note that forecasting cryptocurrencies involves inherent risks, and there's no foolproof method to guarantee accurate predictions. Combining multiple approaches and staying informed about market developments can help you make more informed investment decisions.
I hope this information is helpful!
The forecasting of SOLUSD pricesThe forecasting of SOLUSD prices can be a complex task influenced by various factors, including market sentiment, economic conditions, technological developments, and regulatory changes. While there's no guaranteed method to predict future prices, here are some approaches that can be considered:
1. Technical Analysis:
Chart Patterns: Identify recurring patterns in price charts, such as head-and-shoulders, triangles, or double tops/bottoms, to anticipate potential price movements.
Indicators: Use technical indicators like moving averages, relative strength index (RSI), and Bollinger Bands to gauge overbought/oversold conditions and potential trend reversals.
2. Fundamental Analysis:
Market Sentiment: Assess the overall sentiment towards SOLUSD and Solana, considering factors like news, social media discussions, and investor behavior.
Economic Factors: Evaluate the impact of macroeconomic factors, such as interest rates, inflation, and global economic growth, on the cryptocurrency market.
Technological Developments: Analyze advancements in Solana's technology, including scalability improvements, new features, and partnerships, as they can influence investor confidence and demand.
Regulatory Landscape: Monitor regulatory developments in the cryptocurrency space, both globally and domestically, as changes in regulations can significantly impact market dynamics.
3. Quantitative Analysis:
Statistical Models: Employ statistical models, such as time series analysis or machine learning algorithms, to analyze historical price data and identify patterns that could predict future movements.
Algorithmic Trading: Utilize automated trading systems that execute trades based on predefined rules and algorithms, often incorporating technical and fundamental analysis.
4. Expert Opinion:
Analysts and Forecasters: Consult the opinions of financial analysts, cryptocurrency experts, and market forecasters who may provide insights into potential price trends.
5. Risk Management:
Diversification: Consider diversifying your cryptocurrency portfolio to manage risk and reduce exposure to potential price fluctuations.
Stop-Loss Orders: Set stop-loss orders to limit potential losses if the price moves against your expectations.
6. Disclaimer:
Past Performance: Remember that past performance is not indicative of future results. Cryptocurrencies are highly volatile, and prices can fluctuate significantly.
Research and Due Diligence: Conduct thorough research and due diligence before making any investment decisions in cryptocurrencies.
It's important to note that forecasting cryptocurrencies involves inherent risks, and there's no foolproof method to guarantee accurate predictions. Combining multiple approaches and staying informed about market developments can help you make more informed investment decisions.

EUR/USD Forecasting: A Complex TaskEUR/USD Forecasting: A Complex Task
Forecasting the EUR/USD exchange rate is a challenging endeavor due to numerous factors influencing its movement. These include economic indicators from both the Eurozone and the United States, geopolitical events, central bank policies, market sentiment, and technical analysis.
Key Factors to Consider:
Economic Indicators:
Interest Rate Differentials: The relative interest rates between the Eurozone and the United States can significantly impact currency exchange rates. Higher interest rates typically attract capital, leading to a stronger currency.
Gross Domestic Product (GDP): Economic growth rates in both regions can influence currency values. A stronger economy often leads to a stronger currency.
Inflation: Higher inflation can weaken a currency as it reduces the purchasing power of domestic goods and services.
Trade Balances: A trade deficit (importing more than exporting) can put downward pressure on a currency, while a trade surplus can strengthen it.
Central Bank Policies:
Monetary Policy: The actions of the European Central Bank (ECB) and the Federal Reserve (Fed) can have a profound impact on exchange rates. Interest rate changes, quantitative easing, and other policy measures can influence capital flows and currency values.
Geopolitical Events:
Political Instability: Political turmoil or uncertainty in either region can lead to currency volatility.
Trade Wars: Trade disputes or tariffs can disrupt global trade and affect exchange rates.
Market Sentiment:
Risk Appetite: Investor sentiment can influence currency markets. During periods of risk aversion, investors may favor safe-haven currencies like the US dollar.
Forecasting Methods:
Fundamental Analysis: This involves analyzing economic indicators, central bank policies, and geopolitical events to assess the underlying value of a currency.
Technical Analysis: This method uses historical price data and charts to identify patterns and trends that may predict future price movements.
Quantitative Analysis: This approach employs statistical models and algorithms to analyze large datasets and identify correlations between variables that may influence exchange rates.
It's important to note that no forecasting method is foolproof. Currency markets are highly volatile, and unexpected events can significantly impact exchange rates. A combination of fundamental, technical, and quantitative analysis can provide a more comprehensive understanding of market dynamics.

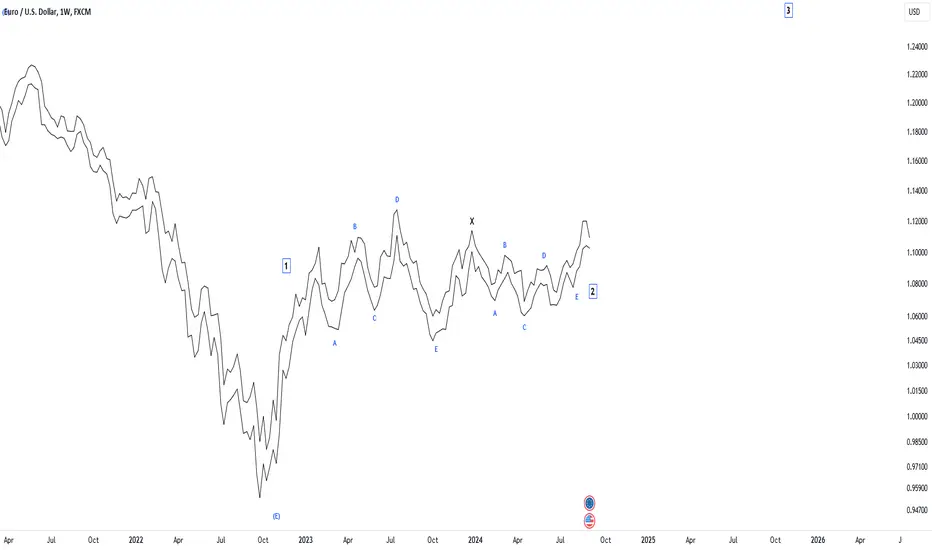
EURUSD ForecastingEUR/USD Forecasting: A Complex Task
EUR/USD forecasting is a challenging endeavor due to numerous factors influencing its price movement. These include:
Economic Indicators: GDP growth rates, inflation, unemployment rates, and interest rate decisions from the European Central Bank (ECB) and the Federal Reserve (Fed) significantly impact the exchange rate.
Geopolitical Events: Global conflicts, trade tensions, and political instability can cause sudden and substantial shifts in the EUR/USD.
Market Sentiment: Investor confidence, risk appetite, and speculative trading can drive short-term fluctuations.
While there's no foolproof method for predicting future EUR/USD prices, here are some approaches:
Fundamental Analysis
Economic Calendar: Monitor key economic releases from both the Eurozone and the United States.
Central Bank Policies: Analyze interest rate decisions and monetary policy statements.
Geopolitical Factors: Stay updated on global events that could affect the Euro or the Dollar.
Technical Analysis
Chart Patterns: Identify recurring patterns like head and shoulders, triangles, and double tops/bottoms.
Indicators: Use tools such as moving averages, Relative Strength Index (RSI), and Stochastic Oscillator to gauge momentum and overbought/oversold conditions.
Support and Resistance Levels: Pinpoint price levels where the market has historically turned around.
Quantitative Analysis
Statistical Models: Employ statistical methods like regression analysis and time series modeling to identify relationships between variables and predict future prices.
Machine Learning: Utilize algorithms to learn from historical data and make predictions.
Expert Opinions
Economists and Analysts: Follow the insights of experts in the field to gain valuable perspectives.
News and Market Commentary: Stay informed about current market trends and opinions.
Important Considerations:
No Guarantees: Even the most sophisticated forecasting methods cannot guarantee accurate predictions.
Risk Management: Implement risk management strategies to protect your capital.
Diversification: Consider diversifying your investments to reduce risk.
For real-time data and analysis, I recommend using financial platforms such as:
TradingView: Offers charts, indicators, and news.
Bloomberg Terminal: Provides comprehensive financial data and analysis.
Reuters: Offers news, market data, and analysis.
Would you like to explore any of these methods in more detail, or do you have a specific question about EUR/USD forecasting?
XAUUSD Analysis: A Quick OverviewXAUUSD is the ticker symbol for gold prices quoted in US dollars. Gold is often considered a safe-haven asset, meaning its value tends to increase during times of economic uncertainty or market volatility.
Key Factors Influencing XAUUSD:
Interest Rates: Higher interest rates can make gold less attractive as investors may choose to hold interest-bearing assets instead.
Inflation: High inflation can drive up the price of gold as it's seen as a hedge against inflation.
US Dollar Strength: A stronger US dollar can put downward pressure on gold prices as it becomes more expensive for non-US investors.
Geopolitical Events: Global tensions or crises can boost demand for gold as a safe-haven asset.
Supply and Demand: The balance between gold production and consumption can also impact prices.

XPTUSD Analysis by NEOWave WayXPTUSD Analysis: A Deep Dive into Platinum's Price Dynamics
XPTUSD is the ticker symbol for platinum priced in US dollars. Platinum, like gold and silver, is a precious metal often used in jewelry, industrial applications, and investments. Its price is influenced by a complex interplay of factors, including supply and demand dynamics, economic conditions, and geopolitical events.

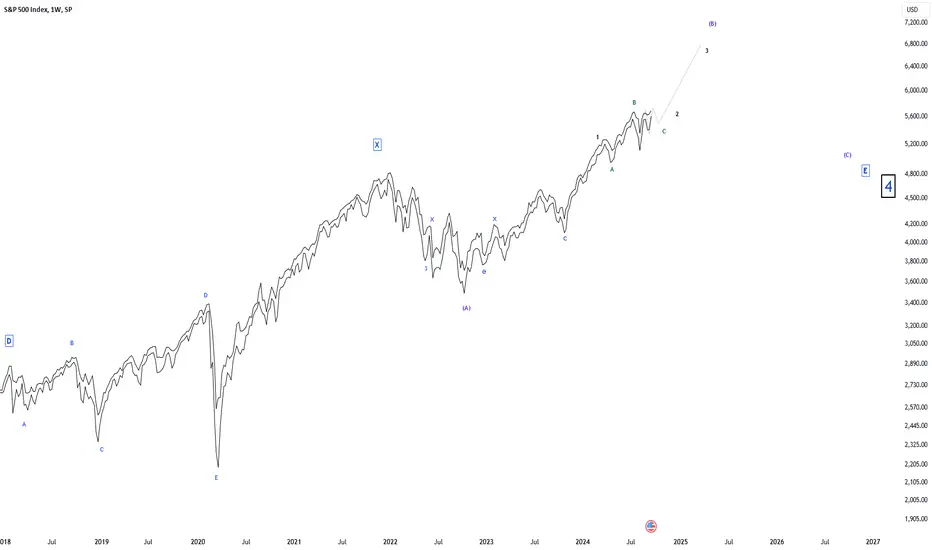
S&P500 NeoWave IdeaP 500 NeoWave Idea: A Potential Elliott Wave Analysis
Disclaimer: While Elliott Wave Theory can provide valuable insights, it's essential to remember that it's a subjective analysis tool, and market movements can be unpredictable. Always conduct thorough research and consider multiple factors before making investment decisions.

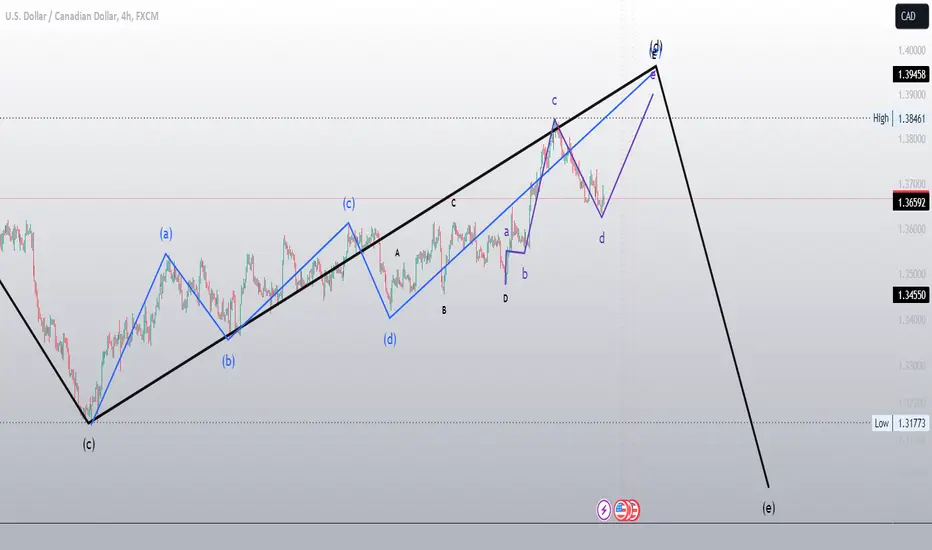
USDCAD US. Dollar / Canadian DollarIt is expected that this currency pair will start to fall after a little growth until it reaches the set limits
btc(based on NEo wave)I will sell all my bitcoins at 50K. every break on 50K and 52K is fake break and every good news is a signal to sell. like ETH after correction it has a good party and make yourself readyyyyyyyy.

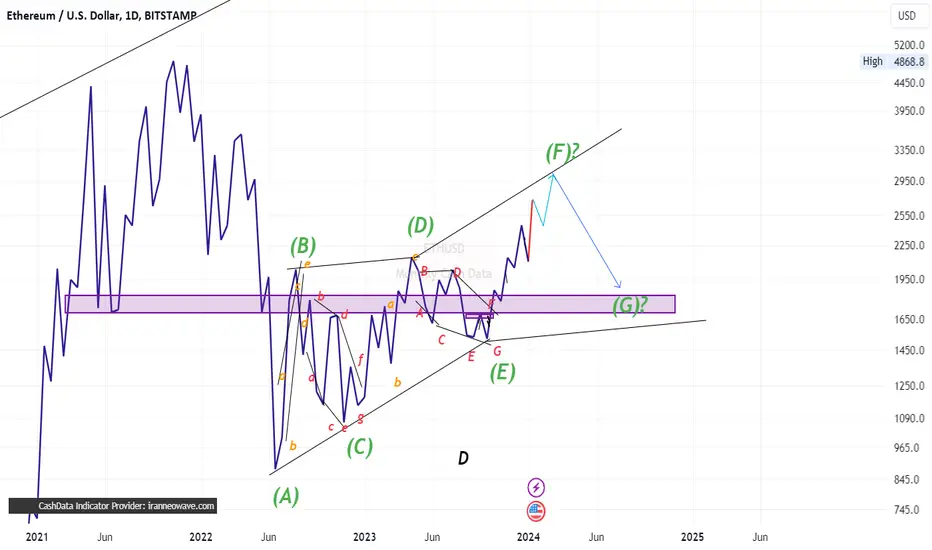
ETH(based on NEo wave)there is a good correction on the way and it is great chance to buy eth. I will sell all of my eth soon. after this correction we will have a party so make yourself ready for it!
FIL(based on NEo wave)my last analysis of this coin has failed but I didnt change up my mind.
so this is bow tie pattern and its ready to blow up soon!
my first target is 27$ and the others are clear.

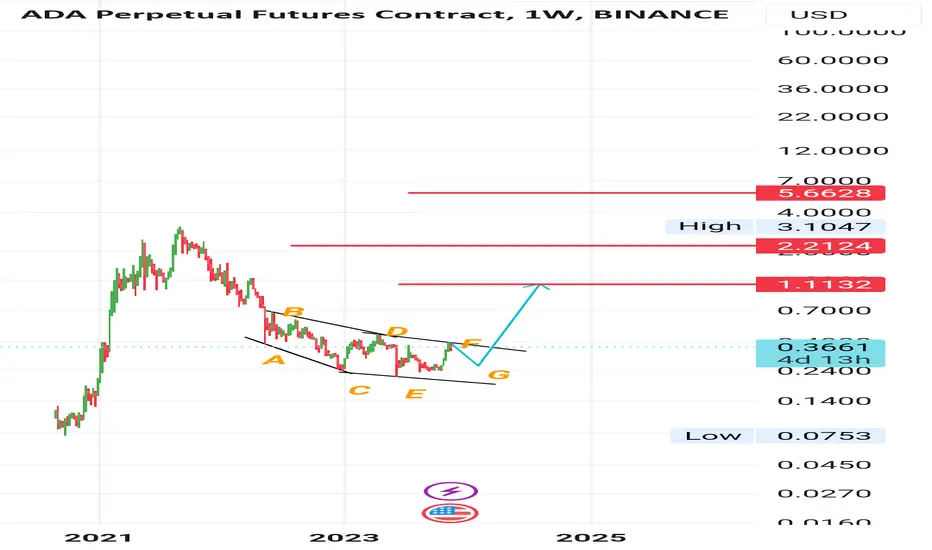
Ada(based on NEo wave)Now its recognizable pattern for me just a little time and price correction and it will start to grow.
My stop loss is wave E.
DYDX(based on NEo wave) there is a scenario for triangle and it has 22% stop loss! but is has a good risk to reward for first target, there are some other scenarios for this and maybe its a little risky!

BTC(based on NEo wave)from the last two ways of btc I considered that the wave 5 is not finished yet and after a little more correction bitcoin should start a strong bullish wave. USDT dominance is also like this pattern(flat)but it is reverse,I try to keep it updated.
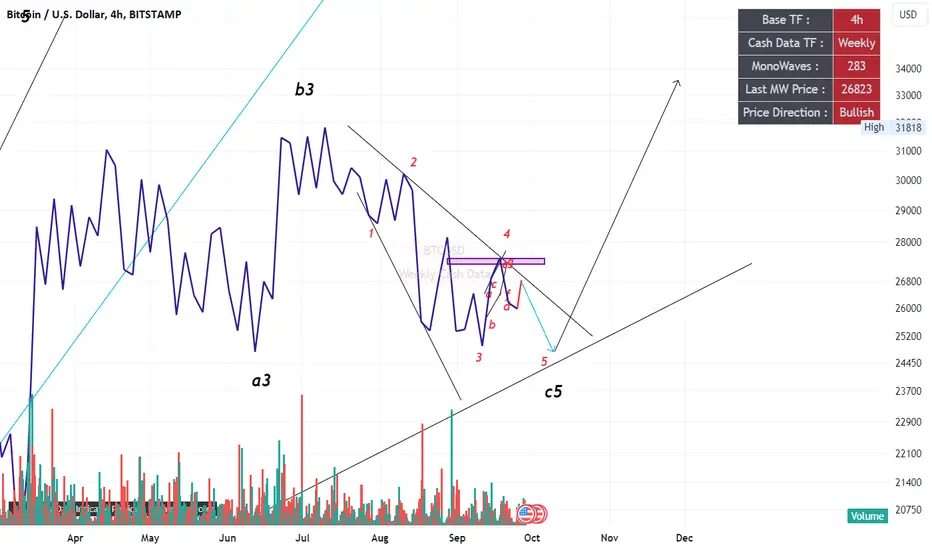
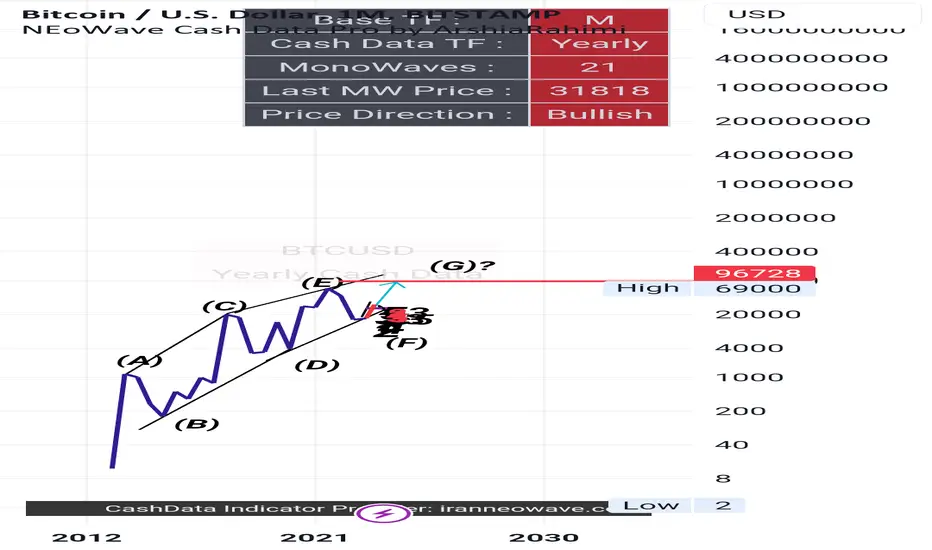
Btc(based on NEo wave)There is many targets and possiblities for wave G but for now I will target 96k....it can grow for 200k but it takes long time
Waiting is the best choice to it shows the structure of wave G.
Btc(based on NEo wave)The second scenario is the wave 5 of C wave is on the way and we should wait for it
But I would rather buying bitcoin step by step
My stop loss is 23 for both scenarios.

Btc(based on NEo wave)There is 2 bullish scenarios for bitcoin!
First is there is a flat corrective pattern and this C wave is finished and it has just started to grow!

ETH(based on NEo wave)Similar patterns on most of the charts, attention wave E could become incomplete.

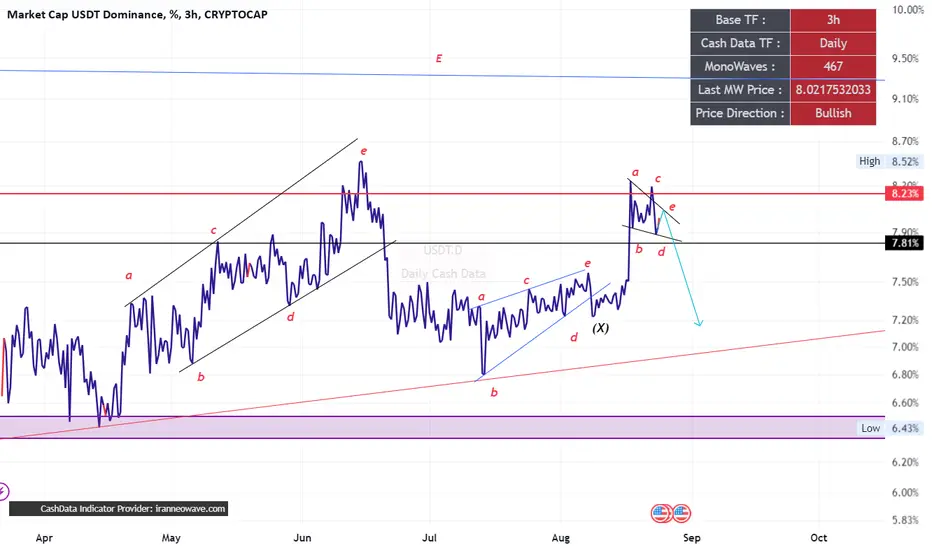
USDT.D(based on NEo wave)This is all of the E wave on daily TF but I am suspicious about the last branch , in the first sight it is triangle but it could be another patterns.the confirmation is breaking down the black line as I drew.
BNB(based on NEo wave)The second way that I think is this triangle and it is easier for trade and investing so use your strategy , but I think ETH is better for investing.

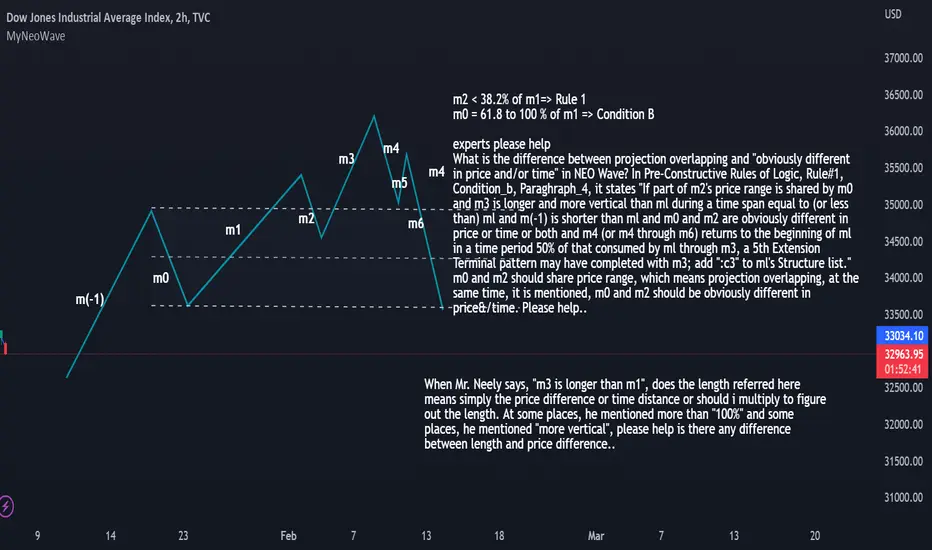
Neo Wave Learner doubtWhat is the difference between projection overlapping and "obviously different in price and/or time" in NEO Wave? In Pre-Constructive Rules of Logic, Rule#1, Condition_b, Paraghraph_4, it states "If part of m2's price range is shared by m0 and m3 is longer and more vertical than ml during a time span equal to (or less than) ml and m(-1) is shorter than ml and m0 and m2 are obviously different in price or time or both and m4 (or m4 through m6) returns to the beginning of ml in a time period 50% of that consumed by ml through m3, a 5th Extension Terminal pattern may have completed with m3; add ":c3" to ml's Structure list."
Here, m0 and m2 should share price range, which means projection overlapping, at the same time, it is mentioned, m0 and m2 should be obviously different in price&/time.
Experts please help..
Also, Mr. Neely mentioned, "m1 is longer than m3" in few other places, does the length means, by means of distance between 2 price points or by means of time distance or should i consider a multiple..