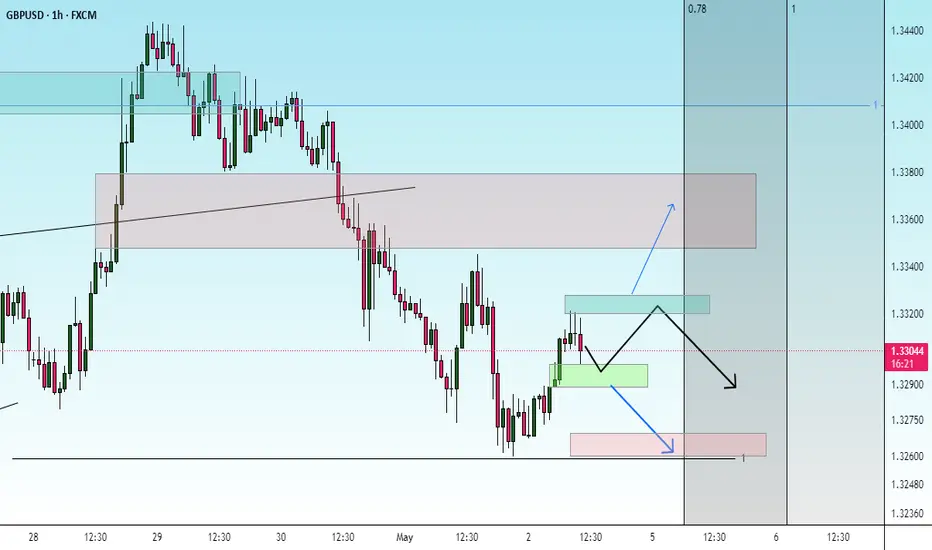
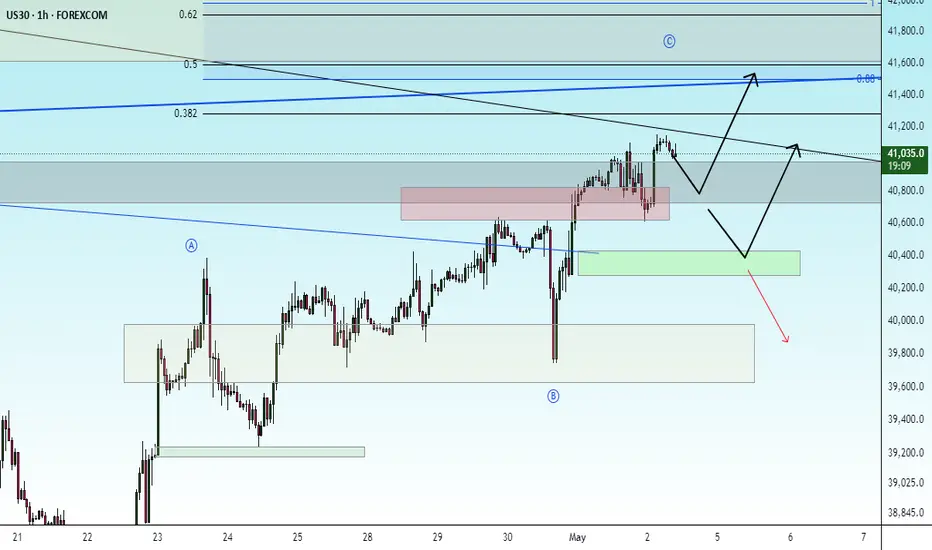
correctionAs long as the index fluctuates above the support range, the continuation of the upward trend will be likely. Otherwise, the continuation of the correction trend to the specified support range will be possible.
Neo Wave
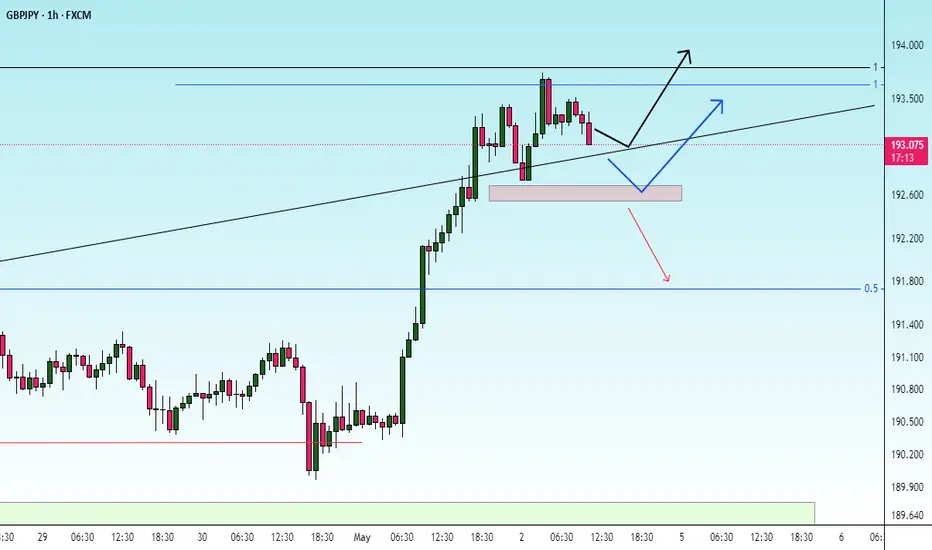
continue of uptrendIt is expected that a trend change will form within the current support range and we will witness the continuation of the upward trend. Otherwise, the continuation of the correction trend to the support trend line will be possible.

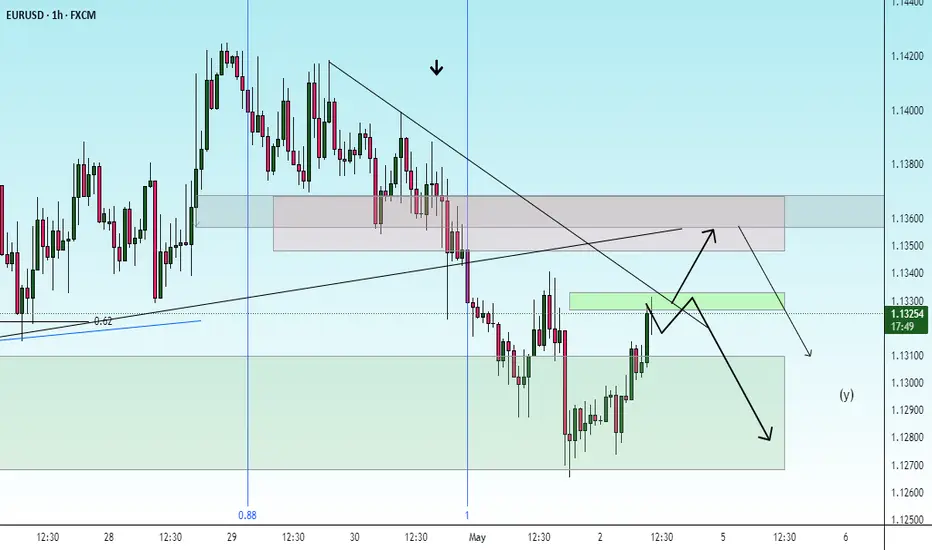
uptrendIt is expected that a trend change will form within the current support range and we will witness the start of an upward trend. Then, if the price does not pass the resistance levels, the continuation of the correction trend will be likely.

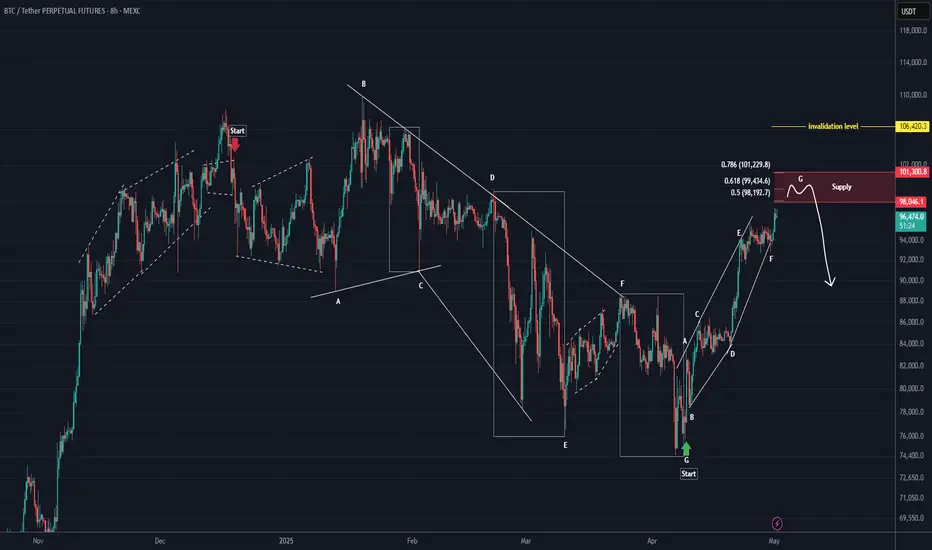
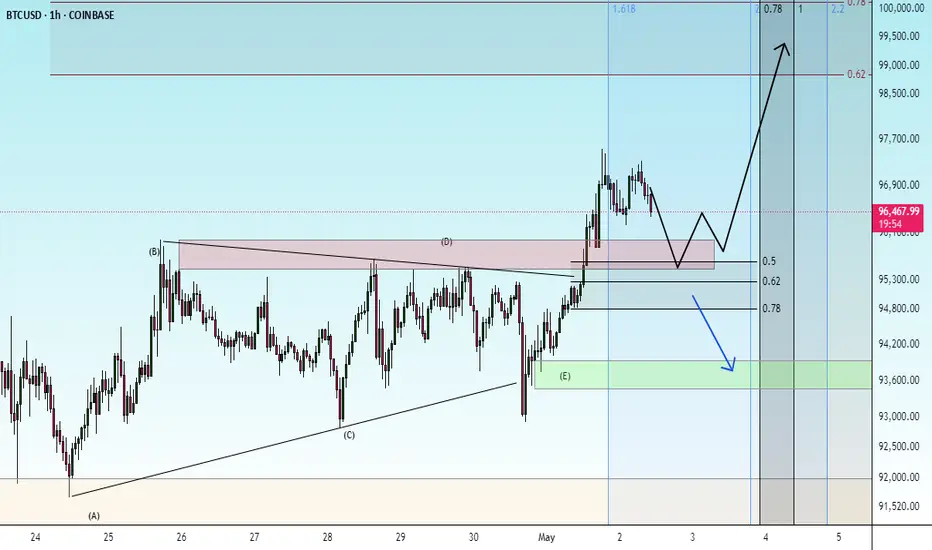
BTC New Update (8H)This analysis is an update of the analysis you see in the "Related publications" section
In the previous scenario, we considered that Bitcoin was in a diametric where wave E had extended. However, after reviewing the charts and analyzing various scenarios, we decided to revise the wave count as shown in this update, since wave E of the previous diametric scenario became overly extended.
You can see the complete wave count of the chart in this update. The correction in Bitcoin started from the point where we placed the red arrow on the chart. This correction was a diametric and ended where the green arrow is placed.
From the point where the green arrow is shown on the chart, Bitcoin's bullish wave has started, which is either wave A or W.
According to this scenario, the expected rejection zone should be between 98K and 103K.
The lowest-risk area for price rejection is the red box.
A daily candle close above the invalidation level will invalidate this analysis.
Let’s see what happens.
For risk management, please don't forget stop loss and capital management
Comment if you have any questions
Thank You
PENGUUSDTA risky analysis of a popular meme coin..
Based on this analysis, we are in wave 4 and it is expected to end soon and enter wave 5..
Around 0.091 to 0.085, if the price reaches it, it will be suitable for a short swing to the target of 0.0163 and 0.0175..
Ideal time zones are also marked with low tolerance..
This analysis can be easily filled..

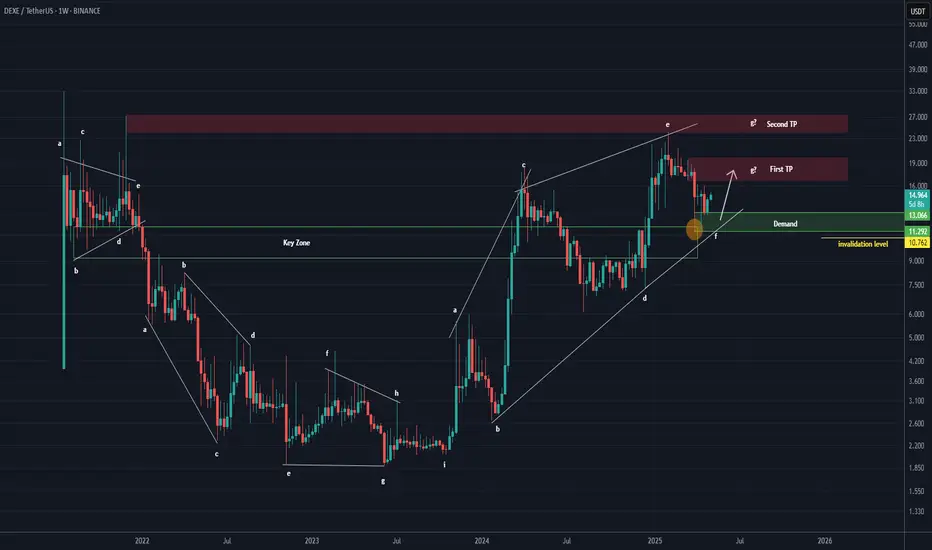
DEXE Analysis (1W)It appears to be in a bullish diametric pattern, and we are likely approaching the end of wave F.
If the price returns to the green zone, we will be looking for buy/long positions there.
We’ve marked two main targets on the chart, which represent the potential objectives for wave G.
A weekly candle closing below the invalidation level will invalidate this view.
For risk management, please don't forget stop loss and capital management
When we reach the first target, save some profit and then change the stop to entry
Comment if you have any questions
Thank You
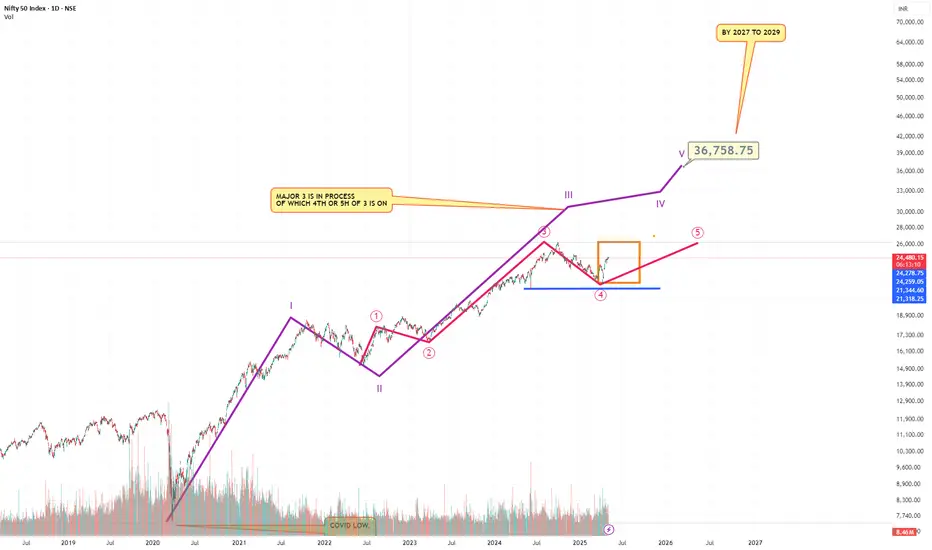
NIFTY Future Marked on chart...And its good News.I did the count of Neo waves on the Nifty...I have marked the larger cycle and the tgt by 2029 is around 37000...If all 5 waves are completed..right now we are in the 5th wave of the 3rd wave ..Please refer to chart....Also the Indian demographics support this..So please enter your favorate frontline blue chip stocks and sit tight...Please feel free to challenge this chart..I would be happy
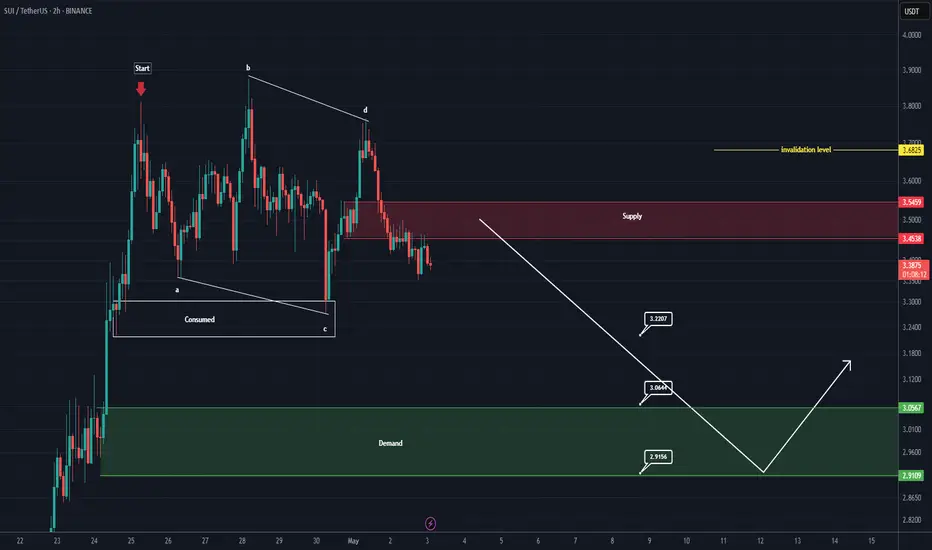
SUI Looks Bearish (2H)From the point where we placed the red arrow on the chart, it appears that the correction in SUI has begun.
An expansionary wave structure is visible, which could potentially push SUI toward the green zone.
Targets are marked on the chart. As long as the supply zone holds, the price may move toward the targets and the green box.
A 4-hour candle closing above the invalidation level will invalidate this analysis.
For risk management, please don't forget stop loss and capital management
When we reach the first target, save some profit and then change the stop to entry
Comment if you have any questions
Thank You
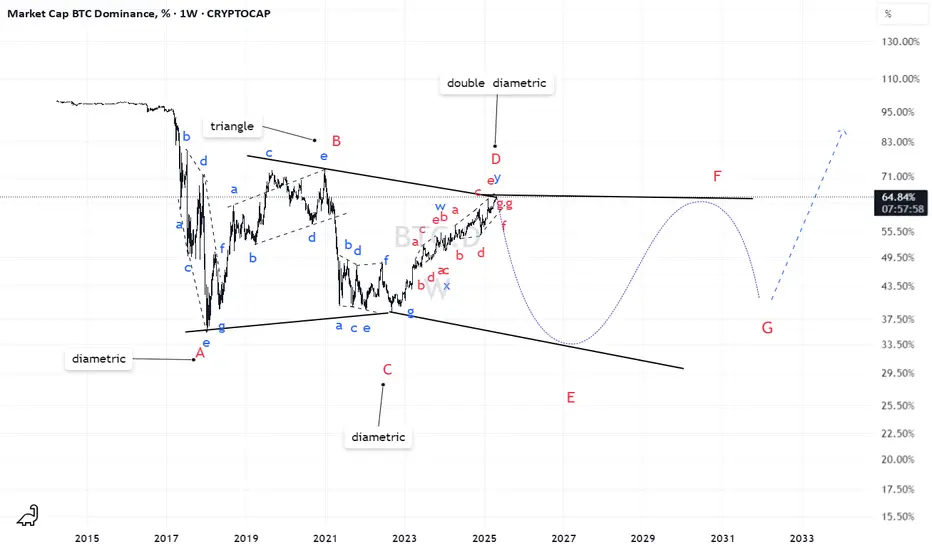
BTC.D(based on NEo wave)I changed my idea about midterm but not about longterm!
Altseason will make a heavy downtrend for this in a few months later which I call it wave E
BABY Looks Bullish (4H)Note: Given the corrective nature of the market, only consider entering this symbol within the green zone. Move to break-even at the first target.
According to the Baby structure, this symbol appears to be aiming to remain bullish.
From the point where we placed the (A) on the chart, expansion waves have started on this symbol.
As long as the green zone is maintained, the price can move toward the targets.
A daily candle closing below the invalidation level will invalidate this analysis.
For risk management, please don't forget stop loss and capital management
Comment if you have any questions
Thank You

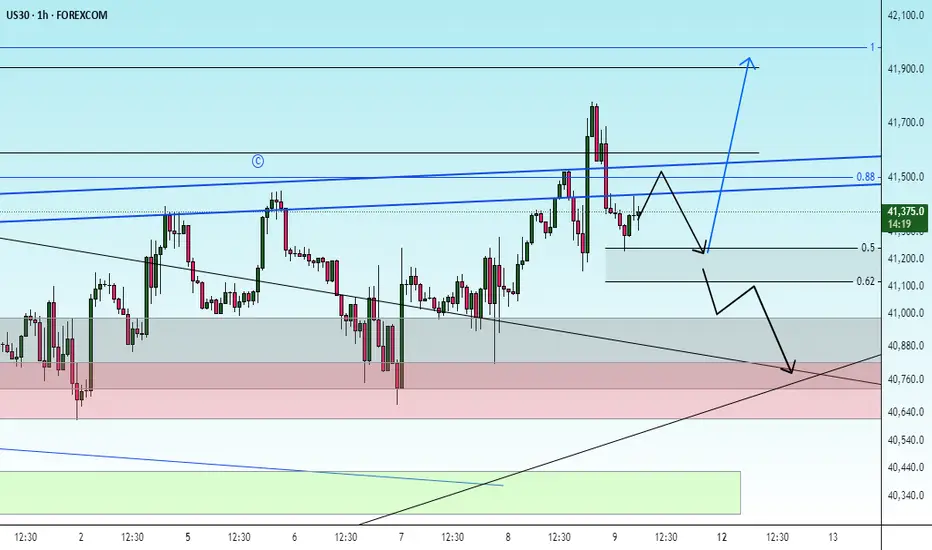
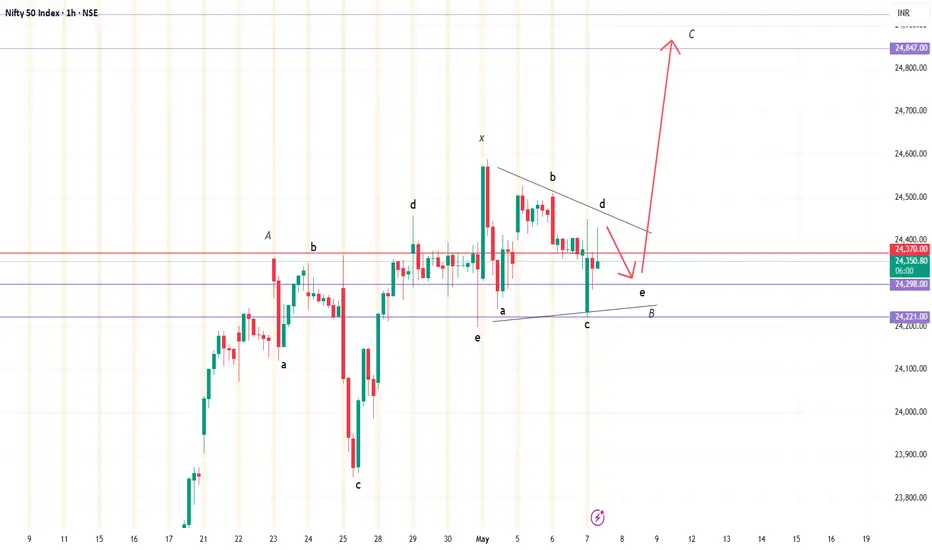
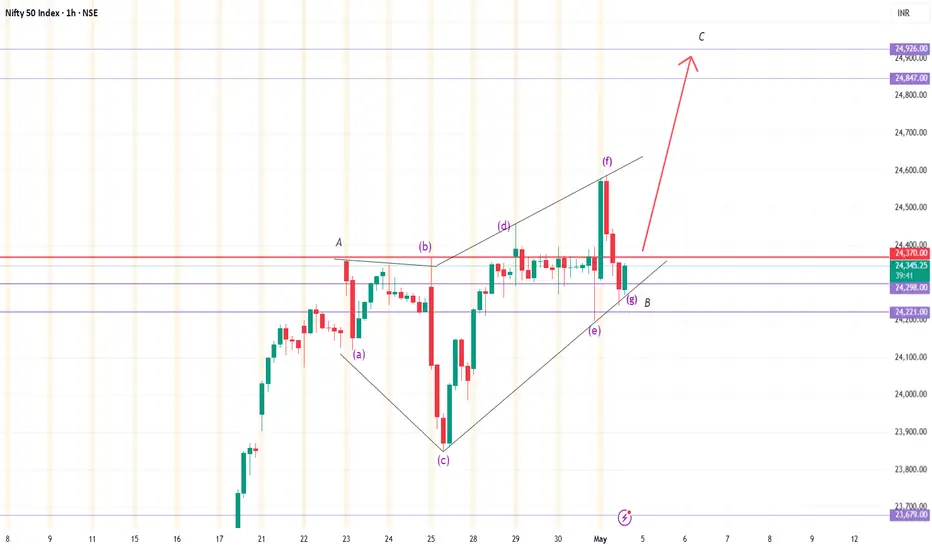
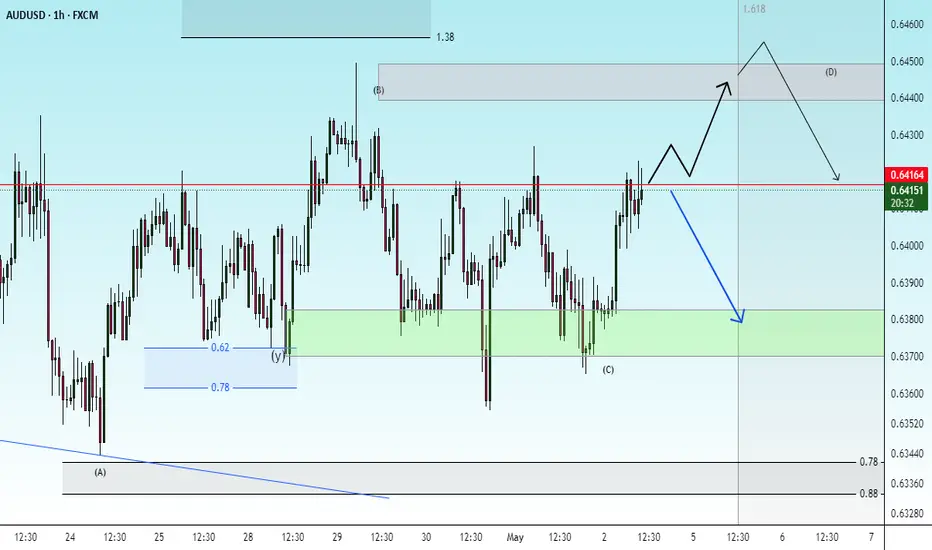
Diametric pattern in B-wave ?Diametric pattern in B-wave ?
faster retracement upside (C-wave) will confirm.
possibity of uptrendAs long as the index fluctuates above the support area, the upward trend will likely continue. Otherwise, the correction will continue to the specified support levels.
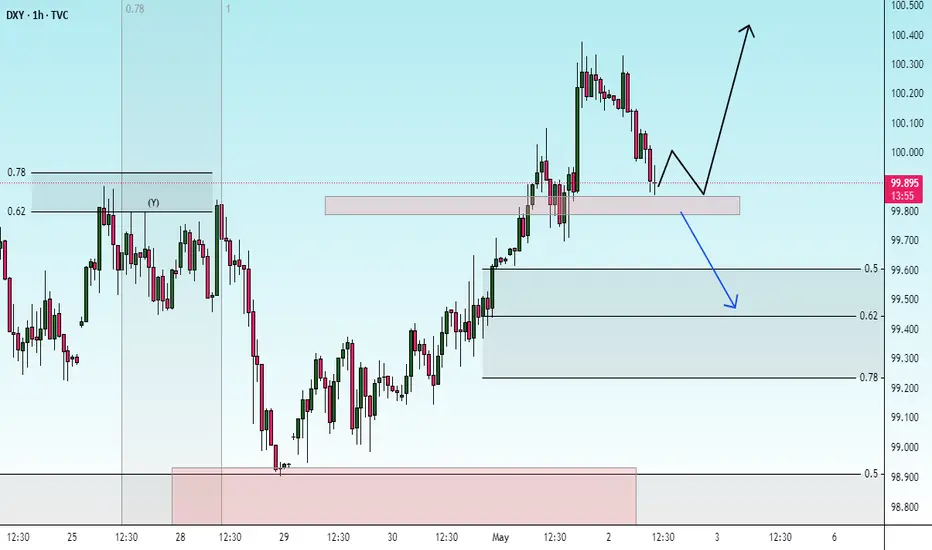
change the trendIt is expected that the upward trend will end in the current resistance area and we will see the beginning of an downward trend. Otherwise, the upward trend will continue to the 78.6% level and then a trend change will be expected.
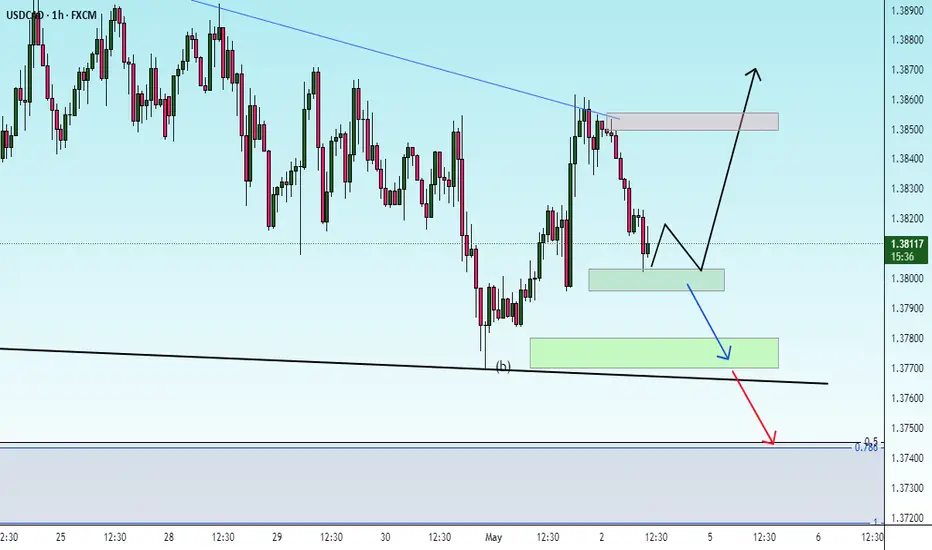
possibity of downtrendIt is expected that a trend change will form in the current support area and we will see the beginning of an upward trend. Otherwise, the correction will continue.
If the price crosses the support area and the support trend line, a long-term downtrend will be established.
check the trendA correction to the support zone is expected. Then there is a possibility of a trend change, and an upward and fluctuating trend is likely.
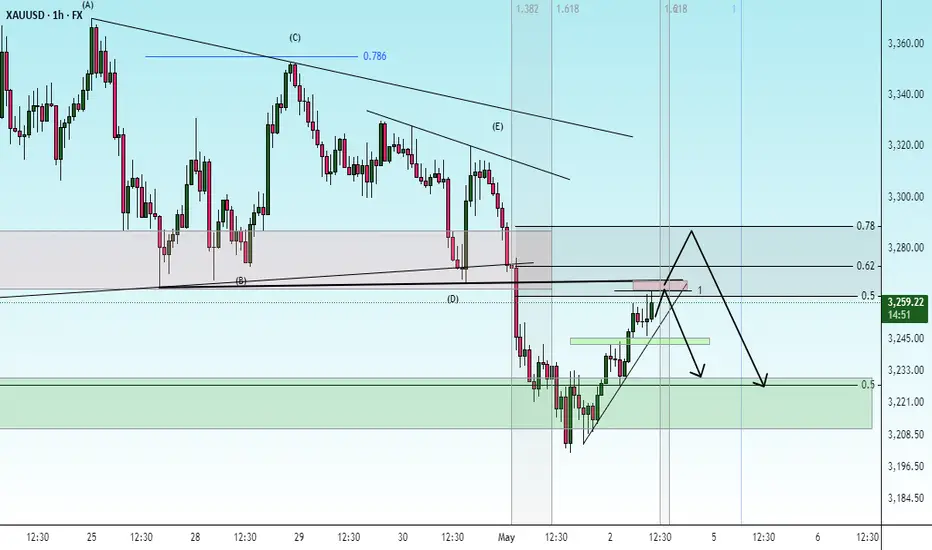
correctionA correction to the specified support zones is expected, then there is a possibility of continuing the upward trend. A break of the red support zone will cause a continuation of the downtrend.
check the trendConsidering the price behavior in the current resistance zone, possible scenarios have been identified.
As long as it fluctuates below the red resistance zone, a continuation of the downtrend is likely.
upterndThe price is expected to break through the resistance range and advance to the next resistance range.
If the price breaks through the green support zone, a downtrend is likely.
possibity of uptrendIt is expected that a corrective and fluctuating trend will form in the current resistance range. Then the upward trend will likely continue.
correctionIt is expected that after some fluctuation and correction, a trend change will form in the specified support range and we will see the start of the upward trend.
possibity of uptrendThe price is expected to stabilize above the resistance level, then continue the upward trend. Then there is a possibility of breaking the resistance range.
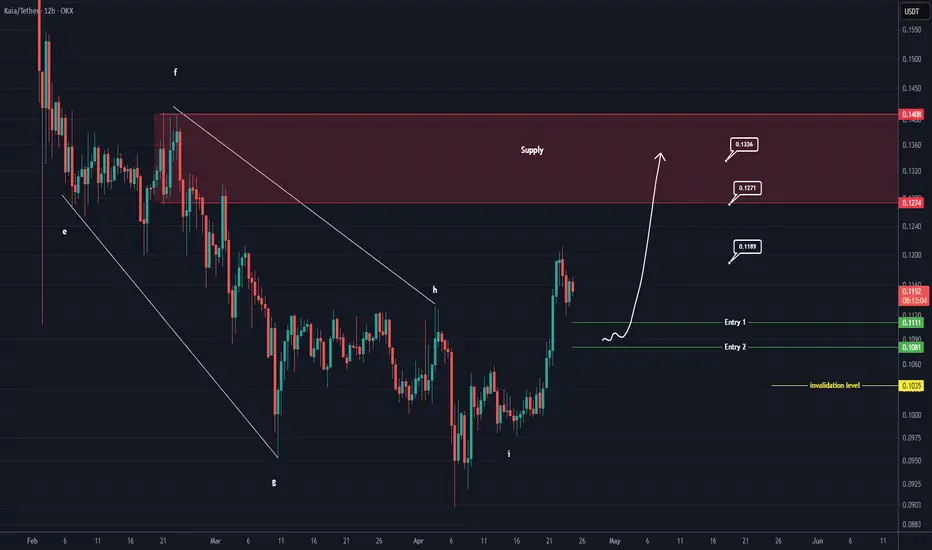
KAIA Buy/Long Setup (12H)It seems that a large symmetrical pattern has completed, and the price has broken out above the resistance line. We are looking for Buy/Long positions on pullbacks.
We have identified two entry points for this asset. If the price reaches these entry zones, we will enter a position.
The targets are also marked on the chart.
A daily candle closing below the invalidation level will invalidate this analysis.
For risk management, please don't forget stop loss and capital management
When we reach the first target, save some profit and then change the stop to entry
Comment if you have any questions
Thank You