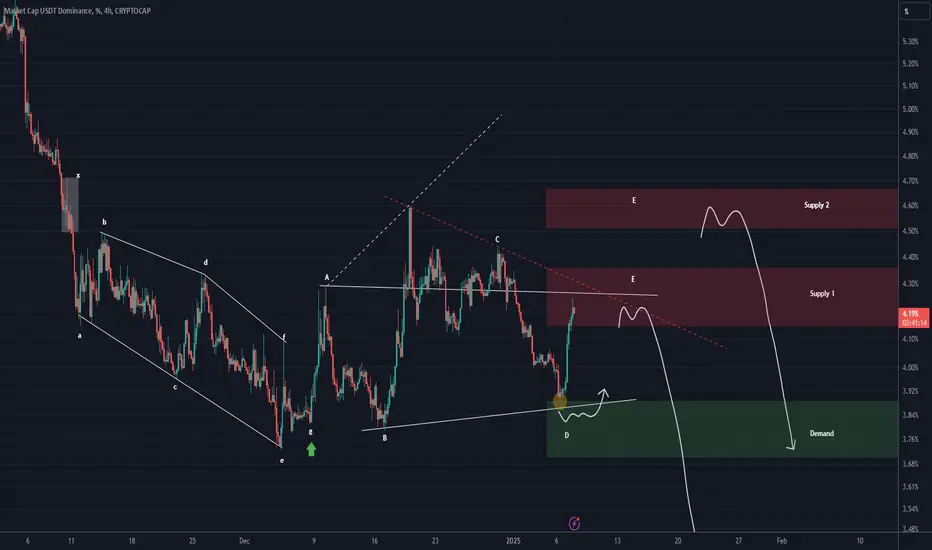
USDT DOMINANCE new update (4H)This analysis is an update of the analysis you see in the "Related publications" section
First of all you should know that "USDT Dominance" is always moving inverse of BTCUSDT .
We have reached the red-marked area from the previous analysis, but the bullish momentum of the candles is strong.
In previous analyses, we considered the triangle as a contracting triangle, but it is possible that Tether dominance is forming an expanding triangle or even a diametric pattern.
We have two zones for the completion of wave e.
If the price breaks through supply zone 1, it will be rejected from supply zone 2.
For risk management, please don't forget stop loss and capital management
Comment if you have any questions
Thank You
Neo Wave
change the trendIt is expected that the upward trend will end within the current resistance range and we will see the beginning of the correction.

possibility of uptrendAs long as the price is above the support range, the upward trend will likely continue.
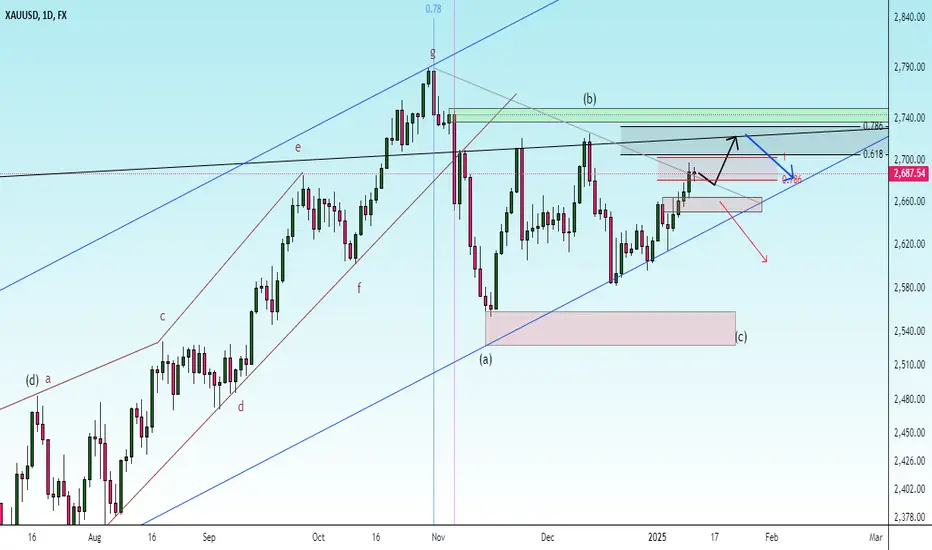
uptrendIt is expected that after some fluctuation and correction, the upward trend will continue. The powerful price needs to break through the resistance range.

correctionConsidering the price behavior within the current support range, possible scenarios have been identified.
The downtrend is expected to continue for the specified time frame
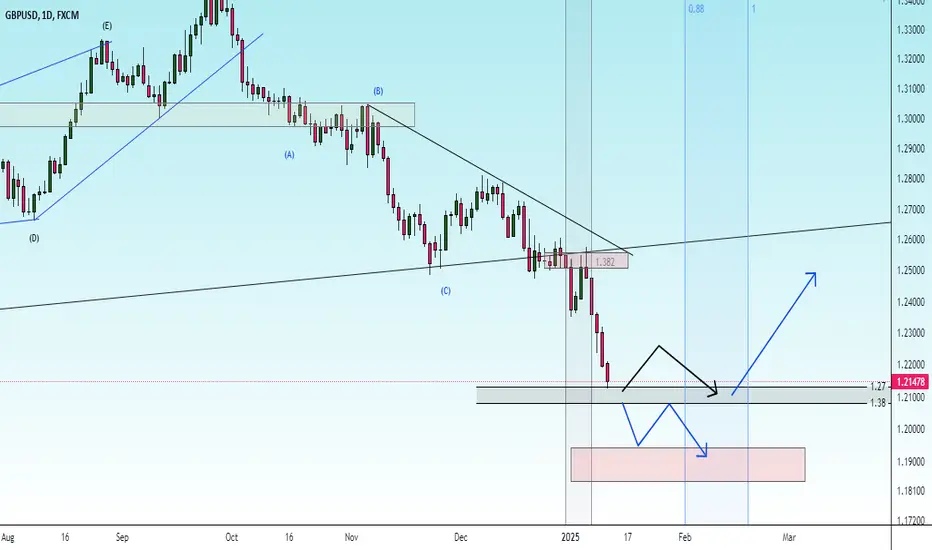
downtrendThe price is expected to break through the support trend line. Then, given the price behavior in the specified support zone, it is expected that the downtrend will continue according to the specified paths.

change the trendThe downtrend is expected to continue to the specified support levels, then there is a possibility of a trend change and a rise.

possibility of correctionThe uptrend is expected to continue to the resistance zone, then there is a possibility of a trend change and a correction.

check the trendIt is expected that after a pullback to the resistance level and trend line, a trend change will occur and we will witness the start of a downtrend. A break of the support zone will confirm the downtrend
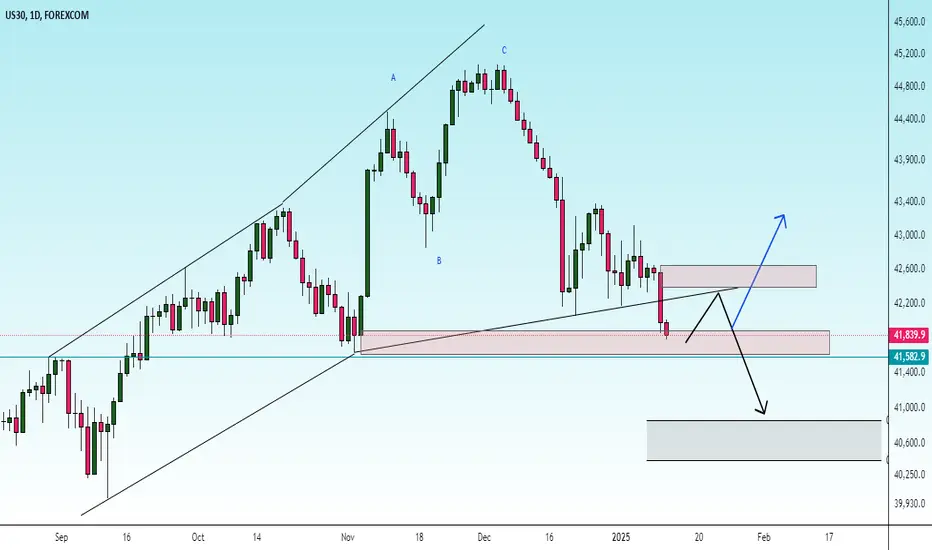
correctionThe downtrend is expected to continue along the specified path. Then, considering the price behavior in the support level, possible scenarios have been identified
possibility of uptrendThe downtrend is expected to end at the specified support level. Then, an uptrend is likely to begin.
If the price crosses the 100% level, a continuation of the downtrend will occur

ONE ANALYSIS (3D)Before anything else, pay attention to the analysis timeframe. It is a 3-day timeframe and requires patience.
It appears that from the point marked with the green arrow on the chart, ONE has entered a Diametric pattern.
Currently, it seems to be in wave F of this Diametric. Wave F is bearish.
Within the green zone, buy positions can be considered.
A daily candle closing below the invalidation level will invalidate this analysis.
For risk management, please don't forget stop loss and capital management
Comment if you have any questions
Thank You

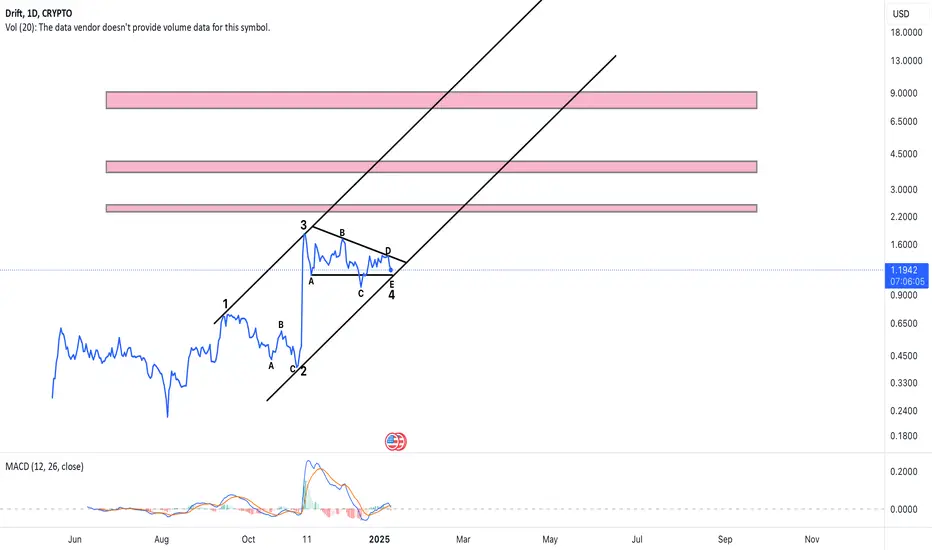
DRIFT new Update (12H)Note: This symbol experiences sharp and volatile price movements. Manage your risk carefully.
Now, it seems that DRIFT intends to move toward the swap zone.
The best area for sell positions is within the supply zone.
Let’s wait and see what happens next.
For risk management, please don't forget stop loss and capital management
Comment if you have any questions
Thank You

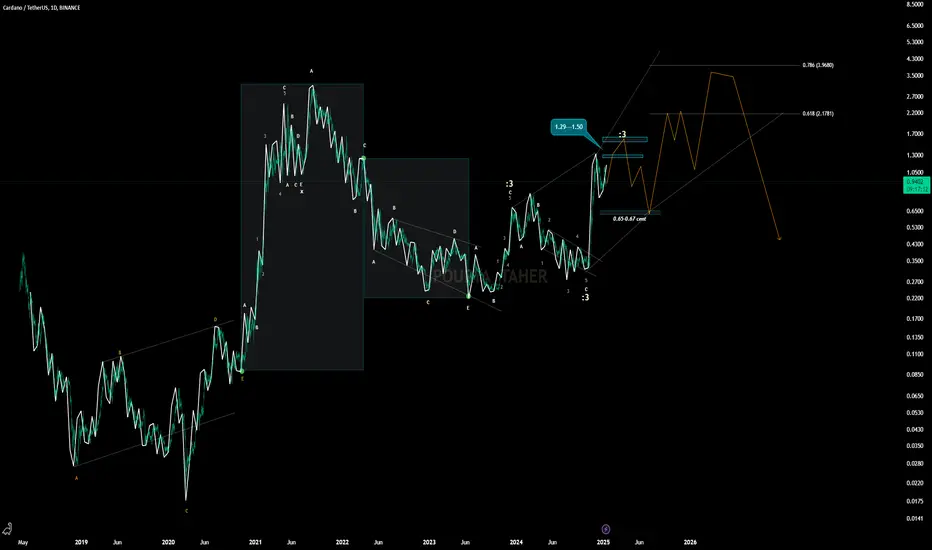
ADAUSDT"In this analysis, I aimed to examine the entire structure of Cardano from the beginning. I identified that we are currently within a corrective structure, and the current position appears to be the third wave of this correction. I anticipate that it may unfold as a Diametric pattern. Follow me to stay updated as we track this structure!"
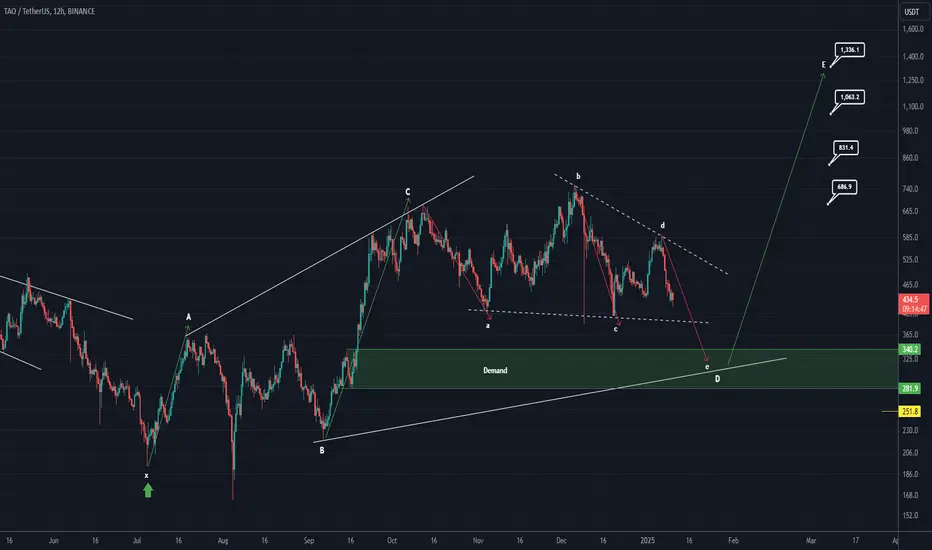
TAO roadmap (12H)It seems that TAO is forming an expanding triangle, currently in wave D of this triangle.
Wave D appears to have itself formed an expanding triangle (inverse expanding triangle).
It is expected that wave e of D will complete within the green zone.
From the green zone, it can move towards its targets.
A daily candle closing below the invalidation level would invalidate this analysis.
For risk management, please don't forget stop loss and capital management
Comment if you have any questions
Thank You
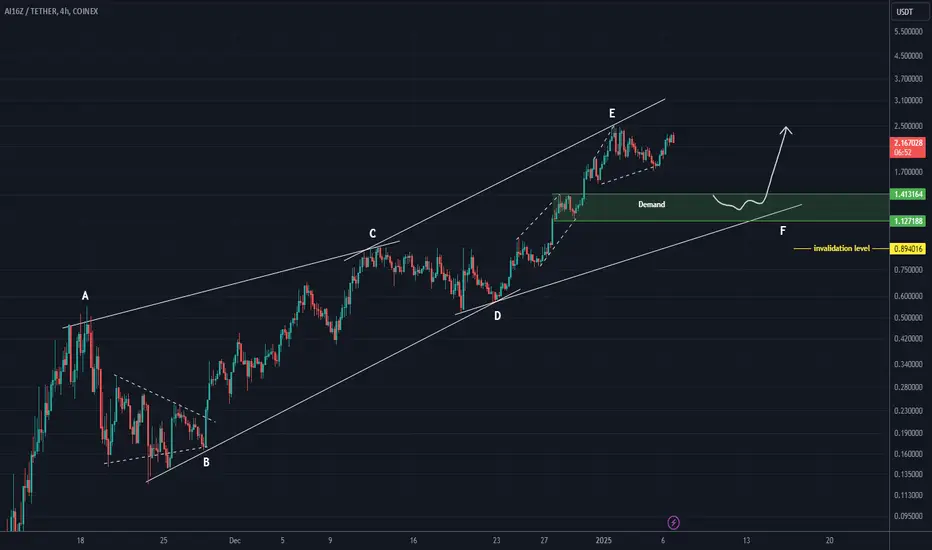
AI16Z ANALYSIS (4H)The AI16Z symbol appears to be within a large diametric pattern, currently at the end of wave E.
For a rebuy, it's crucial to execute this on a support zone, especially for assets that have experienced significant pumps.
Based on the structure, if the price reaches the entry zone, we can look for buy/long positions around the green area.
The target could be the top of wave E, but if you achieve reasonable profit, consider securing your gains.
A daily candle close below the invalidation level will invalidate this analysis.
For risk management, please don't forget stop loss and capital management
Comment if you have any questions
Thank You
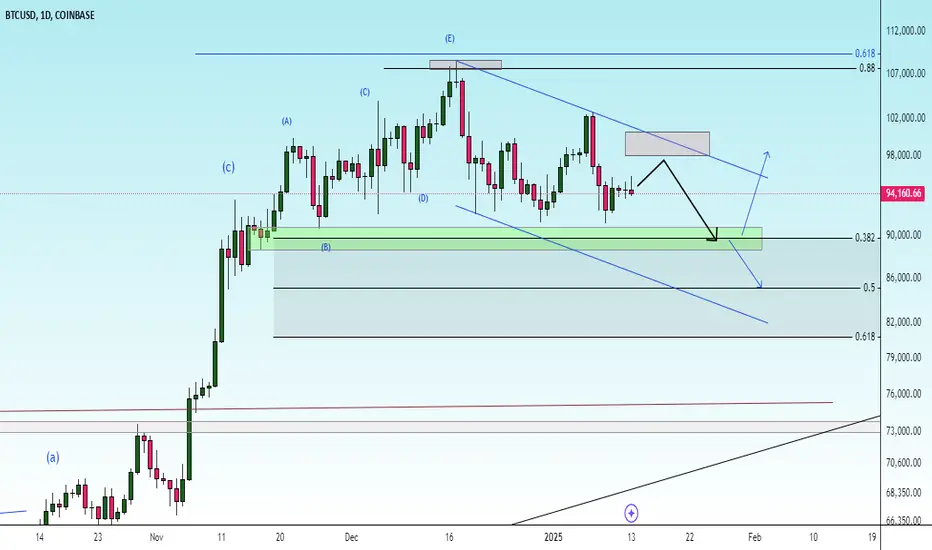
BTC New Update (4H)This analysis is an update of the analysis you see in the "Related publications" section
Please note that we are in complex corrections, and trading in these areas requires thorough analysis. We aim to update our analyses step by step. In such conditions, it’s better to analyze the data rather than make predictions.
According to the previous analysis, we expect the price to reach the green zone.
The demand and supply zones in this analysis have been updated.
On the green zone, the price could potentially bounce upwards.
A daily candle closing below the invalidation level will negate this analysis.
For risk management, please don't forget stop loss and capital management
Comment if you have any questions
Thank You
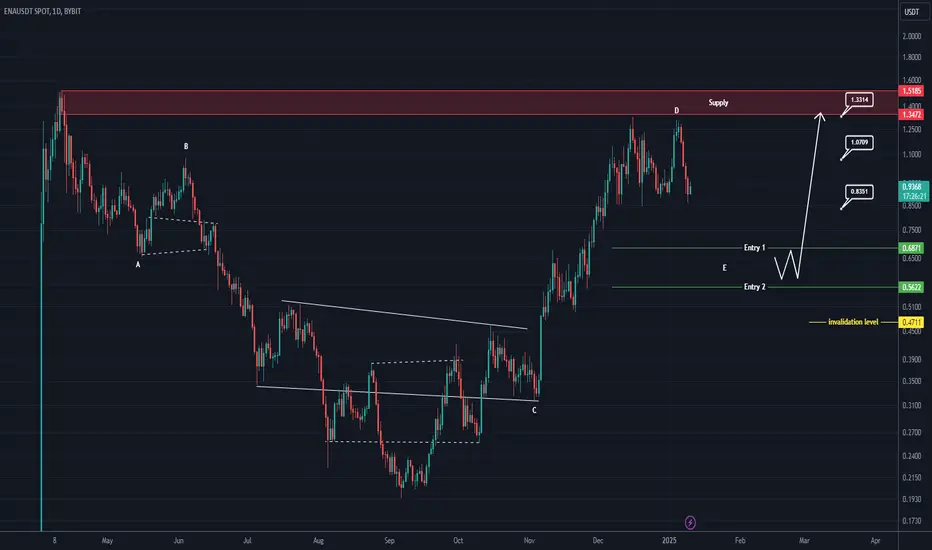
ENA rebuy setup (1D)This is one of the symbols that Trump had invested in. It now appears that a supercycle has completed, and the price has entered a new wave phase (wave E).
The low-risk area for rebuying in spot trading includes the two entries we have highlighted on the chart.
Minimum targets are indicated on the chart. If ENA can stabilize above the supply zone, it may become very bullish again.
The closure of a daily candle below the invalidation level will invalidate this analysis.
For risk management, please don't forget stop loss and capital management
Comment if you have any questions
Thank You
possible upcoming 5th wave and possible targetsI noticed the waves and wanted to share my thoughts. Any comment welcomes
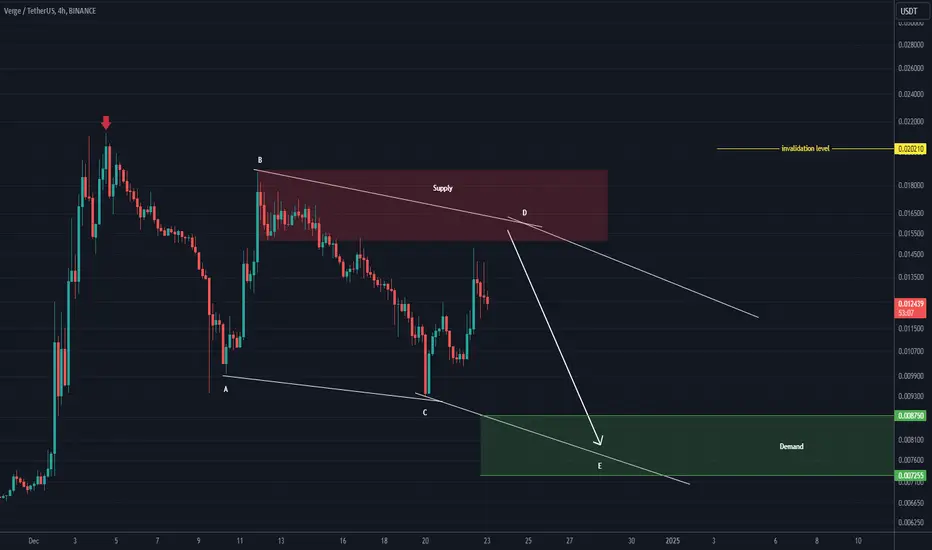
XVG Looks bearish (4H)From where we entered "Start" on the chart, XVG correction seems to have started. This correction seems to be a diametric. By maintaining the red area, it can move towards the green box.
The low risk range for sell/short positions is the red box.
Closing a daily candle above the invalidation level will violate this analysis.
For risk management, please don't forget stop loss and capital management
Comment if you have any questions
Thank You
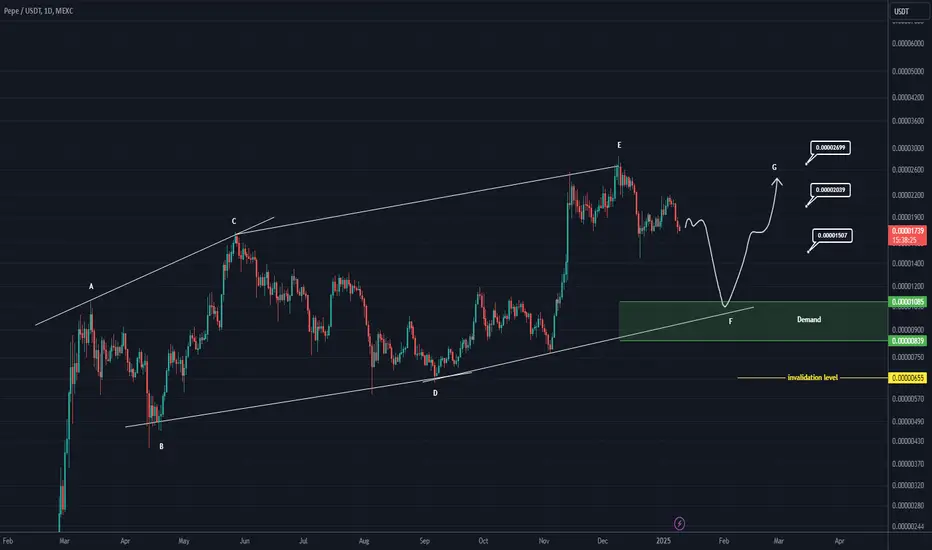
PEPE looks bearish (1D)PEPE seems to be completing a diametric pattern and is now entering wave F.
Wave F is bearish. The drop in wave F is expected to continue until it reaches the green zone.
Targets are marked on the chart.
A daily candle closing below the invalidation level will negate our buy outlook.
For risk management, please don't forget stop loss and capital management
Comment if you have any questions
Thank You
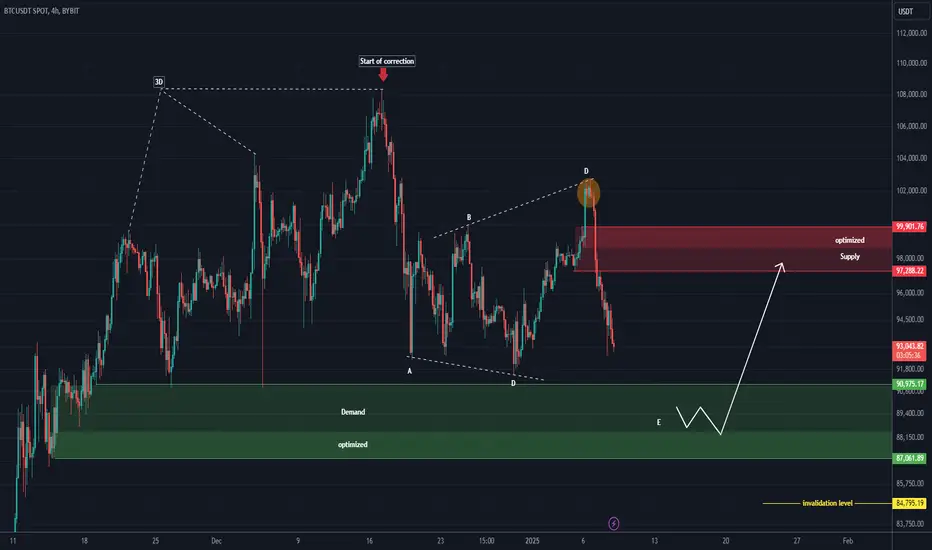
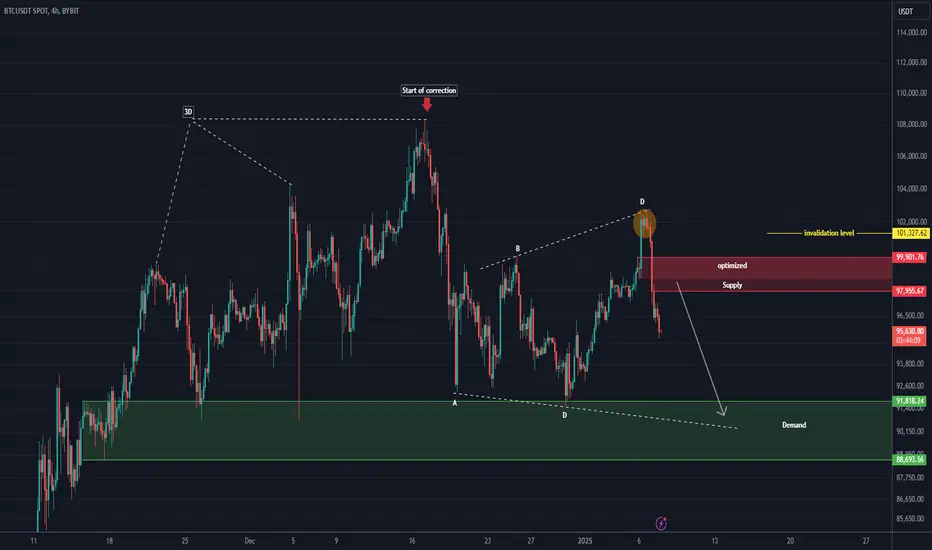
BTC NEW UPDATE (4H)This analysis is an update of the analysis you see in the "Related publications" section
The price dropped from the red-marked area in the previous analysis, and this supply zone worked well.
The correction for BTC started from the point where we placed the red arrow on the chart.
We expect a downward move toward the green-marked area.
If the price reaches the supply zone, we can look for sell/short positions as scalp trades.
Closing a daily candle above the invalidation level will invalidate our bearish outlook.
For risk management, please don't forget stop loss and capital management
Comment if you have any questions
Thank You
check the trendIt is expected that the upward trend will continue to form until the specified resistance levels. Then there is a possibility of a trend change
