Downtrend It is expected that after some fluctuation in the current resistance range, a trend change will take place and we will see the beginning of a downtrend. A break of the green support range will be a confirmation of the downtrend. With a break and consolidation above the resistance range, the alternative scenario will be a continuation of the uptrend.
Neo Wave
Check the trend It is expected that after some fluctuation and correction, we will see the continuation of the uptrend. Otherwise, the correction will advance to the specified time frame, then an uptrend will be possible.

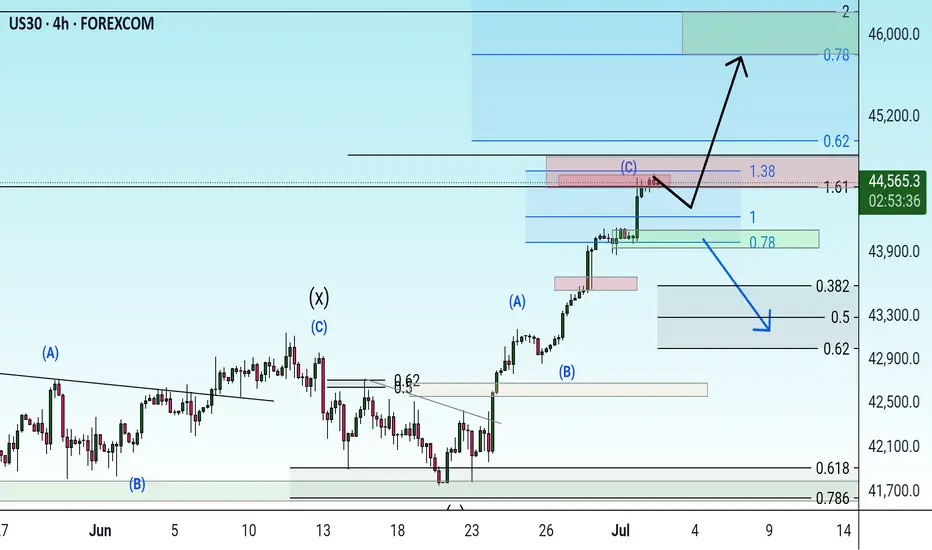
Possibility of uptrend It is expected that after some fluctuation and correction, the resistance area will be broken and the upward trend will continue. If the index crosses the green support area, a downward trend to the specified support levels will be possible.
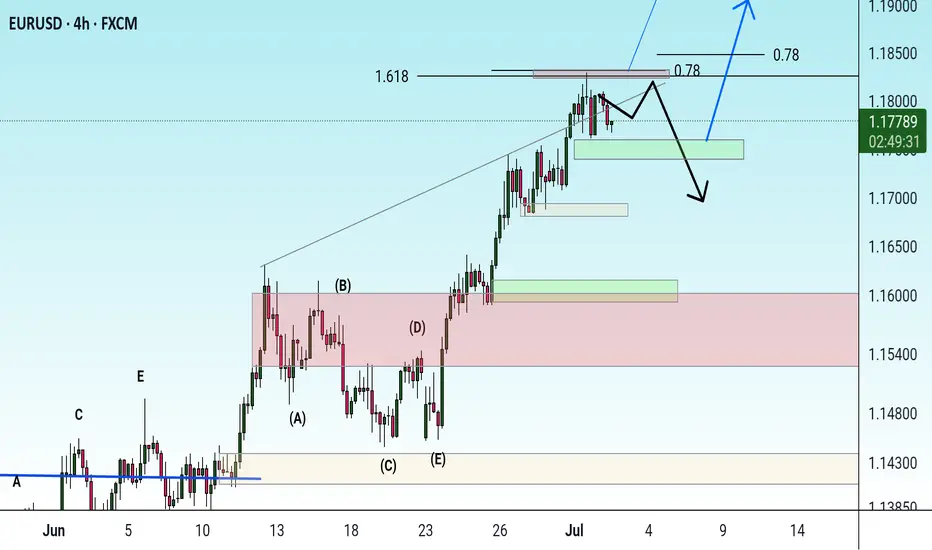
Possibility of uptrend A trend change is expected to form at the green resistance area and we will see the beginning of a downtrend. If the price breaks through the resistance area, a continuation of the uptrend to the previous high is likely.
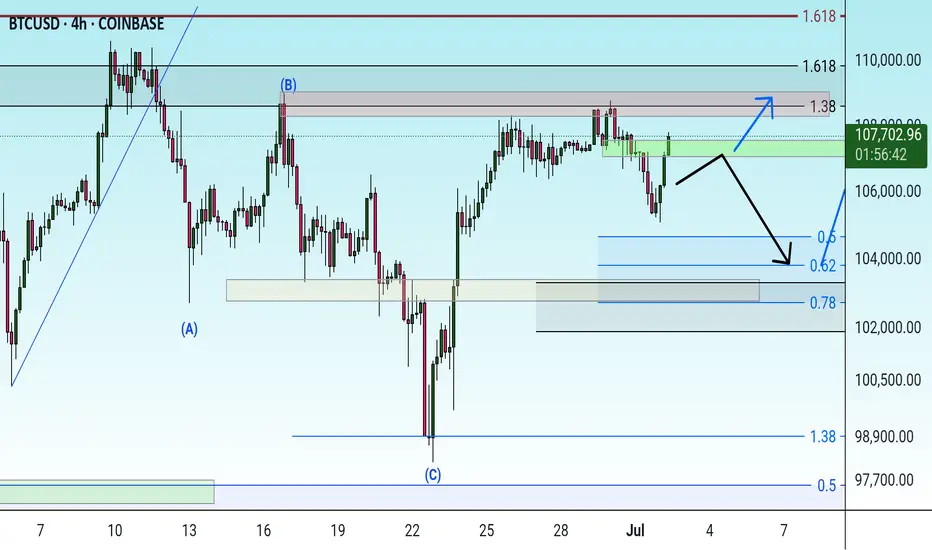
Check the trend After some fluctuation and correction, the upward trend is expected to continue to the resistance levels. If the price breaks through the green support area, the downward trend to the specified support levels is possible.

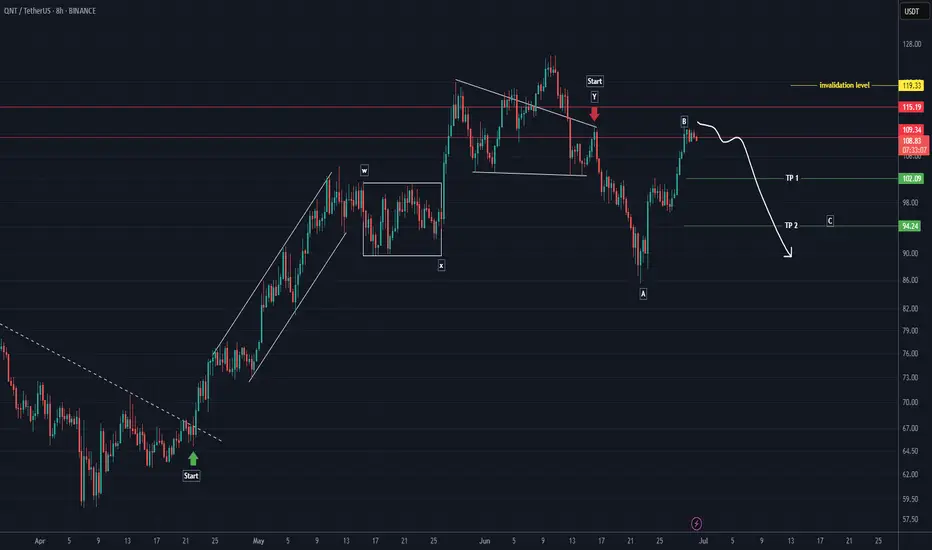
QNT Analysis (8H)From the point where we placed the red arrow on the chart, it seems that NEIRO’s correction has begun.
This correction appears to be a diagonal (diametric) pattern, and we are currently at the end of wave F.
Wave G could complete within the green zone, where we can look for a Rebuy setup.
The targets are marked on the chart.
If a daily candle closes below the invalidation level, this analysis will be invalidated.
For risk management, please don't forget stop loss and capital management
When we reach the first target, save some profit and then change the stop to entry
Comment if you have any questions
Thank You
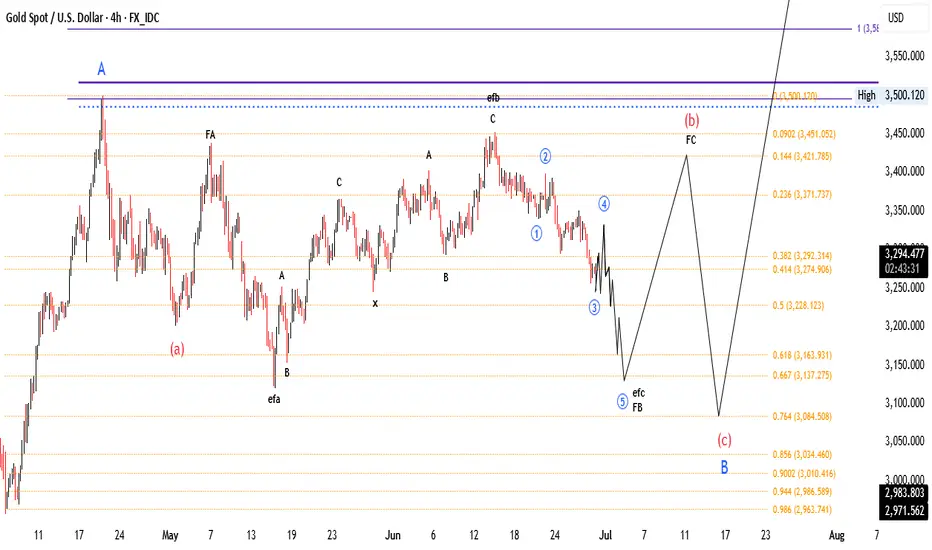
#xauusd-gold scenario
Hello dear friends
The wave counter for the best path ahead of the global gold trend in the 4-hour timeframe, based on the Harmonic Elliott , is predicted in the image.
good luck
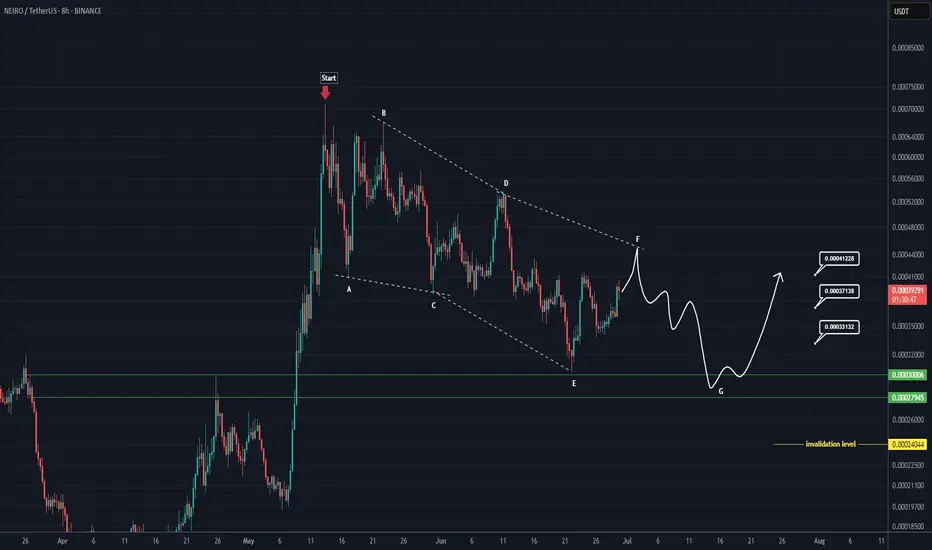
NEIRO ANALYSIS (8H)From the point where we placed the red arrow on the chart, it seems that NEIRO’s correction has begun.
This correction appears to be a diagonal (diametric) pattern, and we are currently at the end of wave F.
Wave G could complete within the green zone, where we can look for a Rebuy setup.
The targets are marked on the chart.
If a daily candle closes below the invalidation level, this analysis will be invalidated.
For risk management, please don't forget stop loss and capital management
When we reach the first target, save some profit and then change the stop to entry
Comment if you have any questions
Thank You
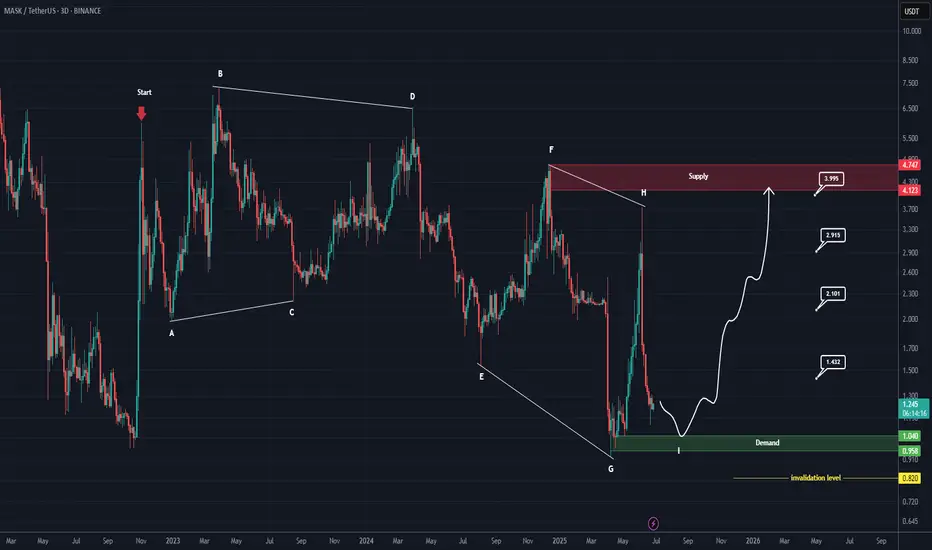
MASK Analysis (3D)The correction for MASK has started from the area marked as “Strat” on the chart.
This appears to be forming a symmetrical correction, and we seem to be approaching the end of wave I.
The green zone is considered the most favorable and low-risk area for the completion of wave I.
Targets are indicated on the chart.
A daily candle closing below the invalidation level will invalidate this analysis.
For risk management, please don't forget stop loss and capital management
Comment if you have any questions
Thank You
DOT ANALYSIS (3D)Polkadot appears to have reached a fresh and significant support zone, which is potentially where the corrective wave C may come to an end.
If wave C completes here, the price could begin a strong recovery. However, it’s important to note that this is a higher time frame setup, so reaching the targets may take some time.
As long as the green support zone holds, the price can move toward the mentioned targets. The targets are marked on the chart.
A daily candle closing below the invalidation level will invalidate this analysis.
For risk management, please don't forget stop loss and capital management
When we reach the first target, save some profit and then change the stop to entry
Comment if you have any questions
Thank You

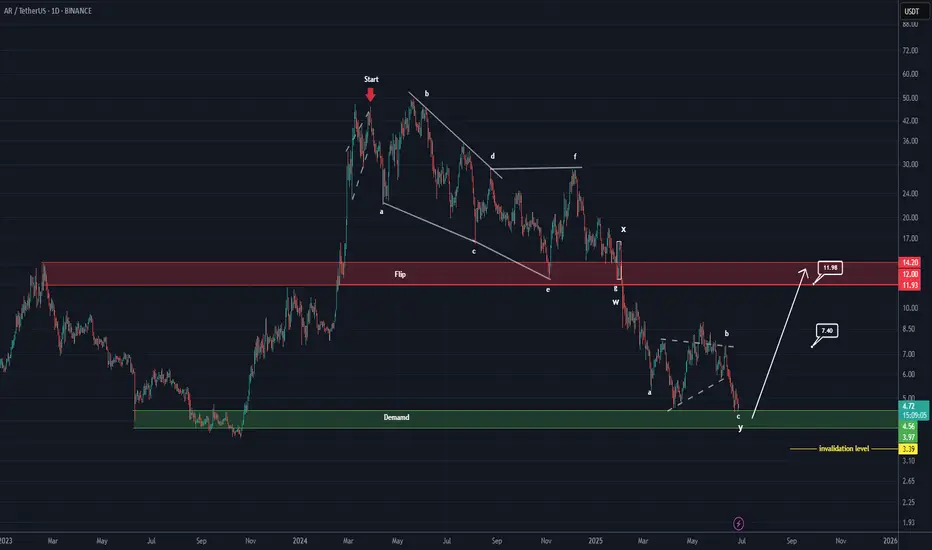
AR Looks Bullish (1D)The AR symbol appears to be completing a double corrective pattern | the first part being a plapyonic diametric and the second part a flat. The green zone represents a demand area that could potentially push the price upward. Note that this type of setup is generally safer for spot trading, while futures trading would require more precise entry levels.
Targets are marked on the chart.
A daily candle closing below the invalidation level will invalidate this analysis.
For risk management, please don't forget stop loss and capital management
Comment if you have any questions
Thank You
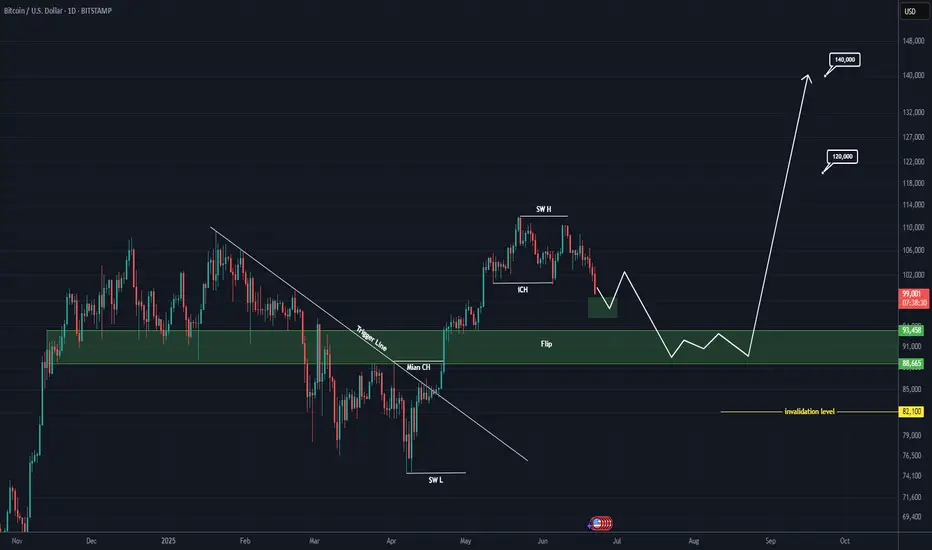
Bitcoin is gearing up for 120K and 140K (1D)The flip zone has been reclaimed, but no proper pullback had occurred. The recent pullback came with a sweep of the all-time high (ATH), which has caused confusion and uncertainty among market participants.
In fact, this drop can be interpreted as a pullback to the flip zone, accompanied by an ATH hunt.
We expect the price, after touching the green zone and forming a base around this level, to move toward the targets of 120K and 140K — which we currently consider as Bitcoin’s final targets for this cycle.
A weekly candle close below the invalidation level would invalidate this analysis.
For risk management, please don't forget stop loss and capital management
When we reach the first target, save some profit and then change the stop to entry
Comment if you have any questions
Thank You
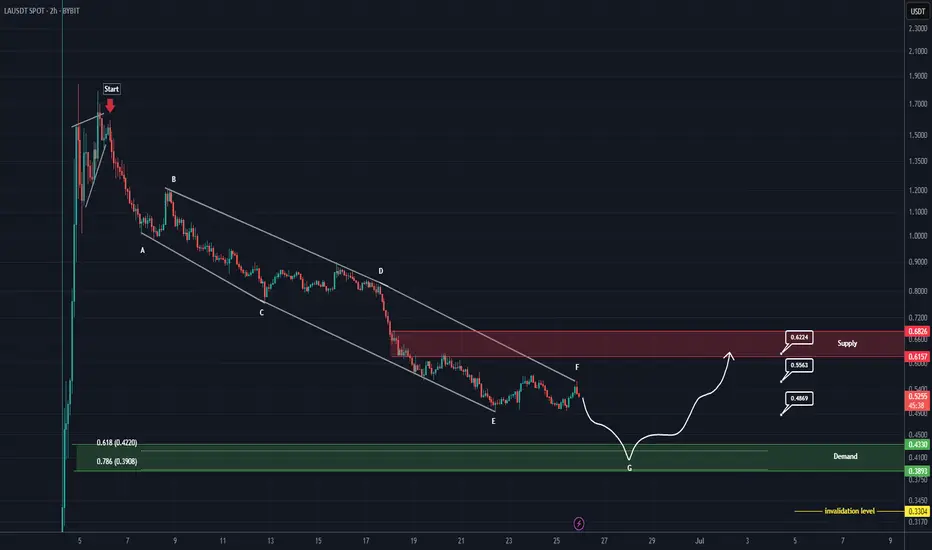
LA Analysis (2H)From the point where we placed the red arrow on the chart, it appears that LA has entered a correction phase.
There isn’t much data available for this coin, but the correction seems to be forming a diametric pattern.
We’ve highlighted the most optimal zone for the completion of the final wave of this diametric (wave G) with a green area on the chart.
Targets are marked on the chart.
A daily candle closing below the invalidation level will invalidate this analysis.
For risk management, please don't forget stop loss and capital management
Comment if you have any questions
Thank You
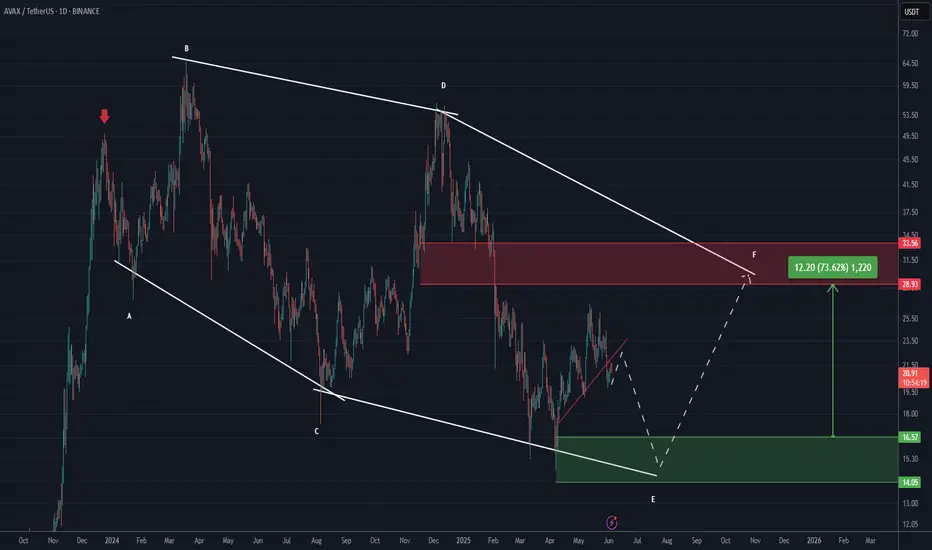
AVAX Analysis (1D)From the point where we placed the red arrow on the chart, it seems a correction has begun.
This correction appears to be a Diametric pattern, and wave E does not seem to be complete yet. It's expected that wave E will finish within the green zone.
The target could be the red box area.
A daily candle closing below the invalidation level would invalidate this analysis.
invalidation level: 10.90$
For risk management, please don't forget stop loss and capital management
When we reach the first target, save some profit and then change the stop to entry
Comment if you have any questions
Thank You
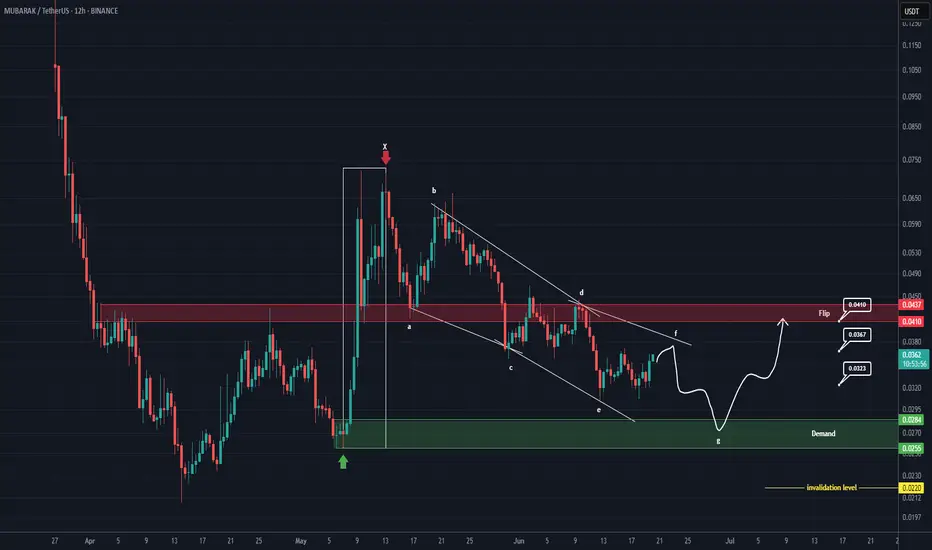
MUBARAK Analysis (12H)Note: This is a risky and highly volatile meme coin.
It appears that the bullish X wave has ended at the point where we placed the red arrow on the chart, and the price has now entered a corrective phase once again. This correction seems to be forming a diagonal pattern, and we are currently in wave F of this structure.
If the price reaches the green zone, we can look for potential buy/long positions.
Targets are marked on the chart, with the main target being the flip zone.
A daily candle closing below the invalidation level would invalidate this view.
For risk management, please don't forget stop loss and capital management
Comment if you have any questions
Thank You
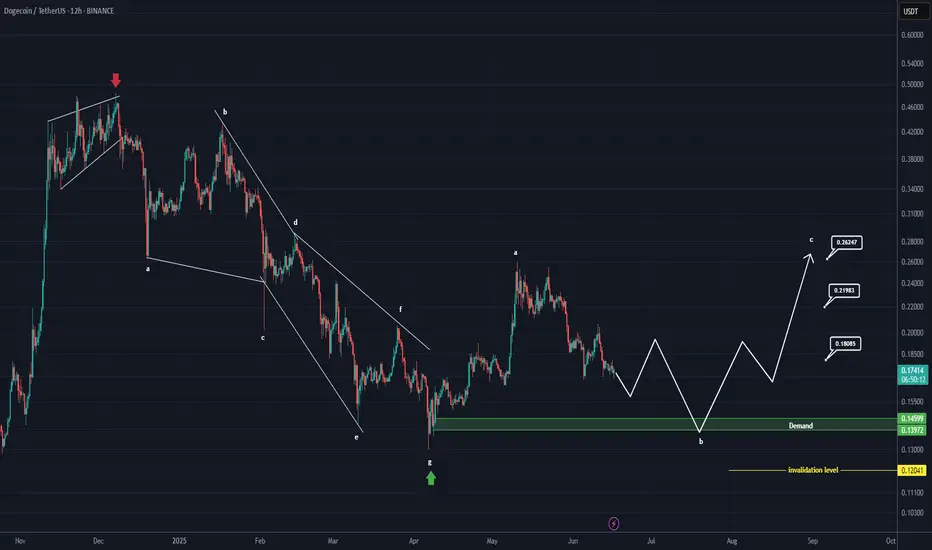
DOGE ANALYSIS (12H)Based on the current available data, it appears that Dogecoin has entered a bullish phase after completing the diametric pattern marked on the chart. We are currently in wave B of this bullish phase.
Wave B may complete within the green zone, which is a key support area.
The targets for wave C have been marked on the chart.
A daily candle closing below the invalidation level would negate this outlook.
For risk management, please don't forget stop loss and capital management
Comment if you have any questions
Thank You
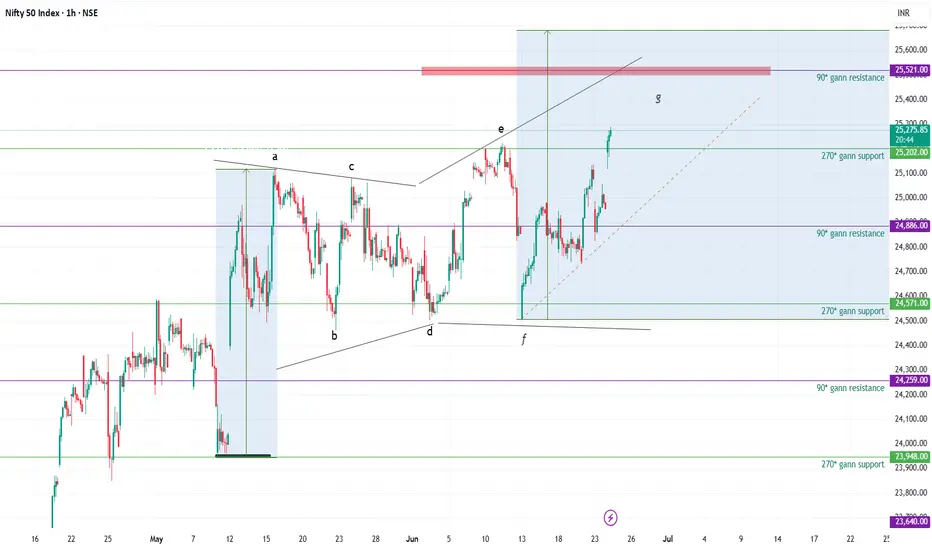
Diametric Pattern - Riding the current G-wave- Riding the G-wave - hoping it to tend to be nearly equal to A-wave
- 90* Gann acting as resistance
- 270* Gann as supports
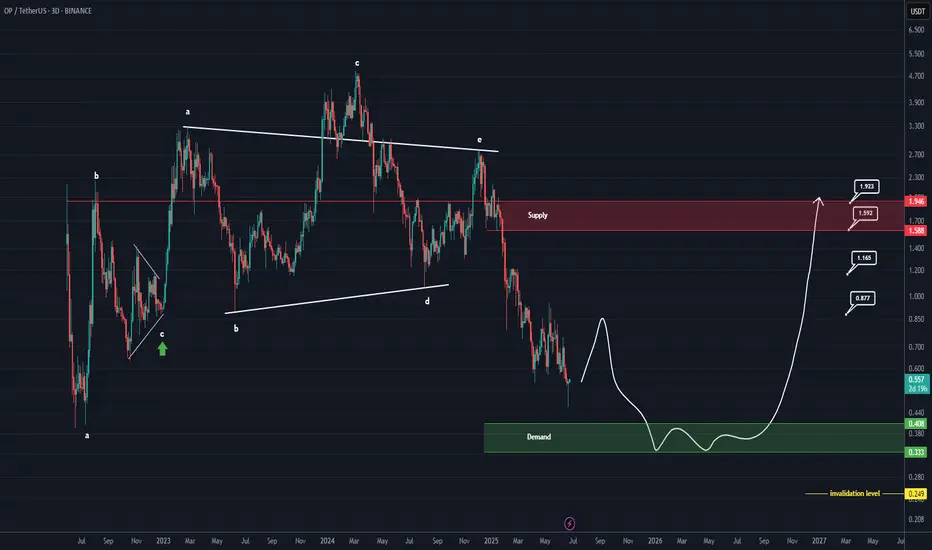
OP Roadmap (3D)The OP token has entered a bearish phase after completing a triangle pattern. We are currently in this bearish phase.
Such large bearish phases typically require a sweep of liquidity from key levels before ending. It appears that OP, after sweeping the liquidity below support levels, may reverse and enter a bullish phase.
The targets have been marked on the chart.
A daily candle close below the invalidation level will invalidate this analysis.
For risk management, please don't forget stop loss and capital management
Comment if you have any questions
Thank You
ETHEREUM Analysis (3D)First of all, pay close attention to the timeframe | it's a higher timeframe.
From the point where we placed the green arrow on the chart, Ethereum appears to have entered a bullish phase | specifically, a symmetrical pattern.
It currently seems to be in wave I of this symmetrical structure, which is the final wave. Wave I itself appears to be composed of three parts (ABC). At the moment, Ethereum seems to be in wave b of wave I.
We expect wave b of I to complete within the green zone, after which the price would move into wave c of I.
The price seems inclined to complete wave b of I near the bottom of the green zone.
Targets are marked on the chart.
In the green zone, it’s no longer reasonable to look for Sell/Short positions, especially when the price is approaching the bottom of the green area.
A weekly candle close below the green zone would invalidate this analysis.
For risk management, please don't forget stop loss and capital management
When we reach the first target, save some profit and then change the stop to entry
Comment if you have any questions
Thank You

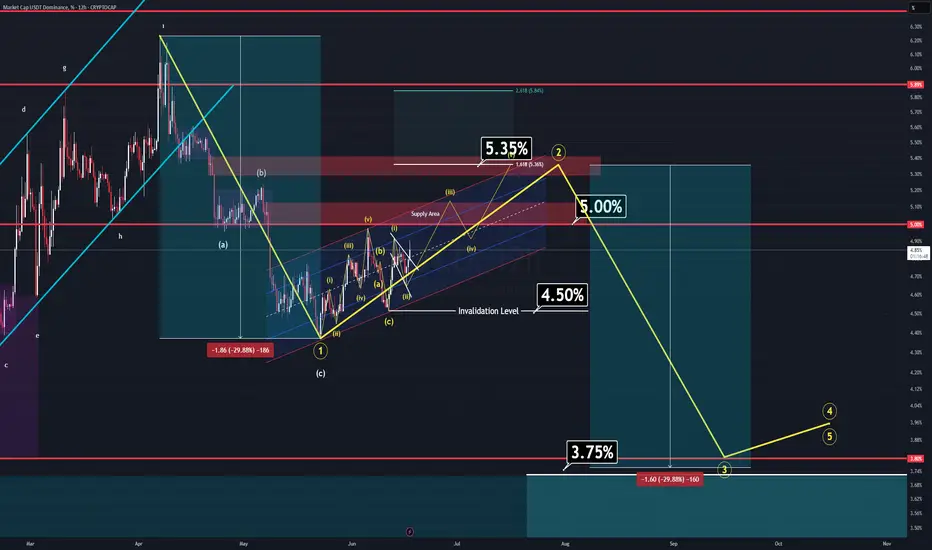
Do you wanna see the bigger picture? (USDT.D Analysis 12H)After counting many waves for many days, I have a senario for USDT dominance which will lead the entire market on its way.
For those whose not fimiliar with this parameter, there is a very simple explanation.
It's the reversed way to see the market. If this parameter drops, your alts will skyrocket and if it rises, you're gonna be crying on somebody's X post's comments.
First of all, the short term wiev is bearish. We are currently in an impulsive wave 3 which is expected to be hardest for altcoins at the moment. There will be crash unless the value of this parameter drops below %4.50 and invalidates the analysis (you'll like this senario better, trust me).
All right, we got rid of the scalpers who bothered to read this far and now I'm here to explain what I see for the golden future.
Currently, USDT.D is forming a BEARISH impulsive wave for higher time frames. As long as you stick with 4H candles, you won't be able to see it.
USDT.D is trying to forming its bearish flag, by doing so it will be its second wave and will prepare its very own collapse.
Last summer, BTC has done the same thing (Check for daily time BTC).
There is more.
If we calculate the depth of this incoming flag pattern, breaking this flag would lead USDT to %3.75 which is the yearly support (Check in weekly, you'll see it).
If we calculate the time needed to past for this flag to work, it's the same amount of time needed for previous flag to break from last summer.
We also need to add fundementals in it. Currently people started to talk about a senario which will lead world to WW3. I don't think that will happen. But the problem in here is it will market throguh downside.
Furthermore, there is FED.
FED is insisting to leave interest rates on its own without a change. I believe that we won't be seeing any rate cuts till the end of this summer.
I believe that the FED will cute rates between Agust and September. This will be the fuel for our rocket to fly and ignite the wave 3.
I know it's a long script but you know it's necessary.
Thanks for reading.
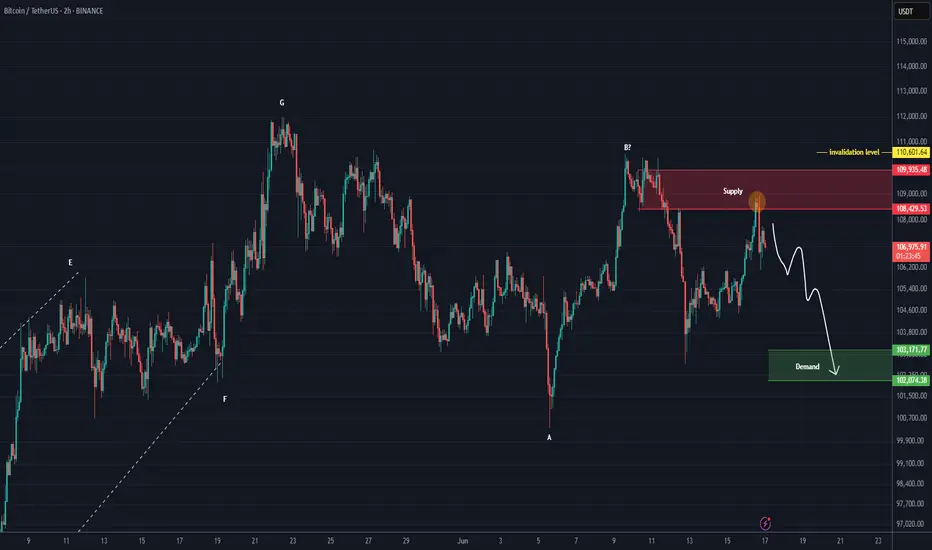
BTC is still bearish (2H)This analysis is an update of the analysis you see in the "Related publications" section
The red zone seems to have had enough orders to reject the price downward. It is expected that the price will drop at least to the green zone below.
There will be some fluctuations along the way.
A daily candle closing above the invalidation level would invalidate this analysis.
For risk management, please don't forget stop loss and capital management
Comment if you have any questions
Thank You
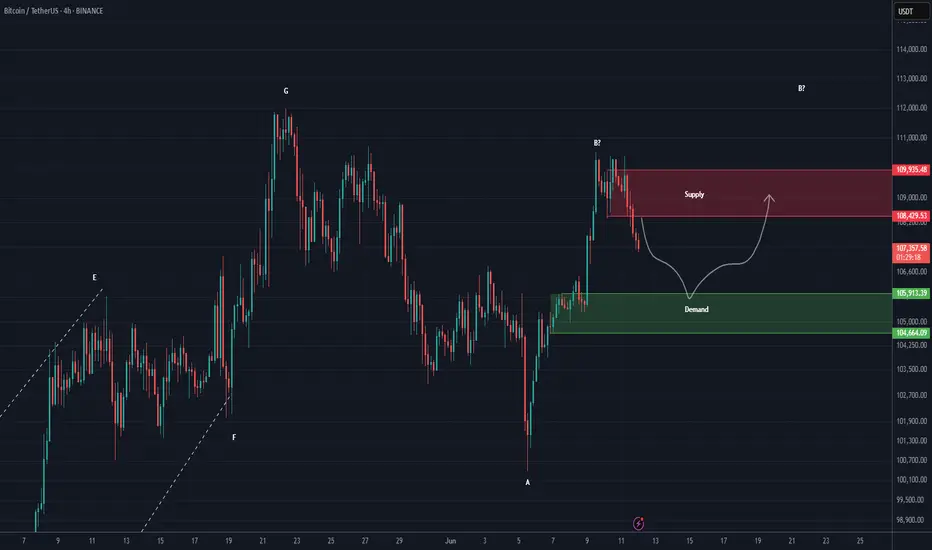
BTC ANALYSIS (4H)Last week, Bitcoin made a sharp bullish move upward, aiming for retail liquidity, which made the forecast path more difficult.
The green zone is a support area where Bitcoin might react.
To collect the ATH liquidity, Bitcoin needs to break through the red zone.
Let’s see what happens | when the market direction isn’t clear, there’s no need to take unnecessary risks.
For risk management, please don't forget stop loss and capital management
Comment if you have any questions
Thank You
BABA Stock: A Detailed Analysis using Elliott Wave Theory RulesHello Friends,
Welcome to RK_Chaarts,
Let's analyze Ali Baba Group Holdings Limited, also known as BABA, listed on the NYSE. We'll be using the Elliott Waves theory.
Friends, as we can clearly see, after hitting a low of around $95.75 on 9th April 2025, it started an impulse wave. Within this wave, we've completed intermediate degree blue bracketed (1), (2), (3), (4), (5), and primary degree ((1)) in Black. Currently, we're completing primary degree ((2)), with a low around $111.
If it breaks the level of $111, we'll assume we're still in primary degree ((2)), as marked in scenario 2 on the chart. This means wave ((2)) is unfolding, and wave ((3)) might start after wave ((2)) is complete.
If it doesn't break the $111 level, it's likely that wave ((2)) has completed, and we've started a subdivision of wave ((3)) or its further subdivisions. If it moves further up, following scenario 1 (the black line on the chart), this is a possibility.
According to Elliott Wave theory, wave ((2)) cannot retrace more than 100% of wave ((1)). So, our main invalidation level for this count is $95.75. Yes, BABA is turning up against the 95.75 low, and in the near term, we expect the stock to trade higher.
Somewhere, this stock might move towards $150 or $160 if it doesn't break down below $ 95.75.
I am not Sebi registered analyst.
My studies are for educational purpose only.
Please Consult your financial advisor before trading or investing.
I am not responsible for any kinds of your profits and your losses.
Most investors treat trading as a hobby because they have a full-time job doing something else.
However, If you treat trading like a business, it will pay you like a business.
If you treat like a hobby, hobbies don't pay, they cost you...!
Hope this post is helpful to community
Thanks
RK💕
Disclaimer and Risk Warning.
The analysis and discussion provided on in.tradingview.com is intended for educational purposes only and should not be relied upon for trading decisions. RK_Chaarts is not an investment adviser and the information provided here should not be taken as professional investment advice. Before buying or selling any investments, securities, or precious metals, it is recommended that you conduct your own due diligence. RK_Chaarts does not share in your profits and will not take responsibility for any losses you may incur. So Please Consult your financial advisor before trading or investing.
