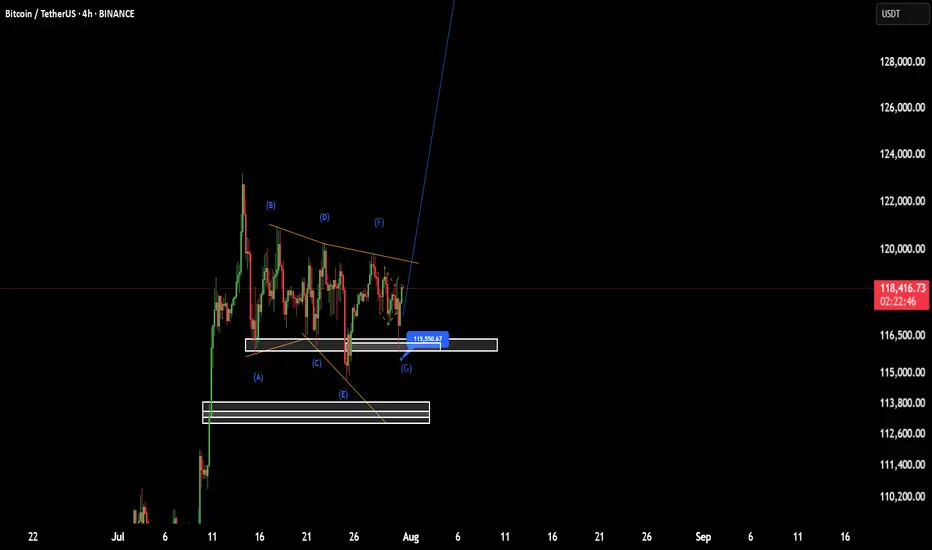
BTC(based on NEo wave)I think wave G is finished and soon it will pump to 138K.
stop loss is 115500.
attention:138K is the first target of these bullish waves.
Neowaveinvesting
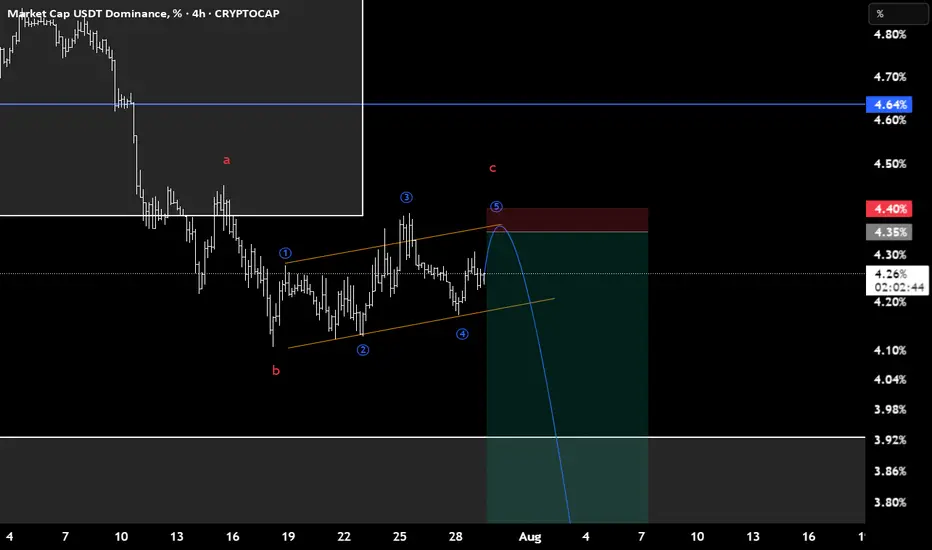
USDT.D(based on NEo wave)I consider this branch as a flat and c wave is the terminal with 3rd extended.
stop loss is 4.4.
Doge(based on NEo wave)confirmation of finishing the E wave of triangle is here now.
it takes about 400 days for all targets to pass.
see the related last chart of doge.

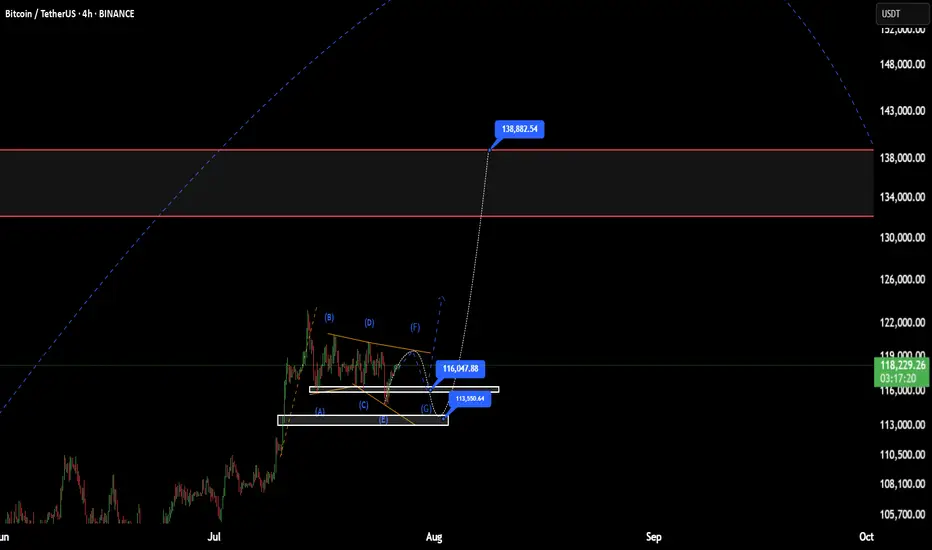
BTC(based on NEo wave)This range price is shown as a bow-tie diametrical.
I think G wave will end at one of those prices, 113 or 116
after this it will start a good bullish wave.
stop loss is 110K and the first target is 138K.
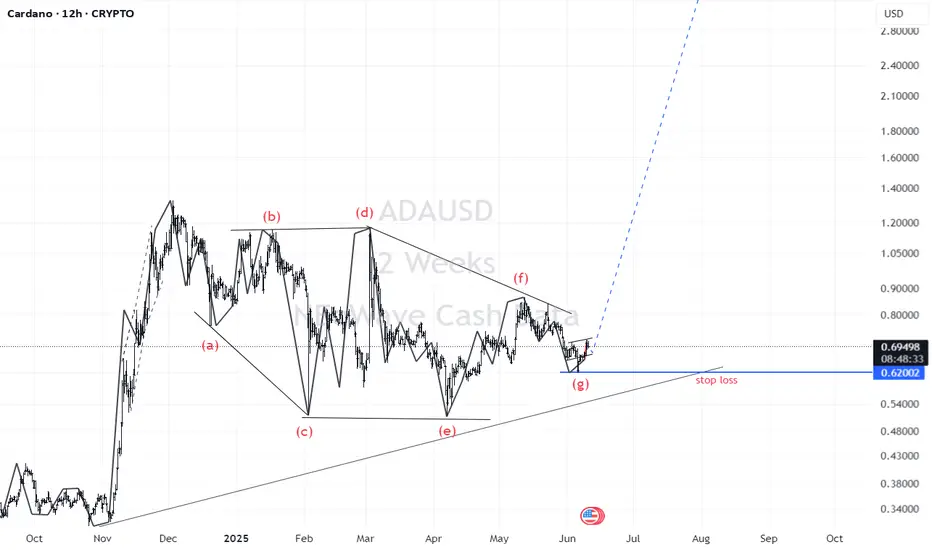
ADA(based on NEowave)this branch of Cardano is diamond diametrical but I didnt count the other branches and the larger degrees but based on ETH and other Altcoins I think it will pump soon.
Doge(based on NEowave)like ETH wave E is ending and soon it will start a huge bullish wave.
wave E look likes a bow-tie diametrical and wave g is at the end which is the last chance to buy.
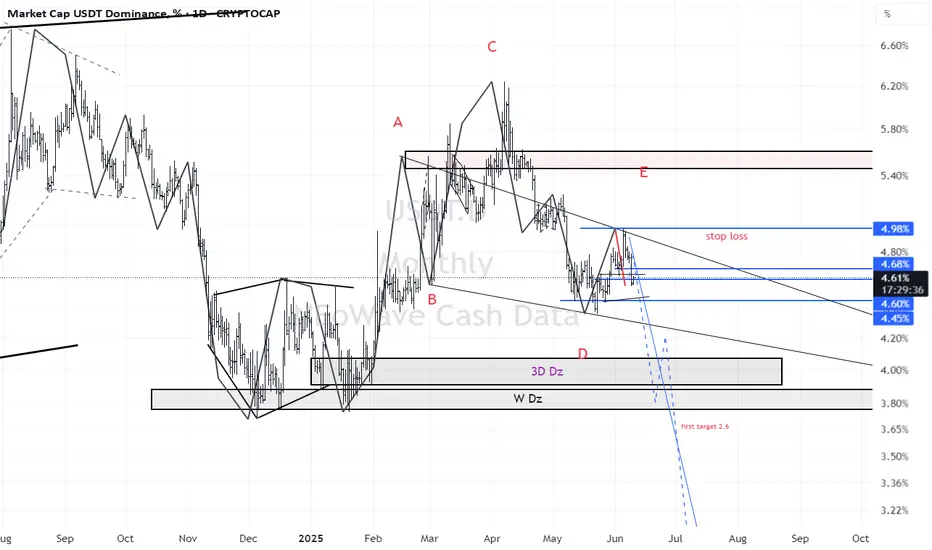
USDT.D(based on NEowave)I think wave E of triangle touched the necessary high and crypto is ready for a big pump.
pay attention to the targets and stop loss!
Solana(based on NEowave)I consider this as a triangle but under the price zone which is 139 it tells us its going to make a diamond diametrical.

ETH(based on NEowave)now the E wave of that cycle triangle looks like also a triangle.(if you dont know what Im talking about check the last analysis of ETH)
if e wave of this triangle breaks the SL it turns to a diamond diametrical.
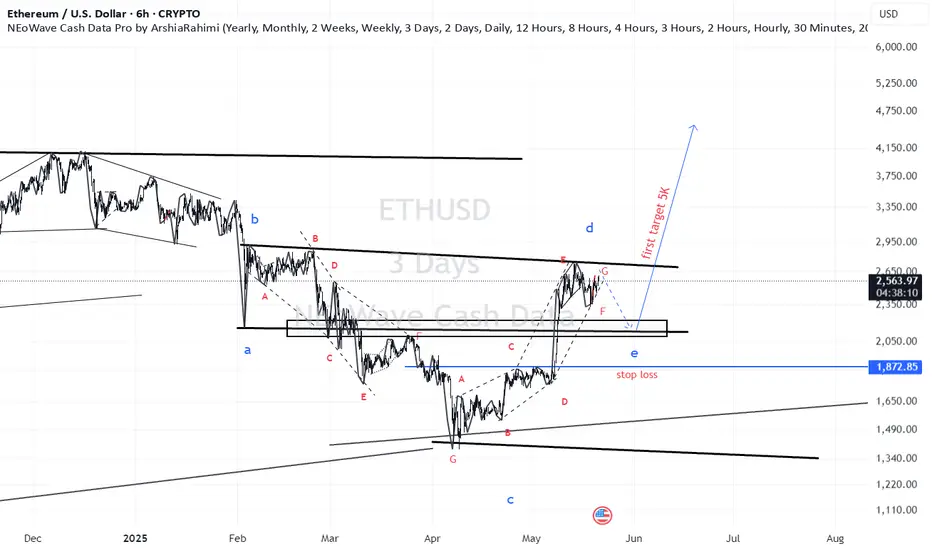
ETH(based on NEowave)Im sharing this because wave D is at the end and in the next 2 month you can see the main movement which is the start of wave E.
wave E takes about 350-450 days but after that there is a big and longtime bearish wave!

USDT.D(based on NEowave)check the long term of usdt dominance then you will understand this.
according to bow tie diametric(from 12H counting) we will see a new bull run and this is the last wave of that.

USDT.D(based on NEo wave) short termIm waiting for wave f and g but not sure about f
we should wait for it to show the pattern and breaking down 5.4 will confirm the bullish market.

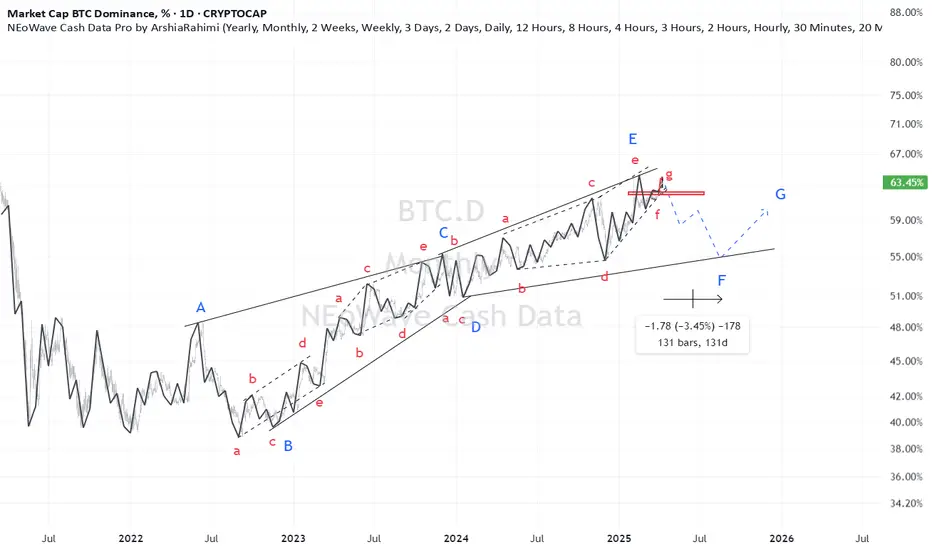
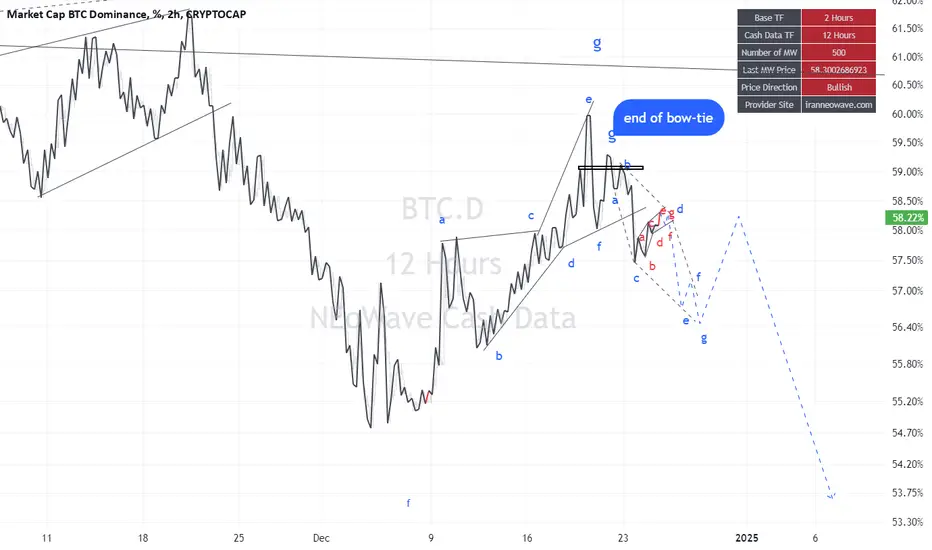
BTC.D( based on NEo wave)Bitcoin dominance is too messy for counting but I just count 2 time frames and I find out there is a little bearish wave on the way but breaking 62% confirms this.
if it happens good bullish wave can make eth over 4K
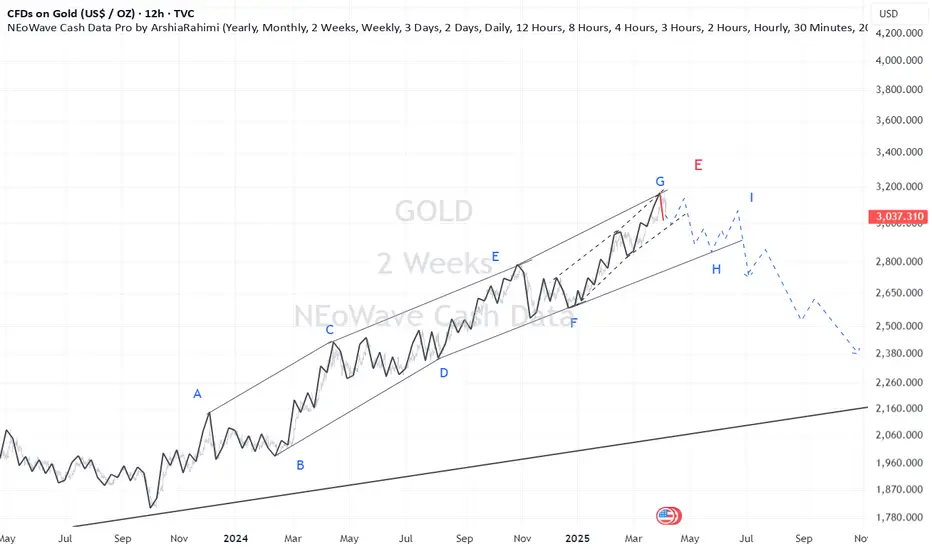
Gold(based on NEo wave)on this branch of gold it is making a symmetrical and wave g is ending>
I think a good corrective wave is on the way!
Doge(based on NEo wave)Doge is making a symmetrical which is a boring pattern and it takes too much time!
in about 150 days it will touch 0.90 _ 1 and after that a correction to 0.4_0.5 and after this it will pump too strong.

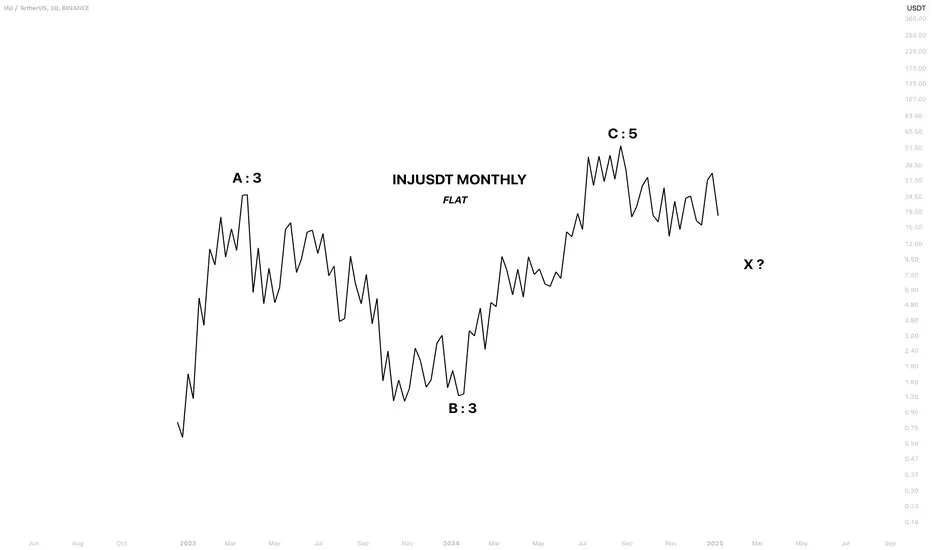
INJUSDT NEOWAVE ANALYSISWave A is the fastest and strongest wave on the chart, indicating that the long-term trend is up, and any downward wave is counter-trend.
The pattern is a flat correction, confirmed complete in April 2024 with the drop from $52 to $18.
Currently, we appear to be in an X wave.
The X wave can be labeled as small or large based on its retracement of the entire pattern. Since it is not yet complete, I cannot provide further details based on the monthly chart.
However, the price is likely to fully retrace the $13 low, and it should head lower.
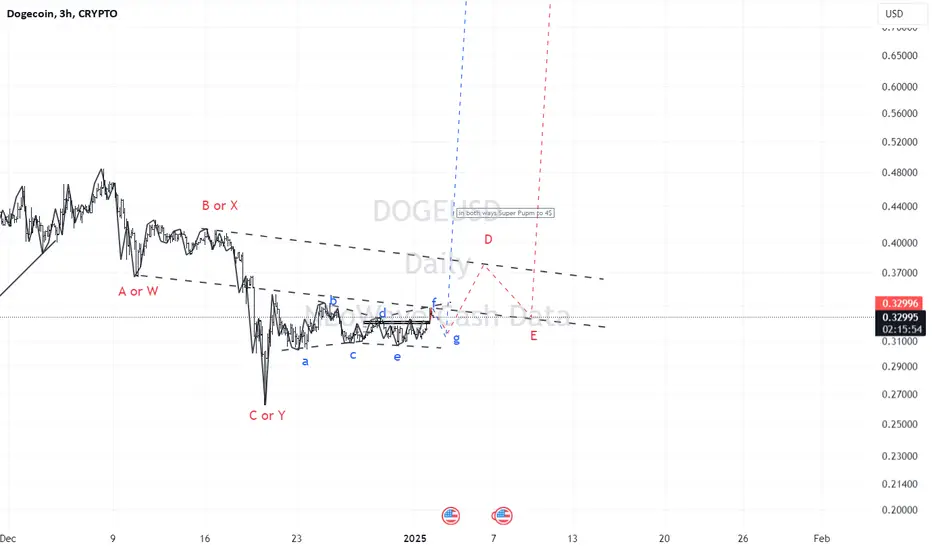
Doge(based on NEo wave)f wave of bow tie diametric is expanded so g wave shouldn't be too strong and also we can forget that bigger triangle and WXY is a better counting.

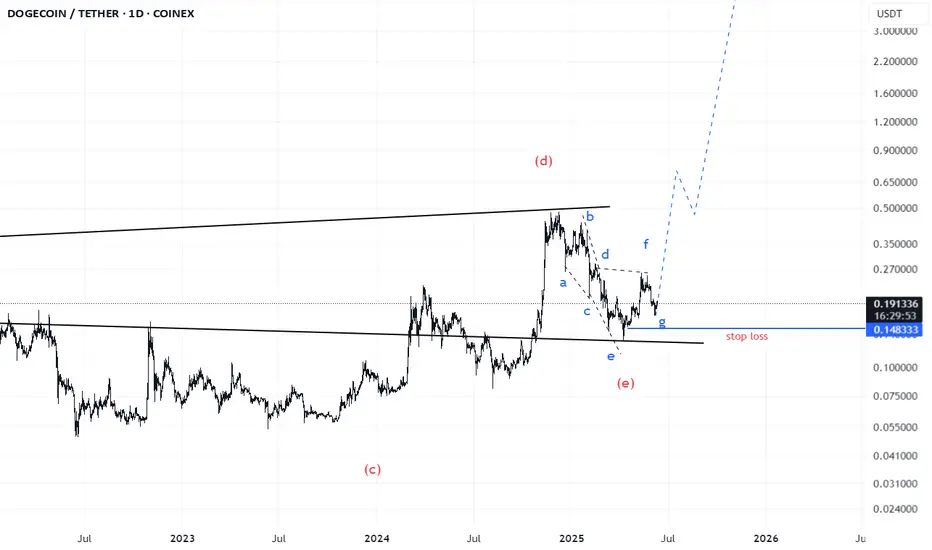
Doge(based on NEo wave)last counting failed but there is these 2 bullish scenarios for doge and I think soon we will see a dog which can fly!
one of the ways is complex corrective wave which contains WXY waves and the other one is triangle with ABCDE waves.
in short term the bow tie diametric with G wave (which is not formed yet), I prefer to buy more on G wave.
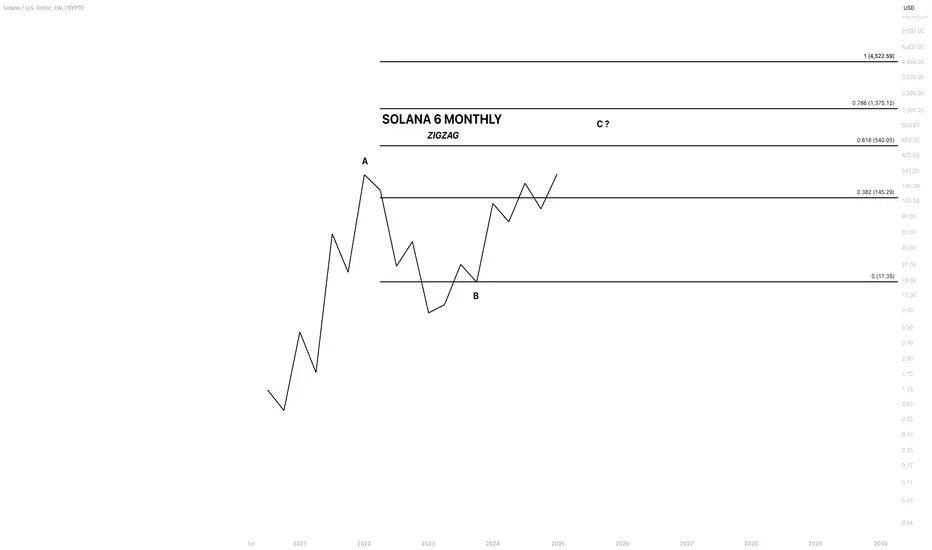
SOLANA NEOWAVE ANALYSIS The chart shows a simple zigzag pattern
Solana is currently in wave C.
The minimum target for the coming year is $540, as wave C of the zigzag should at least reach the 0.618 fib level.
Typically, a normal wave C can range from anywhere between the 0.618 to 1.618
Given Solana’s overall bullish structure, I believe the current price represents a strong buying opportunity and a loading zone.
BTC.D(based on NEowave)there is a way for short term of bitcoin dominance that it needs time to show himself.
I think diamond diametrical is fine for now.
I will uptade it.
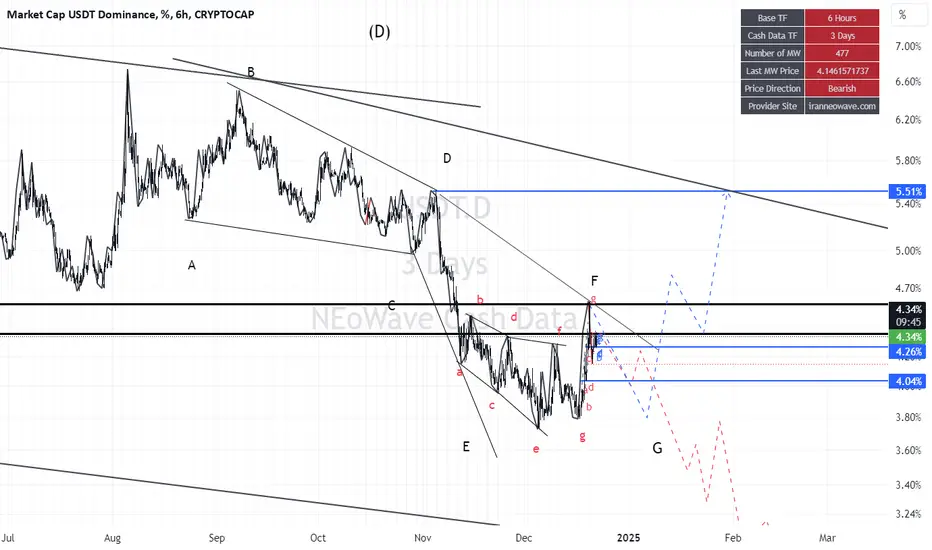
usdt.d(based on NEowave)as I told you we are at the start of wave G so there is 2 ways that it need to confirm to starting drop.
one of them is diamond diametrical and the other is a triangle. so wait to confirm it.
support me and share these charts with your friends please,
thanks.

USDT.D(based on NEowave)I had to change the counting of it a little so now I think wave F is finished and we are at the start of wave G.
there is 2 ways of that which I think the red scenario will happen and we can see a beautiful altcoin season.
support and share it to publish more ideas.
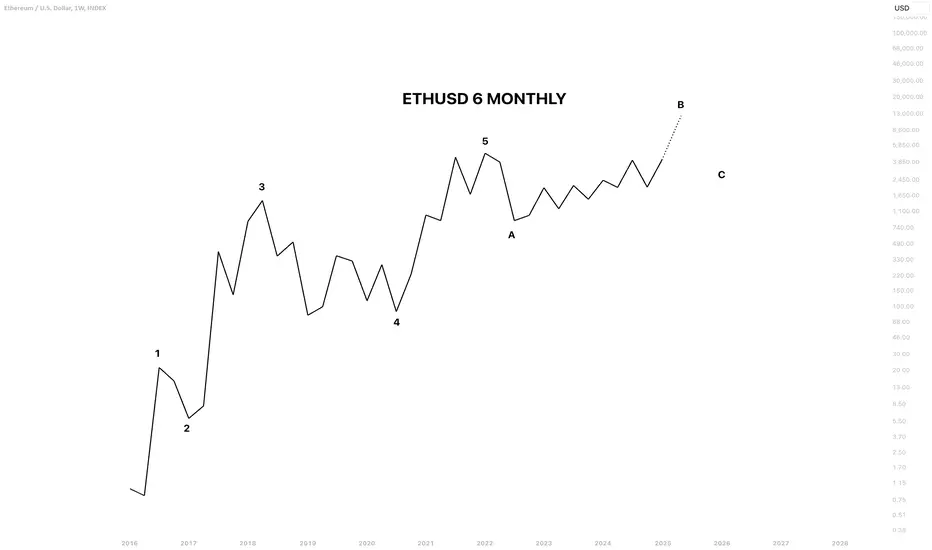
ETHUSD 6 MONTHLYSince its inception, ETH has moved up in a 5-wave pattern, which is now being followed by an ABC correction.
Wave A occurred during the last bear market.
Currently, we are in wave B, and the market is showing a lot of strength. Wave B should retrace the 5th wave completely and move higher. A move higher than wave 5 will indicate a strong B wave. Depending on where wave B finishes, it will determine whether wave C retraces wave A or not.
If the B wave falls between 101-123.6% of wave A, there is still a relatively good chance that wave C will completely retrace wave B.
If the B wave exceeds 123.6% of wave A, there is little chance that wave C will retrace all of wave B. If it does, it will still be an irregular pattern. When the B wave exceeds 138.2% of wave A, there is no chance that wave C will retrace all of wave B.
I personally can see ETH reaching around $7,000 to $9,000 very soon
This is all I can say based on the 6-monthly chart.