COIN NEOWAVE ANALYSIS (DAILY)Experimental analysis with the intention to follow back later on as I am still learning
After posting the weekly chart, I decided to take a look at the daily chart to see if I could spot any clues,
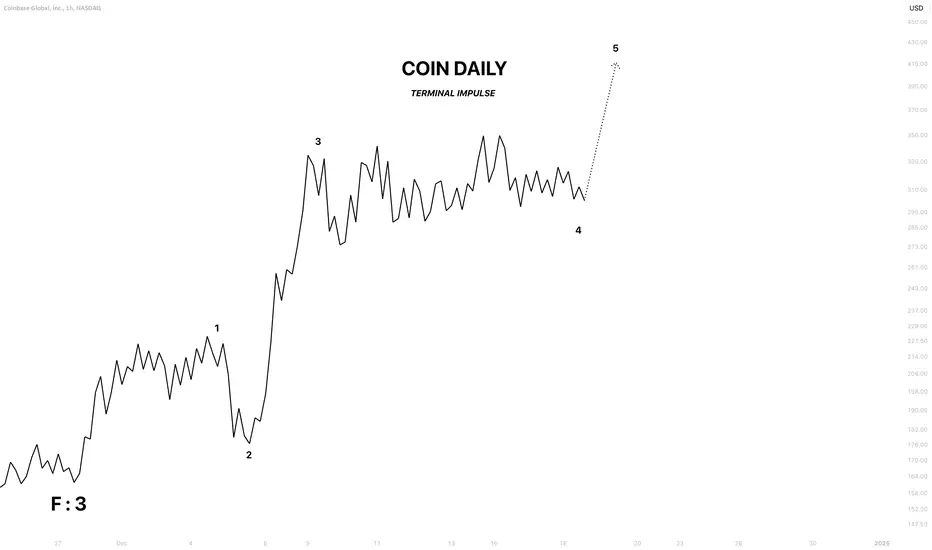
Initially, it looked like an expanding triangle, but after reviewing it thoroughly, it did not meet the requirements.
The only other formation that could fit this structure is a terminal impulse.
In this scenario, Wave 3 is the extended wave, doubling the size of Wave 1.
Typically, when Wave 3 is extended, Wave 5 tends to equal the length of Wave 1. If not, then Wave 1 will usually be either 61.8% or 161.8% of Wave 5.
With this in mind, I would anticipate a minimum 20% upside, a 35% medium target, and a maximum target around 65%.
Obviously, we can only get a real target once wave 4 is over.
I do expect this terminal pattern to be part of a complex correction featuring an X wave, or to be the first leg of a larger corrective structure.
If you read my weekly analysis, you will understand that this complex correction will end wave G, which would end the B wave. This daily chart hints at a stronger B wave, which would put COIN in a bullish long-term trend.
Note: Since this is a daily chart, the probabilities of failure are even.
Neowaveinvesting
IONQ NEOWAVE ANALYSISExperimental analysis with the intention to follow back later on as I am still learning
My dad actually shared this ticker with me since he was holding it. I tried my best to analyze it and come up with a conclusive statement at that time, although I couldn’t, and what I did come up with was completely invalid. The main reason being that the price data available is very recent, and there is not enough price action to tell what exactly is going on.
Today, I will try my best to let you know what’s happening and where IONQ is headed.
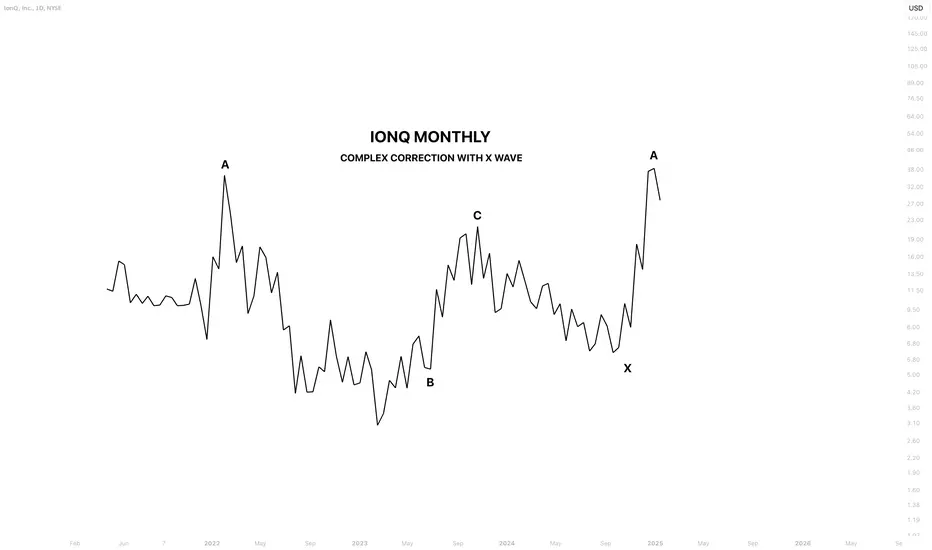
The pattern is a complex correction joined with an X wave. The first part is a running flat correction with a strong B wave.
All trending waves are to the upside, and the recent wave A, being the fastest and strongest wave, tells me that the long-term trend is up.
My only dilemma in this chart was understanding whether the wave after the flat was either an X wave or an A wave. The only reason I decided to call it an X wave is due to its slow price action, whereas the recent move is a better A wave rather than a B wave, which is likely not possible.
I do not know what kind of correction wave A is a part of, but my best guess could be a contracting triangle since wave A was pretty strong, and normally wave A is the largest wave in a contracting triangle. So, this correction would be a double three correction.
I do think wave A is over; however, we should get confirmation soon by the start of January.
BTC(based on NEo Wave)there is also this scenario for bitcoin, Im sorry but this E wave which I marked that with white is the most complex wave I have ever seen so Im not sure about the last scenario is correct or this one. I will update that as soon as possible.
thanks
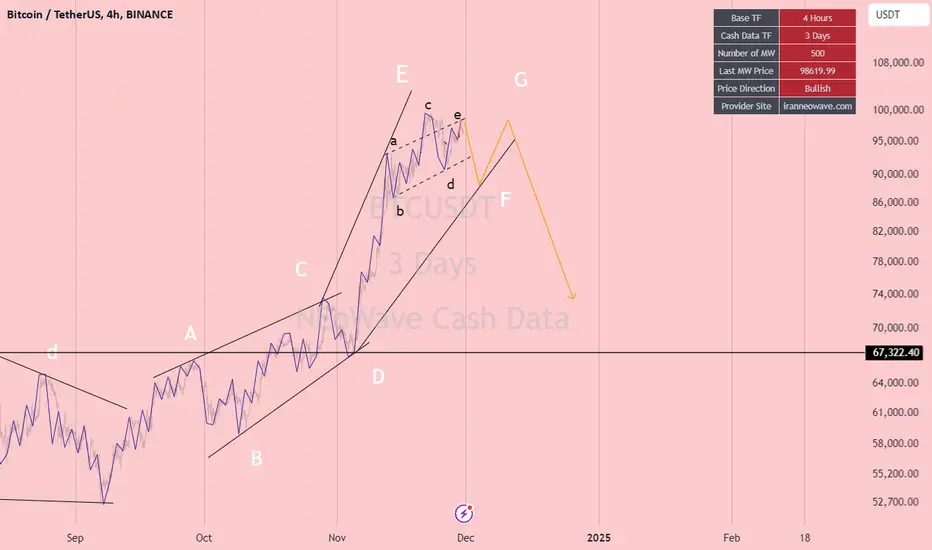
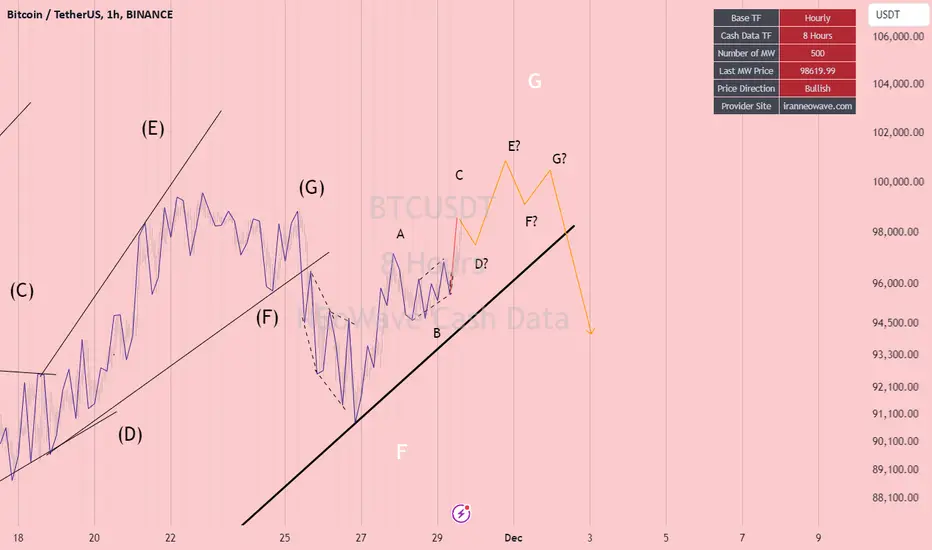
BTC(based on NEo Wave)this is the structure of wave G that Im talking about,there is different ways to end tis wave but for a good confirmation the black bold trend line breaks means that G wave had FINISHED.
also watch the last one of bigger degree.
MANA(based on NEo wave) structure of wave Ethere is two ways of the triangle to finish this wave E one of them is 0.26 and the other is 0.253.
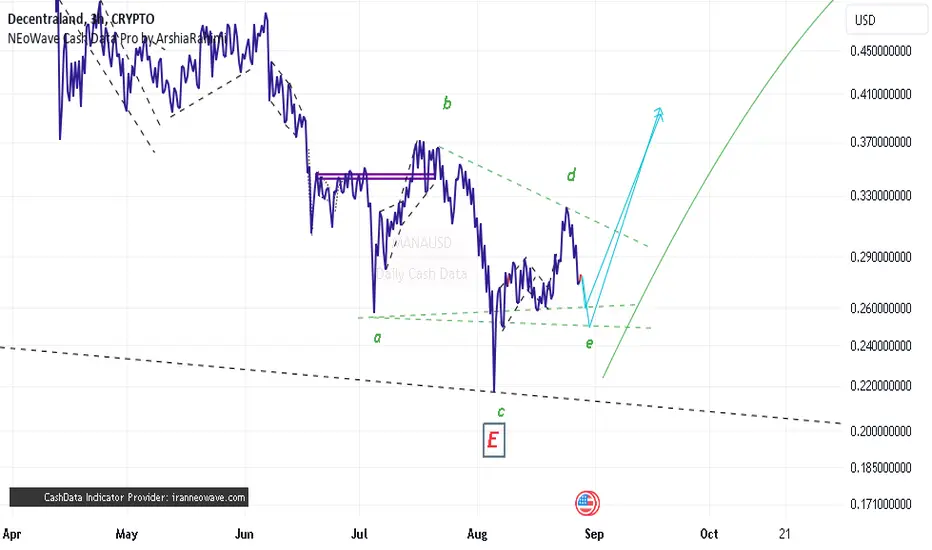
MANA(based on NEo wave)this diametric is at the end of wave E and the structure of wave E is a triangle that I wil show you in next chart.

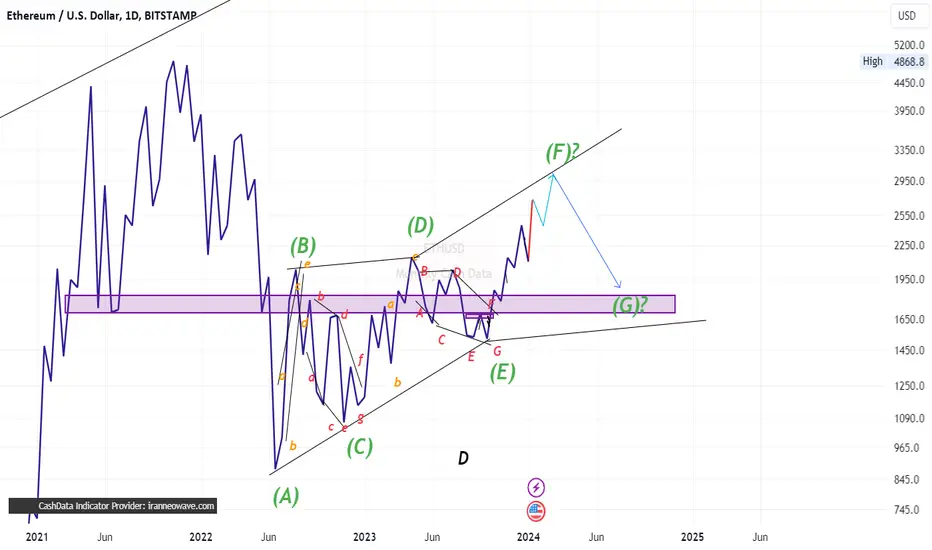
ETH(based on NEo wave)two scenarios for eth is:
1:triangle that the last wave is E and this correction is the last wave of that and it will start to goes up.
2:the bow tie pattern that has more corrective waves.

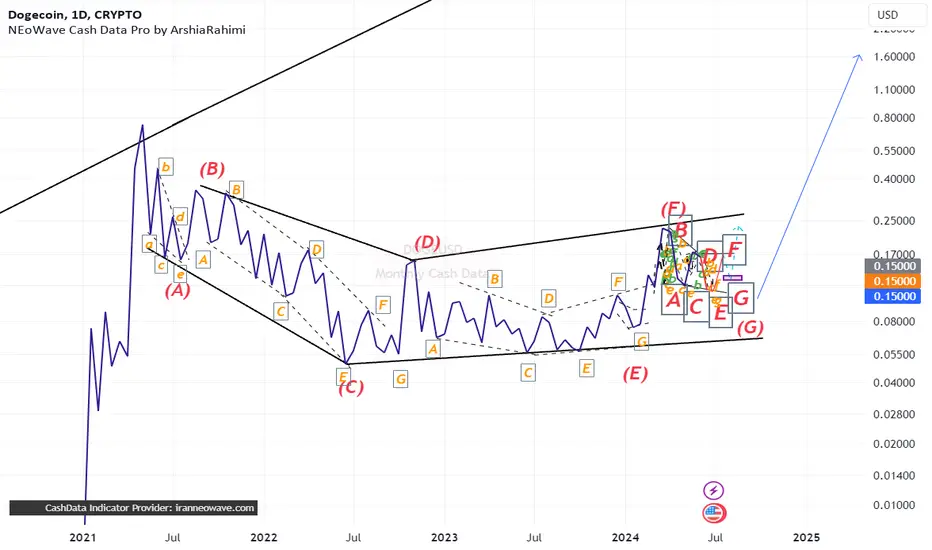
DOGE(based on NEo wave)I changed my counting this diametric is broken and its at the end of line, I will share the smaller time frames.
this situation is the last chance to buy and use the heavy bullish wave.
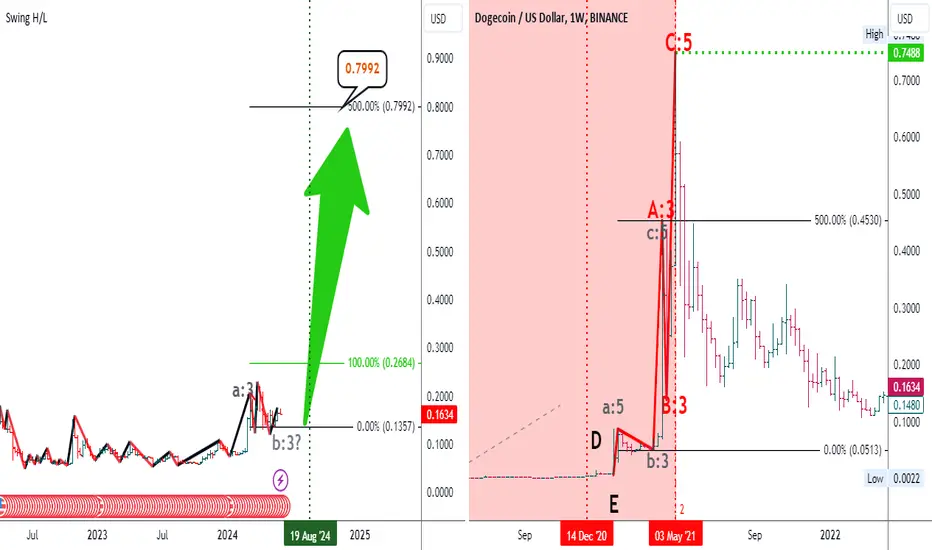
Elliott Wave Modern Analysis: Major Bullish Trends Unveiled!Hello traders! 📈✨ Today, we're diving into a comprehensive Elliott Wave Modern analysis on the DOGEUSD weekly chart (W1). With our two-window setup, we are comparing the current market behavior with a historical bullish trend from December 14, 2020, to May 3, 2021. Let's break it down:
Right Window Analysis:
Period: December 14, 2020 - May 3, 2021
Market Behavior: During this period, DOGEUSD exhibited a massive bullish trend forming an ABC flat pattern.
Key Levels:
Wave A: $0.4530, representing a 500% increase from a lower degree abc Zigzag (marked in grey).
Left Window Analysis:
Current Status: The market is currently forming the early stages of a three-wave pattern (a:3 & b:3).
Future Projection:
- If history repeats, we might see wave c:5 with a potential 500% increase, targeting $0.7992 from the height of a:3.
- Current Price: $0.1650
- Target: Watch for the first major peak around $0.7992!
🚨 Get ready for a potential bullish surge in DOGEUSD! 🚨 With these insights, we could be on the brink of another significant move. Stay tuned and trade wisely! 🚀💸
🔗 Follow for more updates and detailed analyses! 📊📌
#ElliottWaveModern #CryptoAnalysis #DOGEUSD #TechnicalAnalysis #BullishTrends #CryptoTrading #TradingView 🚀📈🌊
Dxy(based on NEo wave)For the short term is a bow tie diametric and it is the best scenario. So it will after that it is a little more correction.i will update it later

btc(based on NEo wave)I will sell all my bitcoins at 50K. every break on 50K and 52K is fake break and every good news is a signal to sell. like ETH after correction it has a good party and make yourself readyyyyyyyy.

ETH(based on NEo wave)there is a good correction on the way and it is great chance to buy eth. I will sell all of my eth soon. after this correction we will have a party so make yourself ready for it!
FIL(based on NEo wave)my last analysis of this coin has failed but I didnt change up my mind.
so this is bow tie pattern and its ready to blow up soon!
my first target is 27$ and the others are clear.

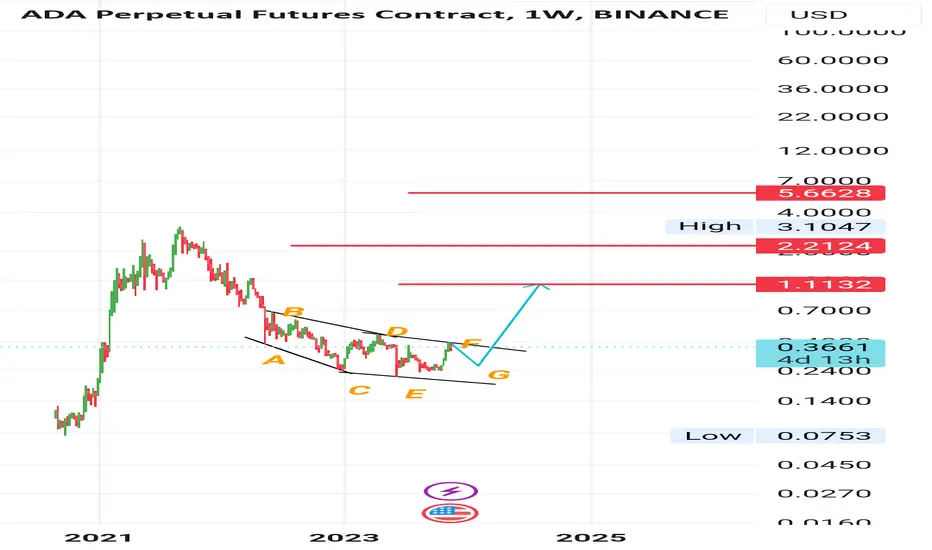
Ada(based on NEo wave)Now its recognizable pattern for me just a little time and price correction and it will start to grow.
My stop loss is wave E.
DYDX(based on NEo wave) there is a scenario for triangle and it has 22% stop loss! but is has a good risk to reward for first target, there are some other scenarios for this and maybe its a little risky!

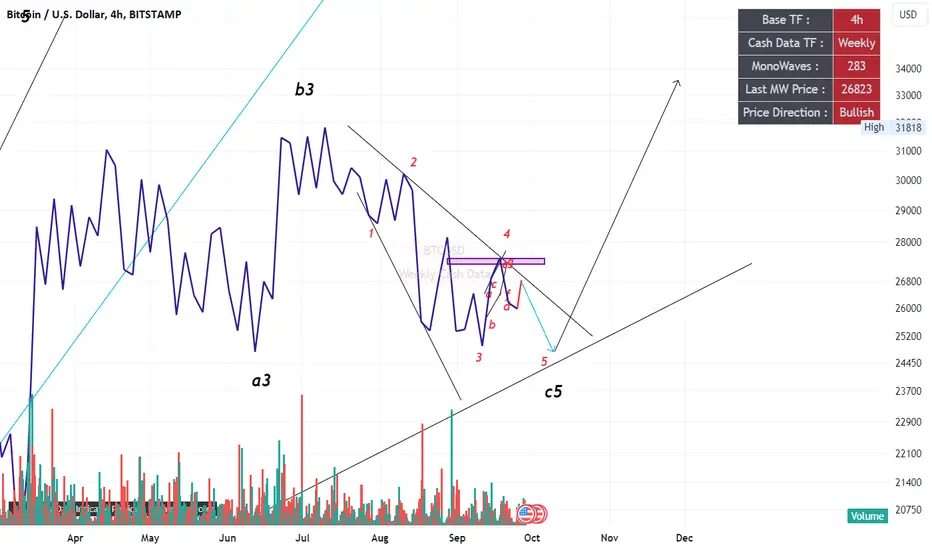
BTC(based on NEo wave)from the last two ways of btc I considered that the wave 5 is not finished yet and after a little more correction bitcoin should start a strong bullish wave. USDT dominance is also like this pattern(flat)but it is reverse,I try to keep it updated.
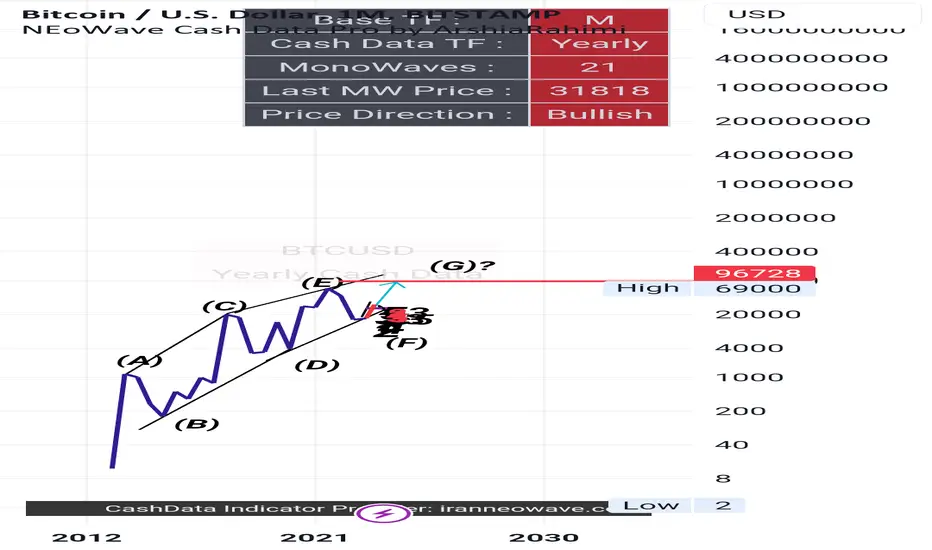
Btc(based on NEo wave)There is many targets and possiblities for wave G but for now I will target 96k....it can grow for 200k but it takes long time
Waiting is the best choice to it shows the structure of wave G.
ETH(based on NEo wave)Similar patterns on most of the charts, attention wave E could become incomplete.

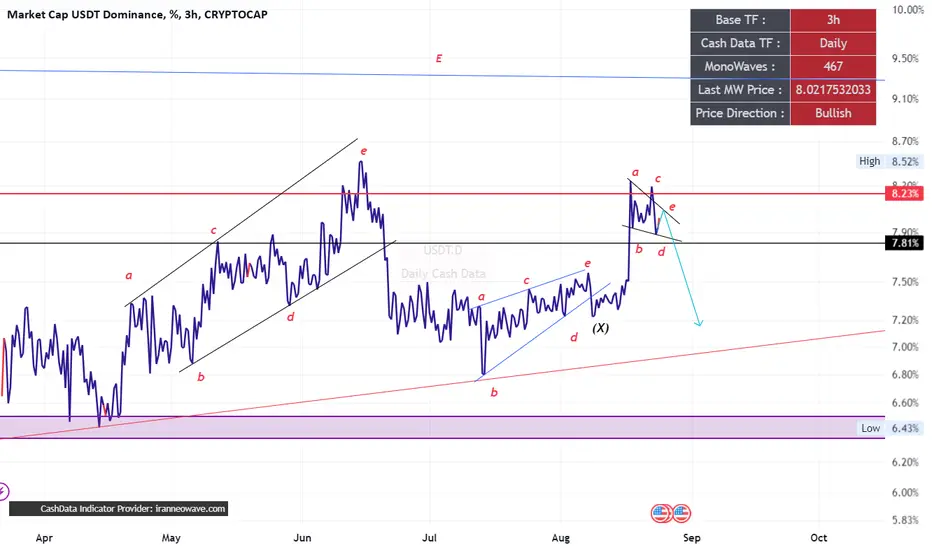
USDT.D(based on NEo wave)This is all of the E wave on daily TF but I am suspicious about the last branch , in the first sight it is triangle but it could be another patterns.the confirmation is breaking down the black line as I drew.
BNB(based on NEo wave)The second way that I think is this triangle and it is easier for trade and investing so use your strategy , but I think ETH is better for investing.

BNB(based on NEo wave)I think this complicated correction has 2 ways to show itself, first is bow tie correction and the second is triangle but actually I prefer ETH for holding.

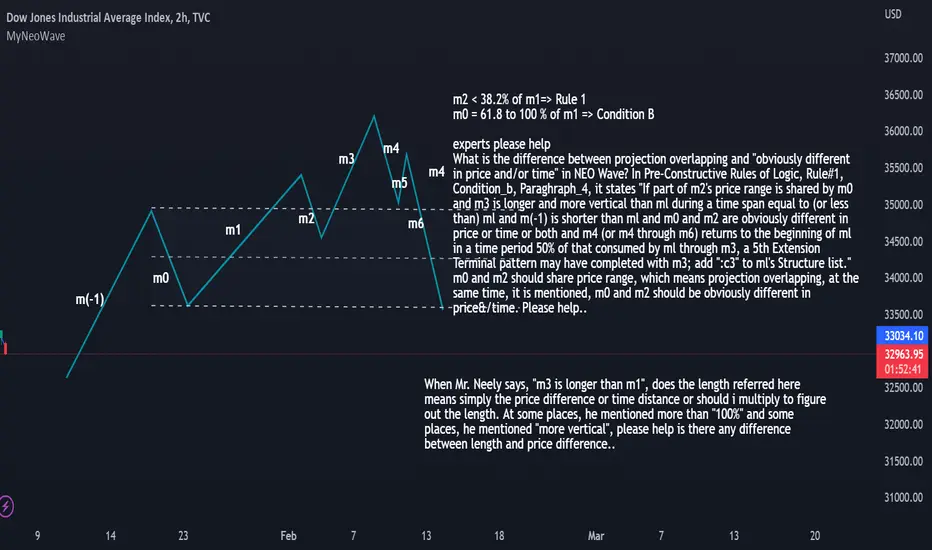
Neo Wave Learner doubtWhat is the difference between projection overlapping and "obviously different in price and/or time" in NEO Wave? In Pre-Constructive Rules of Logic, Rule#1, Condition_b, Paraghraph_4, it states "If part of m2's price range is shared by m0 and m3 is longer and more vertical than ml during a time span equal to (or less than) ml and m(-1) is shorter than ml and m0 and m2 are obviously different in price or time or both and m4 (or m4 through m6) returns to the beginning of ml in a time period 50% of that consumed by ml through m3, a 5th Extension Terminal pattern may have completed with m3; add ":c3" to ml's Structure list."
Here, m0 and m2 should share price range, which means projection overlapping, at the same time, it is mentioned, m0 and m2 should be obviously different in price&/time.
Experts please help..
Also, Mr. Neely mentioned, "m1 is longer than m3" in few other places, does the length means, by means of distance between 2 price points or by means of time distance or should i consider a multiple..
S&P500 Bearish For 2 Next MonthsIf S&P500 don't Beak 4100 point, it can go down during December and January.
