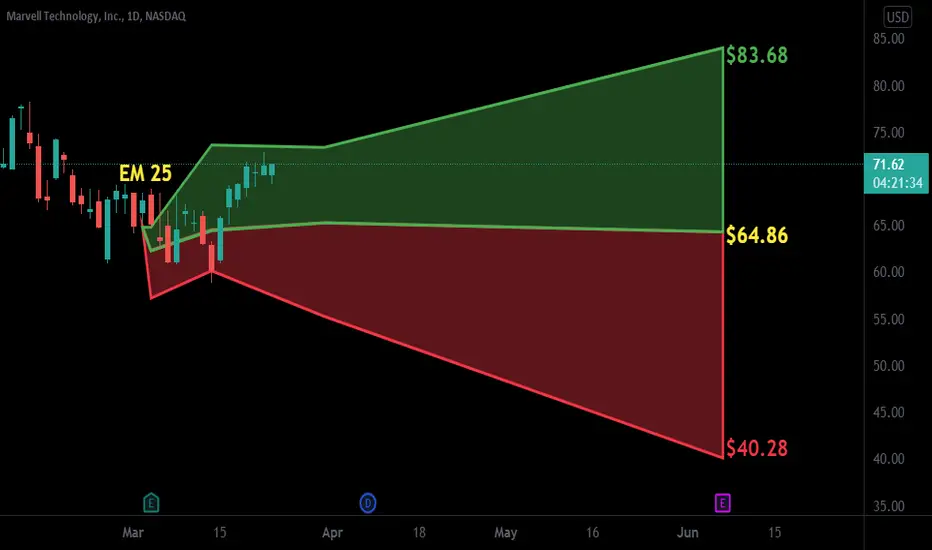
$MRVL with a Neutral outlook following its earnings #Stocks The PEAD projected a Neutral outlook for $MRVL after a Negative Under reaction following its earnings release placing the stock in drift D with an expected accuracy of 75%.
Neutral
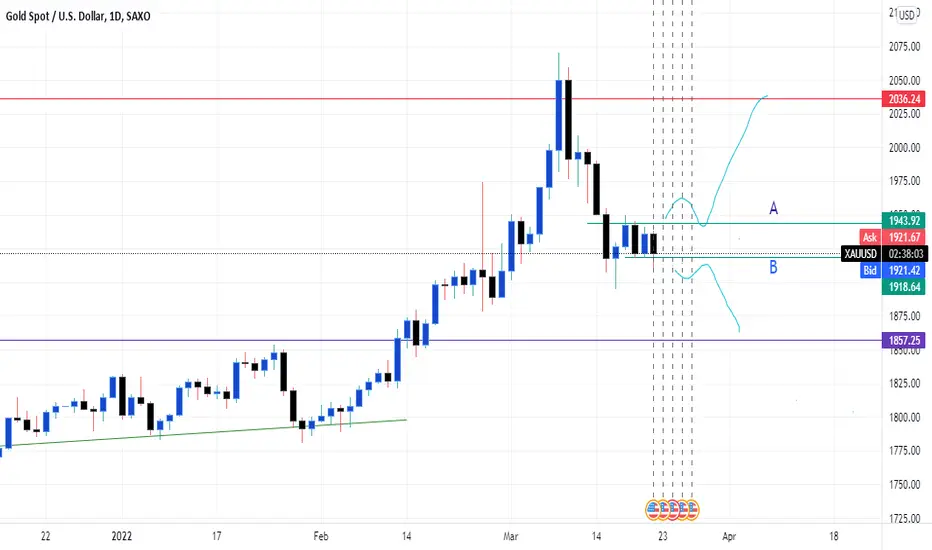
XAU/USD neutral positionThe idea of my analysis is simple as usual, we see gold currently in a range and I'm waiting for either a break above or below structure to make a trade decision with confluence from the higher timeframe.
$BRK.A with a Neutral outlook following its earnings #Stocks The PEAD projected a Neutral outlook for $BRK.A after a Negative Under reaction following its earnings release placing the stock in drift D with an expected accuracy of 66.67%.

SPY: Update. Oversold Analysis was CorrectAnother successful analysis. The trading since December has been rather difficult as you can see by the many long long wicks each monthly candle has
left behind. This means neither the bulls nor the bears were in complete control of the sentiment. But with the right analysis in conjunction with
proper risk management we can profit in any situation. Most of my charts have been predicting correctly what is most likely to happen. Here I can not be certain what will happen because we do not have enough information. The daily time frame has SPY (and the general markets) already in slightly overbought territory. I expect a pullback somewhat like what happened in gold (another successful trading plan even though it has been choppy). We need for the daily to pullback and the monthly to signal a long term buy signal if the bulls want that higher all time high. For now we just wait with out a position. If the markets rally and take off with out us that is ok we will wait for a nice 1hr set up with hidden or positive divergence if so. If it pulls back we will do the same and wait the 1hr time frame for positive divergence or a buy signal to buy the markets.

A LUNA Tale - play what is given83 and 53 are key supports for me. Will DCA down to 53 if available. The testing of the ATH resistance is strong. If it breaks through, I dont expect a $200 moon mission. $135 - $140 for a sell and a return to $105.

MAKE OR BREAK ZONE FOR BTCThe closure above the grey rectangular zone for me is a confirmation continuous uptrend.

$SO with a Neutral outlook following its earnings #Stocks The PEAD projected a Neutral outlook for $SO after a Negative over reaction following its earnings release placing the stock in drift C with an expected accuracy of 71.43%.

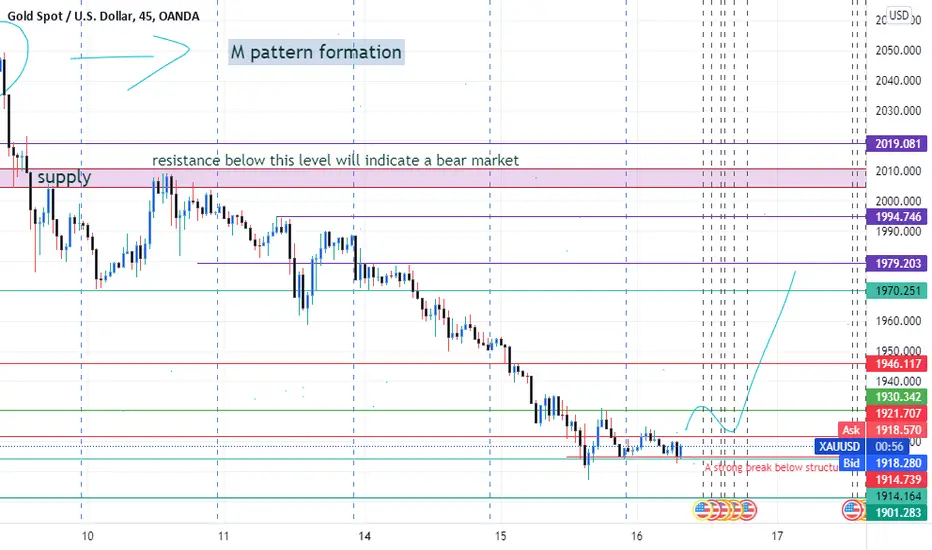
XAU/USD analysisWe are currently seeing price at a level it has'nt attained in a long time, price is bearish on the daily but we may see a correction before a downward continuation, there is no certainty as of now, so I'll be looking for price reaction around key levels.
$AZN with a Neutral outlook following its earnings #Stocks The PEAD projected a Neutral outlook for $AZN after a Positive over reaction following its earnings release placing the stock in drift B with an expected accuracy of 75%.

$KO with a Neutral outlook following its earnings #Stocks The PEAD projected a Neutral outlook for $KO after a Negative Under reaction following its earnings release placing the stock in drift D with an expected accuracy of 85.71%.

$TTE with a Neutral outlook following its earnings #Stocks The PEAD projected a Neutral outlook for $TTE after a Positive over reaction following its earnings release placing the stock in drift B with an expected accuracy of 58.33%.

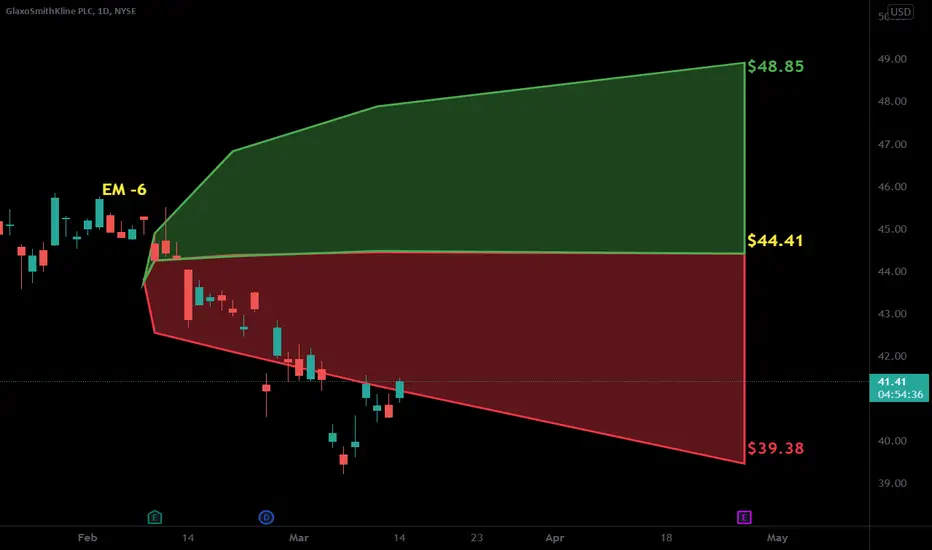
$GSK with a Neutral outlook following its earnings #Stocks The PEAD projected a Neutral outlook for $GSK after a Negative over reaction following its earnings release placing the stock in drift C with an expected accuracy of 77.78%.
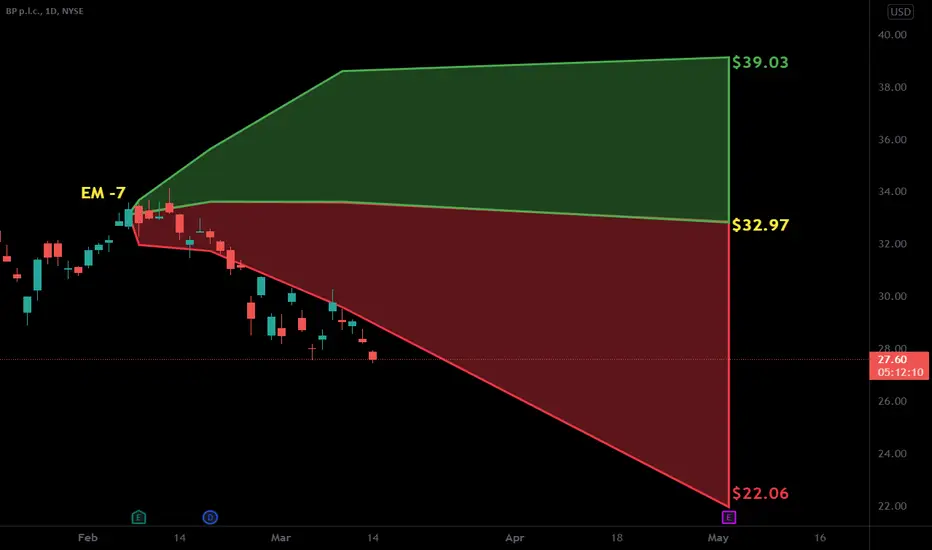
$BP with a Neutral outlook following its earnings #Stocks The PEAD projected a Neutral outlook for $BP after a Negative over reaction following its earnings release placing the stock in drift C with an expected accuracy of 71.43%.
EUR/JPY - Wait for BreakMonthly:
1. Very strong push to the upside after break
2. The price now face stron resistance
Looks Neutral for now
Weekly:
1. Double Top
2. Break of strong support level
3. Neckline test with rejection
Looks bearish for the moment.
If see bearish signals on lower timeframe
i will sell.
Daily:
1. Morning star formation from the bottom
2. Inverted Head and Shoulders pattern
Inverted Head and Shoulders pattern is trend
reversal structure so I will watch carefully what
will happend next week.
4H:
1. Inverted Head and Shoulders
If brake up will be good chance for buy
when pullback for test.
If brake down will be good chance to sell
when pullback for test.

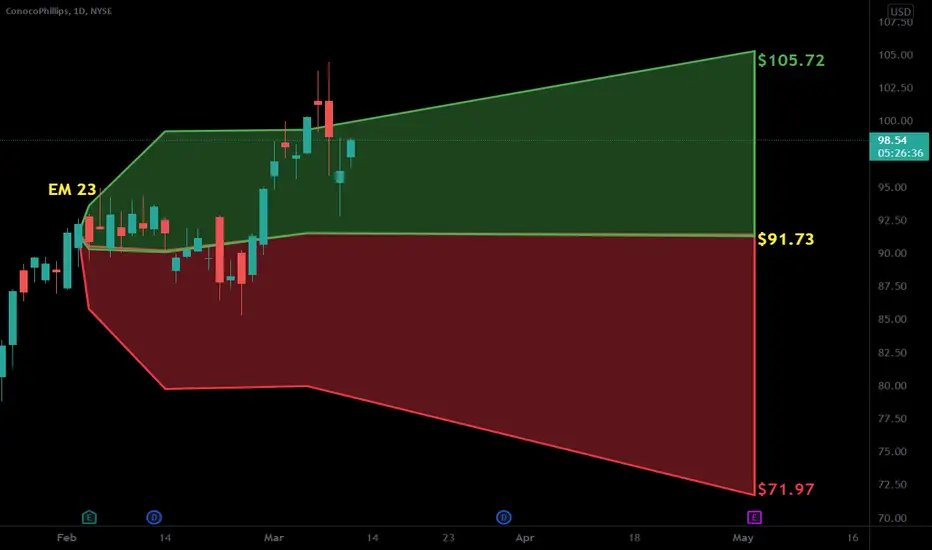
$COP with a Neutral outlook following its earnings #Stocks The PEAD projected a Neutral outlook for $COP after a Positive over reaction following its earnings release placing the stock in drift B with an expected accuracy of 100%.

$ABBV with a Neutral outlook following its earnings #Stocks The PEAD projected a Neutral outlook for $ABBV after a Negative over reaction following its earnings release placing the stock in drift C with an expected accuracy of 100%.

$NVS with a Neutral outlook following its earnings #Stocks The PEAD projected a Neutral outlook for $NVS after a Positive Under reaction following its earnings release placing the stock in drift A with an expected accuracy of 100%.

$CAT with a Neutral outlook following its earnings #Stocks The PEAD projected a Neutral outlook for $CAT after a Negative Under reaction following its earnings release placing the stock in drift D with an expected accuracy of 71.43%.

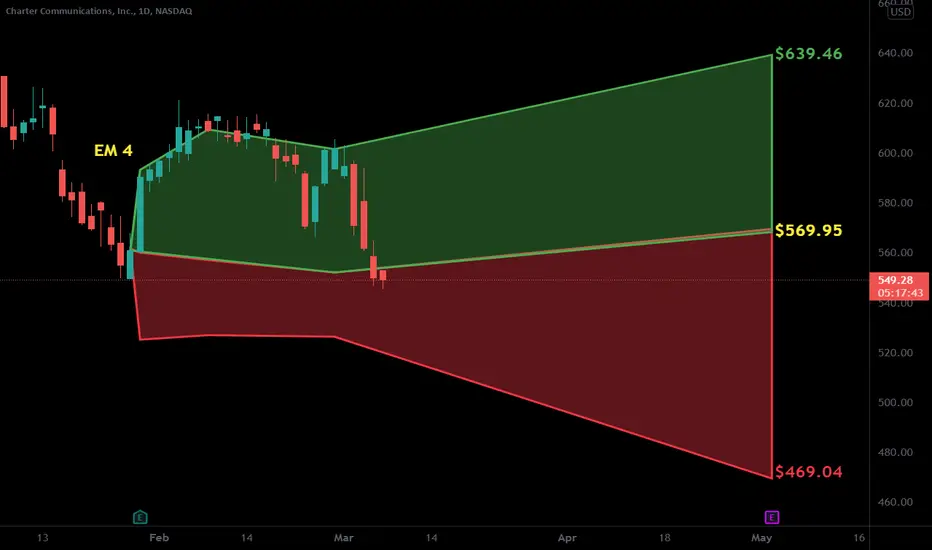
$CHTR with a Neutral outlook following its earnings #Stocks The PEAD projected a Neutral outlook for $CHTR after a Negative over reaction following its earnings release placing the stock in drift C with an expected accuracy of 20%.
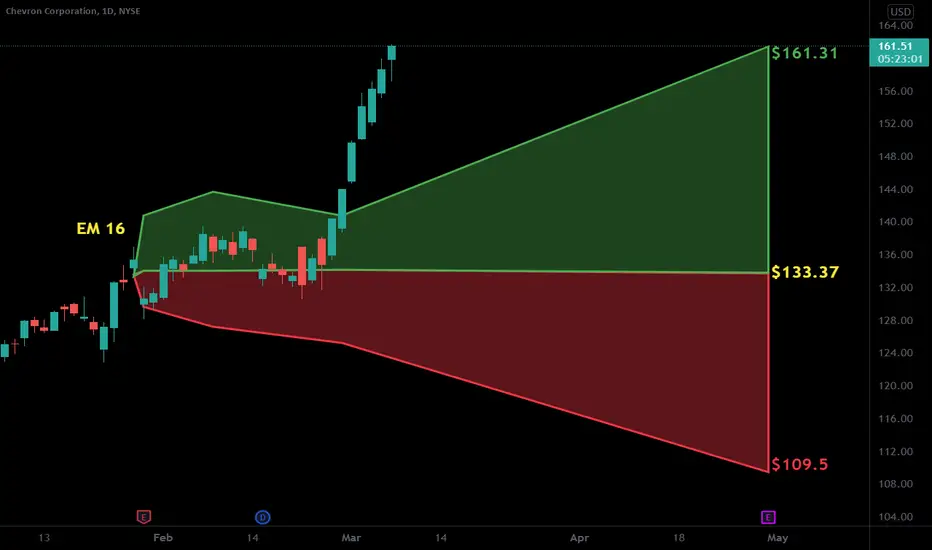
$CVX with a Neutral outlook following its earnings #Stocks The PEAD projected a Neutral outlook for $CVX after a Negative over reaction following its earnings release placing the stock in drift C with an expected accuracy of 33.33%.
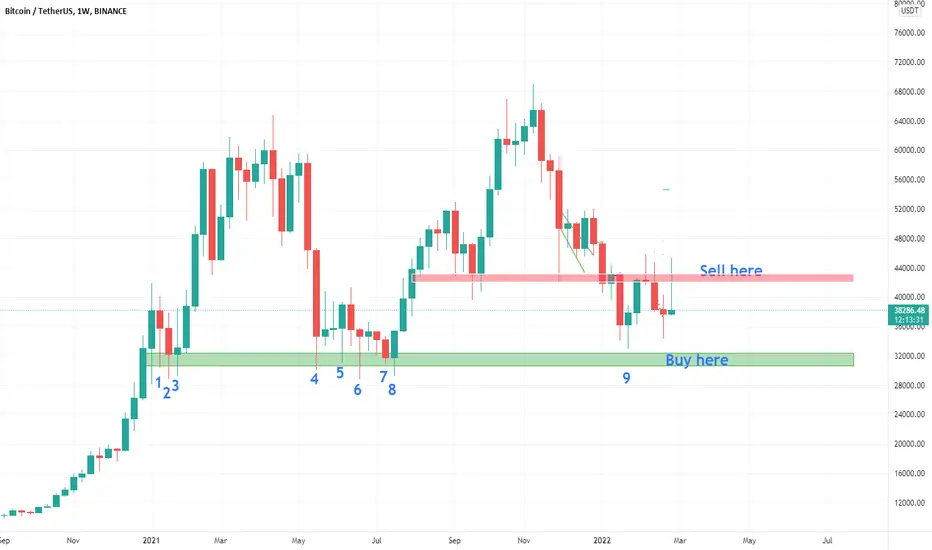
Worrying BTC chartBTC has been ranging 30-60k for almost a year now. Currently it has tested weekly support in low 30s about 10 times! We can say currently 30k is old 6k where we had established multi month support previously and we know what happened when it broke.. This weekly candle looks pretty bad is it retraced almost whole move. Having that said, still best bet is in low 30k's hoping that support will hold once again. The question is are buyers are going to step in and buy this support that has been tested so many times..
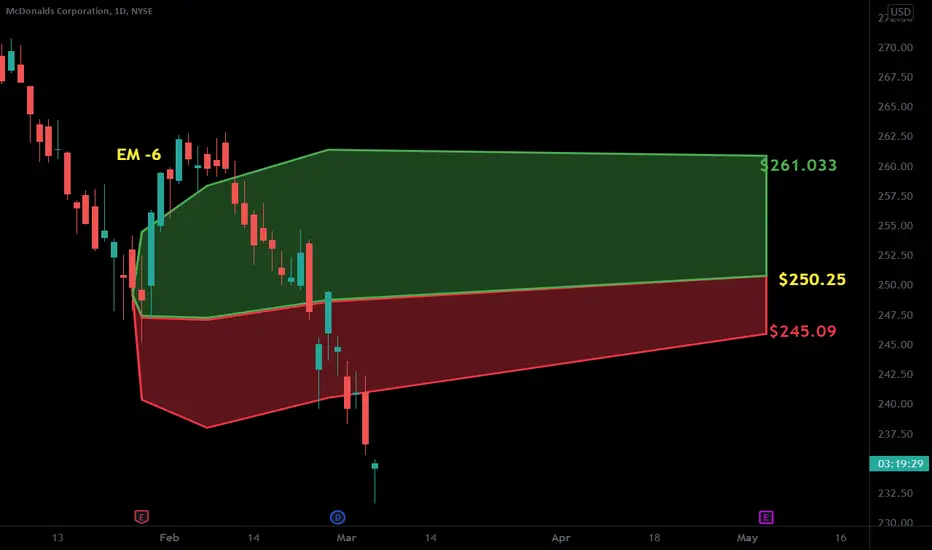
$MCD with a Neutral outlook following its earnings #Stocks The PEAD projected a Neutral outlook for $MCD after a Negative over reaction following its earnings release placing the stock in drift C.