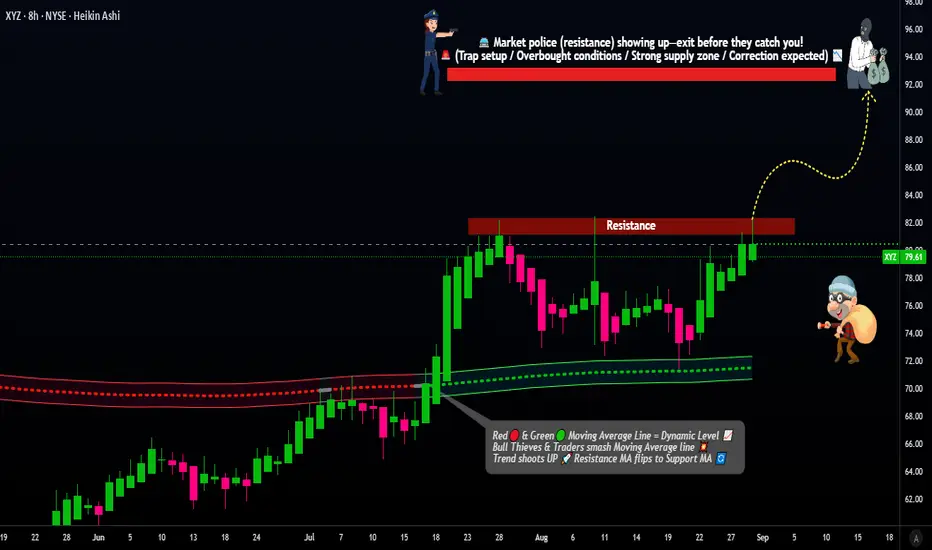
XYZ Bullish Setup: Pending Entry & Target Strategy!📌 Asset & Plan
XYZ (Block, Inc.) NYSE | Swing/Day Trade
Plan: Bullish 💹 (Pending Order Setup)
Breakout Entry: Near $83.00 ⚡ (Set alerts to catch the breakout!)
🧩 Thief-Style Layer Strategy
Multiple limit layer entries after breakout: $82.00 / $80.00 / $78.00
Scale your positions according to your risk appetite and strategy 📈
Stop Loss: $74.00 (adjust as per your risk) ⚠️
Target: $92.00 🏁
📊 Real-Time Market Snapshot (Sep 1, 2025)
Current Price: $79.64
52-Week Range: $46.53 - $98.92
🧠 Investor Sentiment
Retail: Moderately Bullish (60% Greed) 🟢
Institutional: Cautiously Optimistic (55% Greed) 🟡
Fear & Greed Index: Neutral → Greed (58/100) 📊
💹 Fundamental & Macro Highlights
Fundamentals (6.5/10) ✅
Undervalued by ~29% (Intrinsic Value: $111.64)
EPS Growth (2026 Est.): +39.49% YoY
Revenue Growth (2025 Est.): +2.92% YoY
Strong solvency & healthy gross margins
Macro Environment (6/10) 🌍
Market Volatility: Low
Safe Haven Demand: Moderate
Interest Rates: Stable (Fed rate cuts expected late 2025)
🐂 Overall Market Outlook
Bullish Score: 65% 🟢 (S&P 500 inclusion & strong analyst targets)
Bearish Risks: 35% 🔴 (slowing revenue growth & competition pressures)
💡 Bottom Line
XYZ is undervalued with moderate bullish sentiment. Use layered entries to optimize risk/reward, set alerts for breakout, and monitor macro factors. 🚀
#NYSE #StockTrading #SwingTrade #DayTrade #BullishSetup #BreakoutAlert #LayerStrategy #XYZStock #TechnicalAnalysis #MarketInsights #TradingIdeas
Newyorkstocexchange
ALNY, LTH & ZETA - The momentum may drive prices to new heights!Alnylam Pharmaceuticals
The stock price has encountered several rejections around the 212 level, leading to subsequent corrections.
After establishing a Double Bottom pattern, the price attempted to reverse the downward trend but was unable to do so, facing rejection at the 200 level.
Consequently, the stock underwent another correction.
Following this, the price entered a consolidation phase, forming a Box pattern for a while.
In a surprising turn, the price gapped up significantly and broke through its former strong resistance area, remaining above it.
Following a brief pullback, the price resumed its upward trajectory, supported by solid trading volume.
Life Time Group Holdings
Following a rejection around the 22.5 level in November 2021, the stock experienced a significant decline, dropping to just 8.75.
Subsequently, the price began to rise again, eventually returning to its previous strong resistance level after a lengthy climb. However, it struggled to break through that barrier and faced another substantial drop.
During this downturn, the stock hit a low around 11.3 and then navigated through numerous fluctuations, leading to the formation of a Symmetrical Triangle pattern on the chart.
After successfully breaking out of this pattern to the upside, the price surged and managed to overcome the resistance level.
If the stock can hold onto this level, we might see even more upward momentum in the days ahead.
Zeta Global Holdings
The stock price had been consolidating within a Box Pattern before breaking free.
Since that breakout, the stock has experienced a steady uptrend, marked by higher highs and higher lows.
Amid this upward movement, a Cup & Handle pattern formed, signaling that the trend is likely to persist.
Following the breakout, the price is now climbing higher, supported by a significant increase in trading volume.

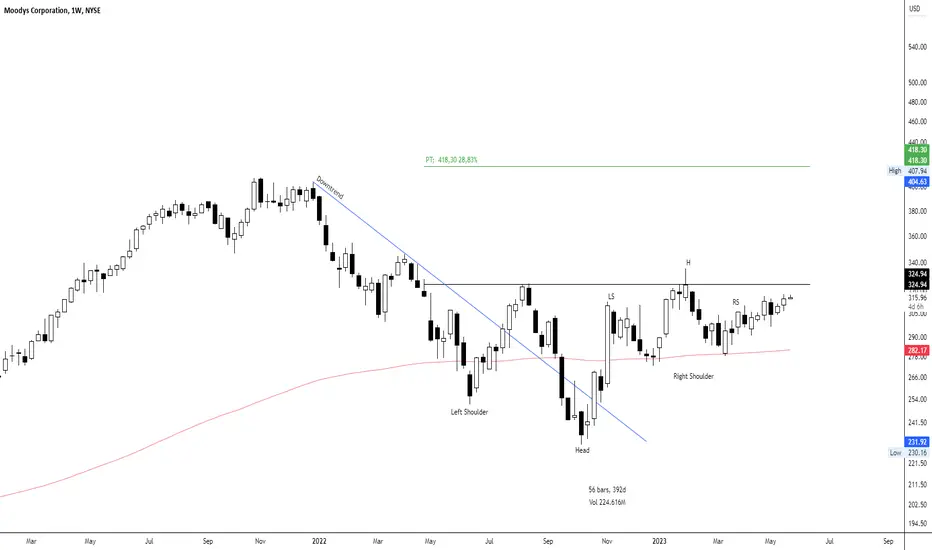
Moody's Corporation WCA - Inverted H&S
Company: Moody's Corporation
Ticker: MCO
Exchange: NYSE
Sector: Financial Services
Introduction:
Hello and welcome to our technical analysis! Today we're examining the weekly chart of Moody's Corporation on the NYSE. A fascinating pattern within a pattern is currently unfolding, with an inverted head and shoulders formation potentially serving as a bottom reversal.
Inverted Head and Shoulders Pattern:
An inverted head and shoulders pattern typically serves as a bullish reversal pattern, signifying the transition from a downtrend to an uptrend. It's characterized by three successive lows with the middle low (the head) being the deepest and the two other lows (the shoulders) being shallower.
Analysis:
Moody's previous trend was clearly bearish, interrupted by a consolidation phase taking the form of an inverted head and shoulders. This pattern has been developing over 392 days.
Although the usual symmetry between the shoulders is absent, the right shoulder sitting higher than the left is typically a positive sign. Intriguingly, the right shoulder itself seems to be forming as a smaller head and shoulders pattern, all occurring above the 200 EMA.
The horizontal neckline of this pattern is at $325. A breakout above this level could provide an opportunity for a long position entry. Upon a successful breakout, our projected price target would be at $418.30, translating into a potential price rise of approximately 28.83%.
Conclusion:
The weekly chart of Moody's Corporation presents an interesting pattern within a pattern, where a short-term head and shoulders pattern forms within a longer-term inverted head and shoulders pattern. A confirmed breakout above the neckline could offer a promising long position entry.
As always, it's important to conduct your own due diligence and employ appropriate risk management strategies before making any investment decisions. Not financial advice
Thank you for joining this analysis. If you found it insightful, please like, share, and follow for more market updates. Happy trading!
Best regards,
Karim Subhieh
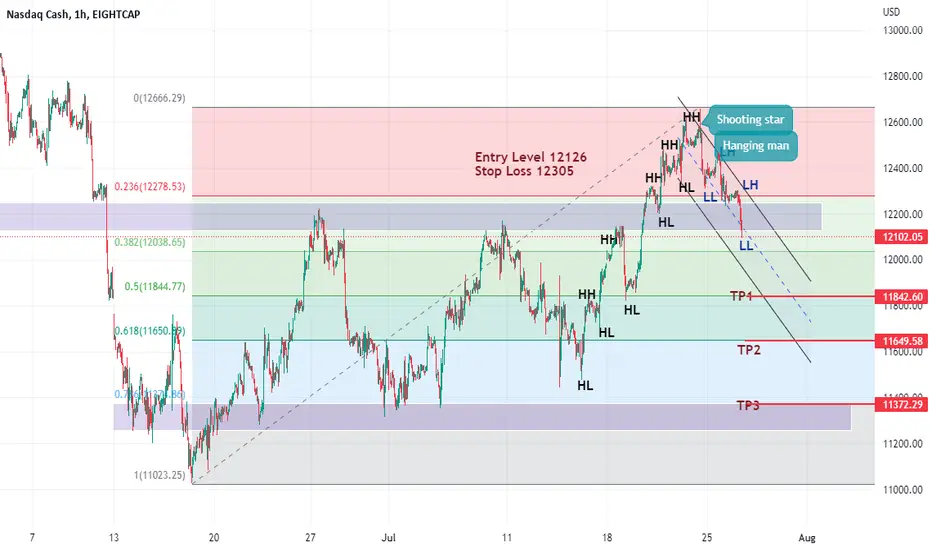
NASDAQ in Bearish Trend for the dayNasdaq on fib retracement levels showing downwards movements to at least 50%
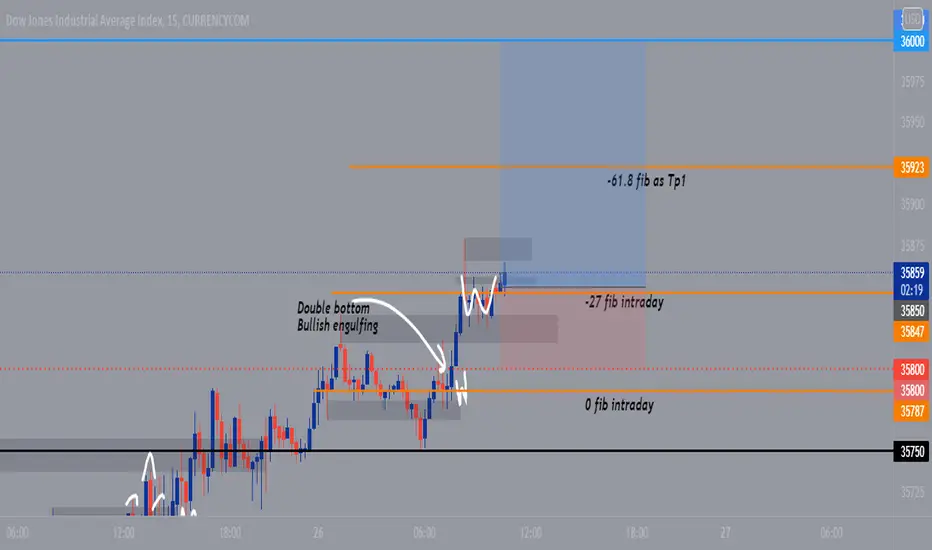
US30Dow jones todays Outlook , Price did break the psychological level 35750 , and confirms the bullish momentum by forming double bottoms confluenced by the engulfing above the 0 intraday fib , waited for price to break that previous supply to be sure of my buyers did that formed the same bullish reversal , next stop @ 36000 , i anticipate a 150 pip move
Is SalesForce making a highHello Traders, SalesForce is a nice sell because it's hitting a large volume of sell orders right now. A good candle information at the big order zone will be the trigger for the sell. I will be posting updates if necessary. Thank you.

NYSE COMPOSITE INDEX (NYA) WeeklyDates in the future with the greatest probability for a price high or price low
