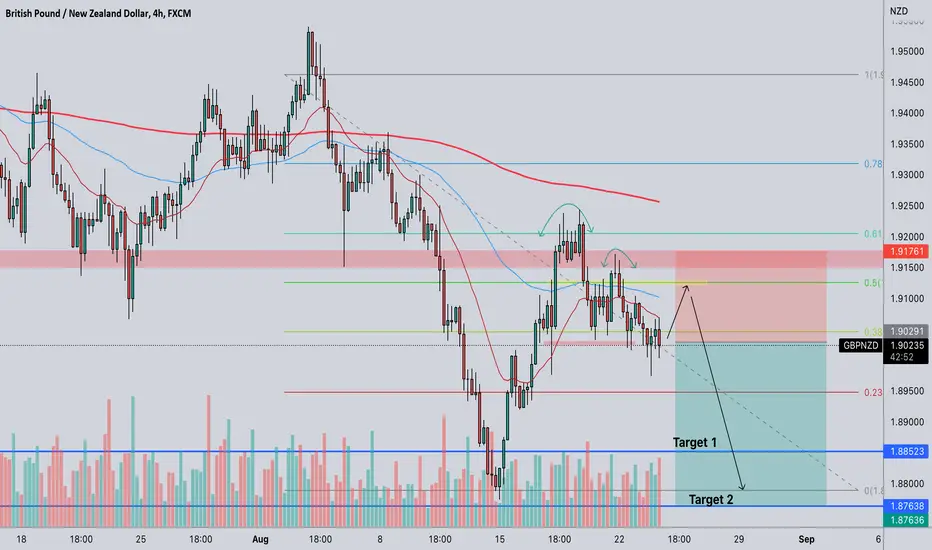
Trend change for GBPNZD❓Earlier on this evening UK time we had a buy alert for GBPNZD
Is the trend changing for this pair?
Trend trade identified and entered.
Working 45M timeframe on this strategy.
Trade details can be found on the chart in printed label.
All the TP values same in label as that's what I'm aiming for on this strategy.
Trade box is tracking the trade.
Want to know how I identified this trade you know what to do.
Thanks for looking
Darren🙌
Newzealanddollar

AUD NZD - FUNDAMENTAL DRIVERSAUD
FUNDAMENTAL OUTLOOK: NEUTRAL
BASELINE
Despite a decent recovery from the start of the year, the AUD gave back most of its 1Q22 gains throughout 2Q22 due to China’s continued struggles with Covid breakouts, and more recently the big slump in key commodities (Iron Ore & Coal). China’s economy is always a key focus for the AUD. While other major economies are expected to slow in 2022, China was expected to grow (with monetary and fiscal policy very stimulative), but we are yet to see the new additional stimulus measures spill over into the soft and hard data. The expected recovery, if it happens, remains a key consideration for the AUD. Our view in 1Q22 was that China’s expected recovery would be enough to keep commodities like Iron Ore supported even while other commodities push lower on global demand concerns, but the market proved us wrong on that assumption. The RBA stuck to a higher pace of tightening with a 50bsp hike in August, but it wasn’t enough to provide the AUD with upside as the bank mentioned their policy is not on a pre-determined path and also expressed growing concerns about consumers. While Iron Ore prices stays pressured and covid lockdowns in China persists, we maintain a neutral bias for the AUD.
POSSIBLE BULLISH SURPRISES
Positive Covid developments in China (easing restrictions, more fiscal or monetary support, or stopping their covid-zero policy) could trigger bullish reactions in the AUD. As a risk sensitive currency, catalysts that causes big bouts of risk on sentiment could trigger bullish reactions in the AUD. Any catalyst that triggers some recovery in Australia’s key commodity exports (China stimulus, lifting covid restrictions, new infrastructure projects in China, higher inflation fears) should be supportive for the AUD. With the RBA just getting started with their hiking cycle, there is scope for them to turn more aggressive, which means any overly hawkish comments or overly bullish CPI , or wage data could trigger some bullish reactions.
POSSIBLE BEARISH SURPRISES
Negative Covid developments in China (increasing restrictions or adding new ones) could trigger bearish reactions in the AUD and remains a course of concern. As a risk sensitive currency, catalysts that causes big bouts of risk off sentiment could trigger bearish reactions in the AUD. Any catalyst that triggers more downside in Australia’s key commodity exports (additional China restrictions, demand destruction fears, and additional news on recent centralized iron ore buyers) could be negative for the AUD. Concerns about consumers & growth means the RBA have been cautious to confirm STIR market expectations. If they ‘only’ hike by 50bsp without higher terminal rate forecasts we would expect the AUD to push lower out of the meeting.
BIGGER PICTURE
The outlook for the AUD is neutral for now, but that is largely dependent on what happens to China, whether key commodities like Iron Ore and Coal can stop their recent bleeding, and how long China struggles to recover their previously expected growth trajectory. Until the covid situation improves materially, and until commodities and China’s growth stabilizes, the AUD is best suited for short-term trades in line with strong short-term sentiment. Also keep in mind that the AUD is currently the most stretched among the other majors versus the US Dollar , so AUDUSD could be considered on any decent positive catalyst. With a 50bsp fully priced, without an overly hawkish RBA policy statement the AUD looks vulnerable to more downside.
NZD
FUNDAMENTAL OUTLOOK: NEUTRAL
BASELINE
Despite the RBNZ being one of the most hawkish central banks from 2021, it hasn’t been enough to provide any meaningful trending support for the NZD. The cyclical concerns for the global economy, alongside concerns from China regarding their struggles with their covid-zero policy as well as recent big falls in commodity prices has kept the NZD pressured. Even though the RBNZ is expecting to keep their hiking cycle intact as they proved at their August meeting, some mild economic concerns have been starting to show up in the recent data, something they alluded to in their statement as well by noting medterm downside risks for the economy. Consumer and business confidence from the start of the year has confirmed this view. Furthermore, a big focus for the RBNZ’s aggressive policy (apart from high inflation of course) has been to try and calm down a very hot housing market, and even though the fall is small we have seen YY house prices starting to cool down. These developments on the growth side are not expected to stop the RBNZ’s hiking cycle just yet, but some market participants are expecting a more dovish tone reflecting these concerns and a push back in hike expectations in the months ahead.
POSSIBLE BULLISH SURPRISES
Positive Covid developments in China (easing restrictions, more fiscal or monetary stimulus, or letting go of the covidzero policy) could trigger bullish reactions in the NZD. As a risk sensitive currency, and catalyst that causes big bouts of risk on sentiment could trigger bullish reactions in the NZD. Any catalyst that triggers some recovery in commodity markets (China stimulus, lifting covid restrictions, new infrastructure projects in China, higher inflation fears; lower growth concerns) should be supportive for the NZD. With a lot of tightening already priced for the RBNZ it would take a lot to surprise markets on the hawkish side, but with growing calls of a dovish pivot, reluctance from the RBNZ on that front could prove supportive in upcoming meetings.
POSSIBLE BEARISH SURPRISES
Negative Covid developments in China (increasing restrictions or adding additional ones) could trigger bearish reactions in the NZD. As a risk sensitive currency, and catalyst that causes big bouts of risk off sentiment could trigger bearish reactions in the NZD. Any catalyst that triggers more downside in commodity markets (additional China restrictions, demand destruction fears, further growth concerns) could weigh on the NZD. Since a lot of policy tightening has been priced into STIR markets, any negative catalysts that triggers less hawkish RBNZ expectations (faster deceleration in growth or inflation) could trigger downside for the NZD.
BIGGER PICTURE
The bigger picture outlook for the NZD is neutral for now, but that is largely dependent on what happens to China as the New Zealand economy is also very dependent on trade with China and Australia, and also dependent on whether the RNBZ sticks to their hawkish tone or pivots more dovish in the meetings ahead. Given the RBNZ’s current outlook, we would favour short-term opportunities in the NZD in line with short-term sentiment as opposed to med-term positions.
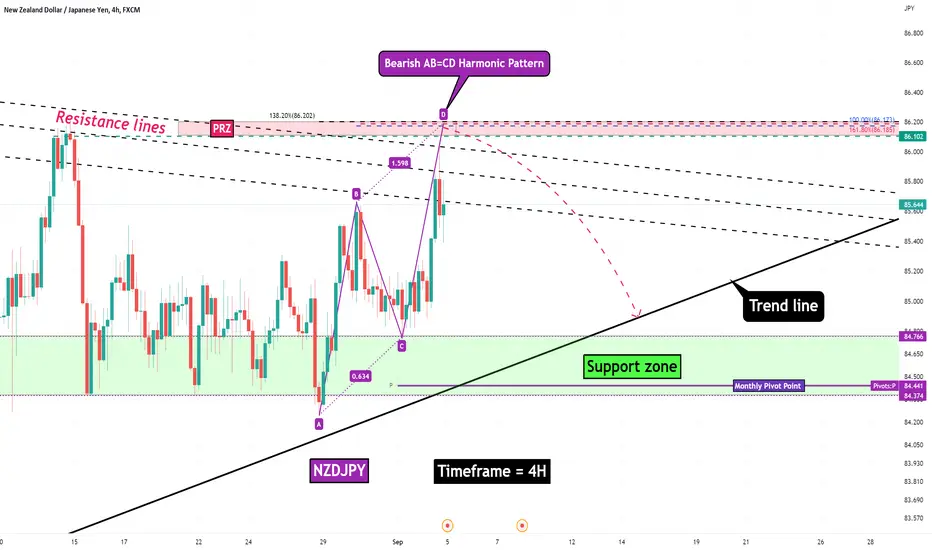
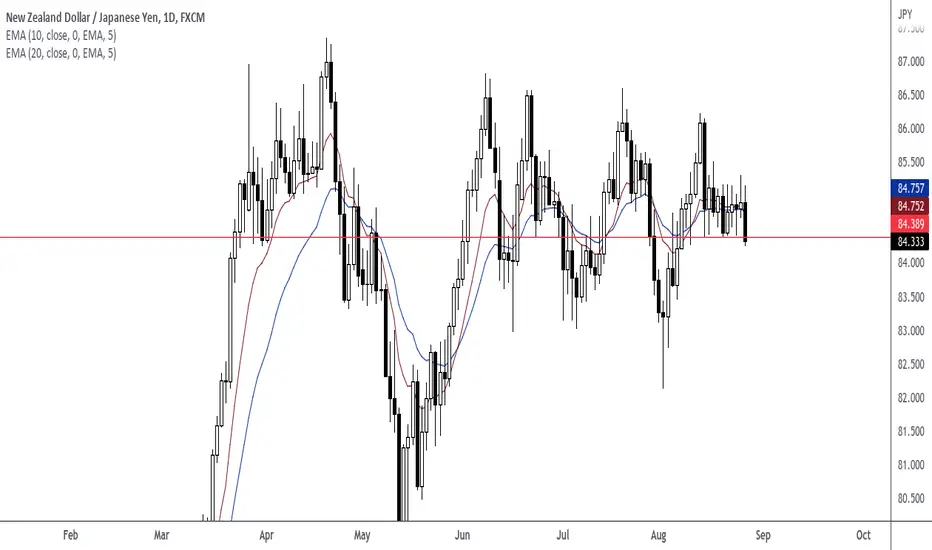
💵New Zealand Dollar/Japanese Yen 💵 Analyze(Short term)!!!New Zealand Dollar/Japanese Yen is running inside the resistance lines. Also, it can make a Bearish AB=CD Harmonic pattern in my PRZ(Price Reversal Zone).
I expect that New Zealand Dollar/Japanese Yen will go down at least to the Trend line and support zone.
🔅New Zealand Dollar/Japanese Yen Analyze (NZDJPY) Timeframe 4H⏰.
Do not forget to put Stop loss for your positions (For every position that you want to open).
Please follow your strategy, this is just my idea, and I will be glad to see your ideas in this post.
Please do not forget the ✅' like '✅ button 🙏😊 & Share it with your friends; thanks, and Trade safe.
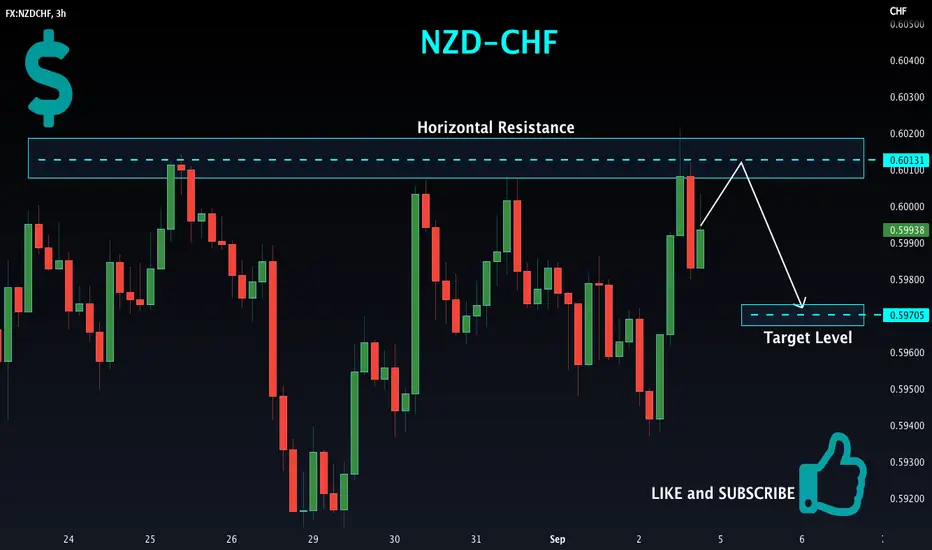
NZD-CHF Short From Resistance! Sell!
Hello,Traders!
NZD-CHF has retested a local
Horizontal resistance level
And we've already seen some
Bearish reaction so a further
Move down is possible
Sell!
Like, comment and subscribe to boost your trading!
See other ideas below too!
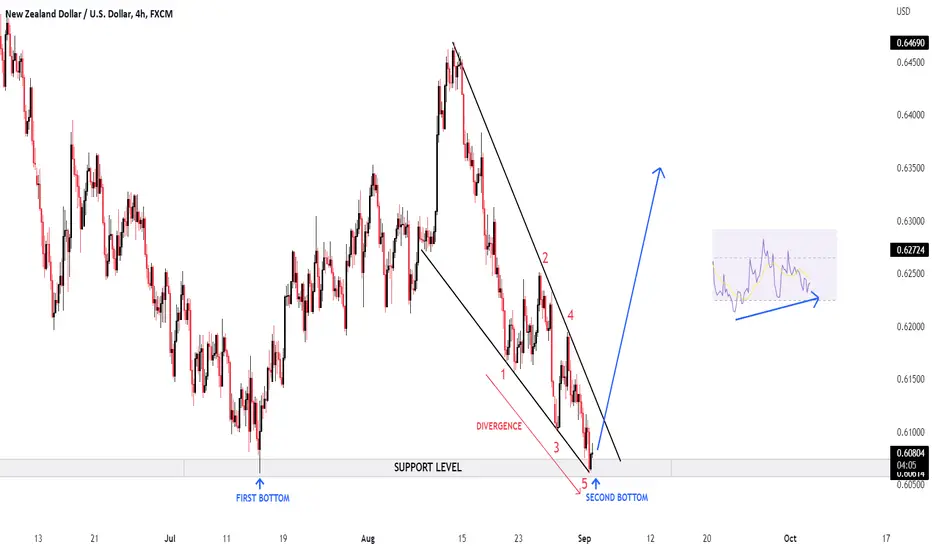
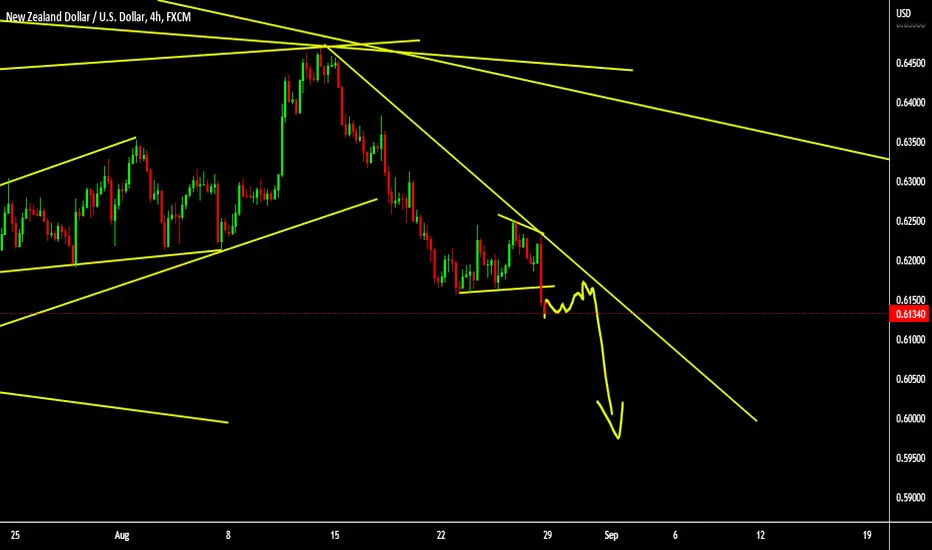
NZD/USD Next MoveTechnical Analysis Chart Update
NZD / USD ( New Zealand Dollar / U.S Dollar )
Time Frame - H1
FALLING WEDGE Pattern in Short Time Frame #STF and Rejection from the Lower Trend Line #LTL
Strong #SUPPORT Level
It is also Following #ELLIOT_WAVES in Short time Frame and it has completed the Impulsive waves will follow the Corrective Waves now
Strong Buying #Divergence in #RSI
DOUBLE BOTTOM Pattern in Long Time Frame #LTF
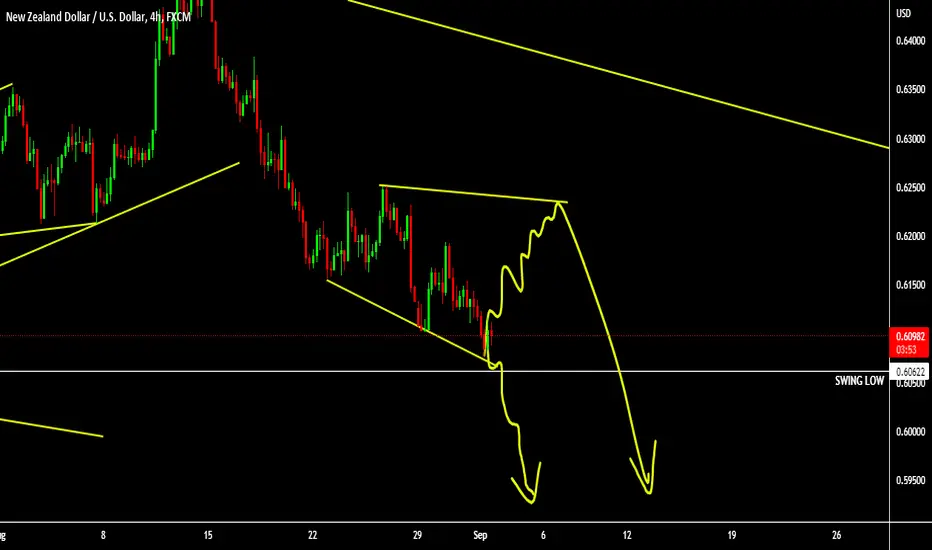
NZDUSD - 240 MINS CHARTThe Structure looks good to us, waiting for this instrument to correct and then give us these opportunities as shown on this instrument (Price Chart).
Note: its my view only and its for educational purpose only. only who has got knowledge about this strategy, will understand what to be done on this setup. its purely based on my technical analysis only (strategies). we don't focus on the short term moves, we look for only for Bullish or Bearish Impulsive moves on the setups after a good price action is formed as per the strategy. we never get into corrective moves. because it will test our patience and also it will be a bullish or a bearish trap. and try trade the big moves.
we do not get into bullish or bearish traps. we anticipate and get into only big bullish or bearish moves (Impulsive moves).
Just ride the bullish or bearish impulsive move. Learn & Know the Complete Market Cycle.
buy low and sell high concept. buy at cheaper price and sell at expensive price.
Keep it simple, keep it Unique.
please keep your comments useful & respectful.
Thanks for your support....
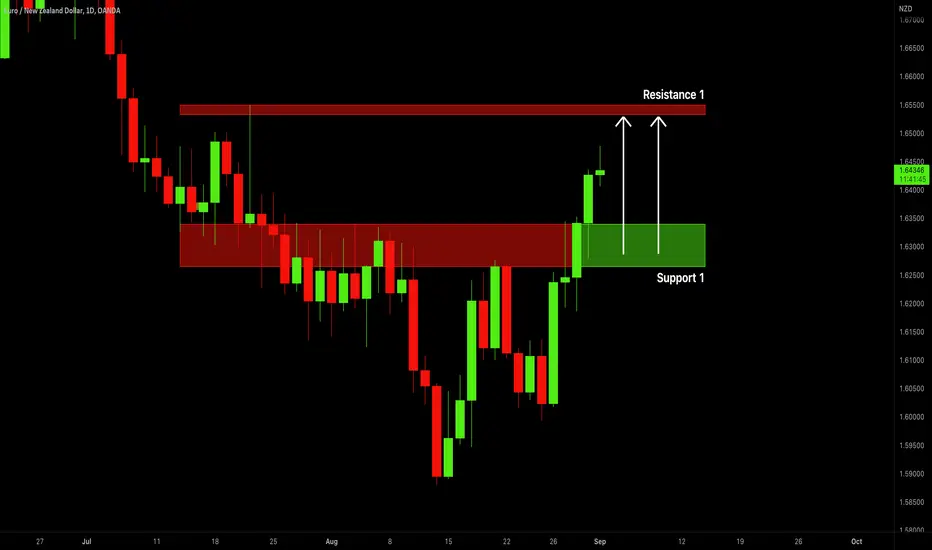
EURNZD: Confirmed Breakout 🇪🇺🇳🇿
EURNZD broke and closed above a key weekly supply zone.
The next goal for buyers is 1.655 resistance now.
Wait for an occasional retest of the broken structure to buy.
❤️If you have any questions, please, ask me in the comment section.
Please, support my work with like, thank you!❤️
NZDCHF About to break the 1D MA50 towards a new High.The NZDCHF pair has been trading within a long-term Channel Down pattern since the February 25 2021 High. The last Lower Low on the Channel took place on July 01 2022 and that Low was re-tested on August 29, which held, making the Support so far a Double Bottom.
The 3 day rebound is now testing again the 1D MA50 (blue trend-line) for the 4th time in the past 2 weeks with strong probabilities of breaking out not just due to the Double Bottom but also due to the 1D RSI and MACD indicators. Those show that the current rebound is similar to the one that started on February. A break above the 1D MA50 can kick start the new bullish leg to the Lower Highs (top) trend-line of the Channel Down. Moderate target would be the 1D MA200 (orange trend-line).
--------------------------------------------------------------------------------------------------------
** Please support this idea with your likes and comments, it is the best way to keep it relevant and support me. **
--------------------------------------------------------------------------------------------------------

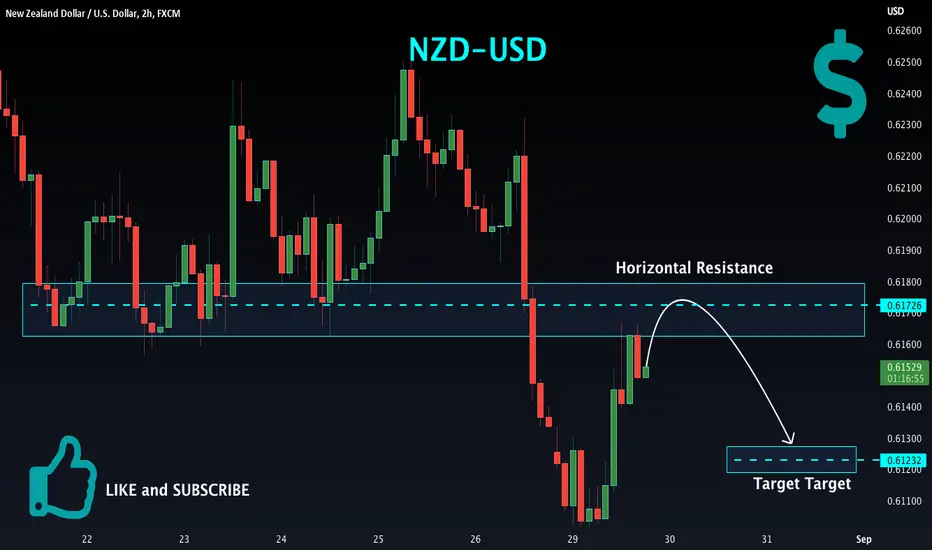
NZD-USD Local Short! Sell!
Hello,Traders!
NZD-USD went down just as I predicted
But is now retesting a local horizontal
Resistance level from where I will be
Expecting a local move down
Sell!
Like, comment and subscribe to boost your trading!
See other ideas below too!
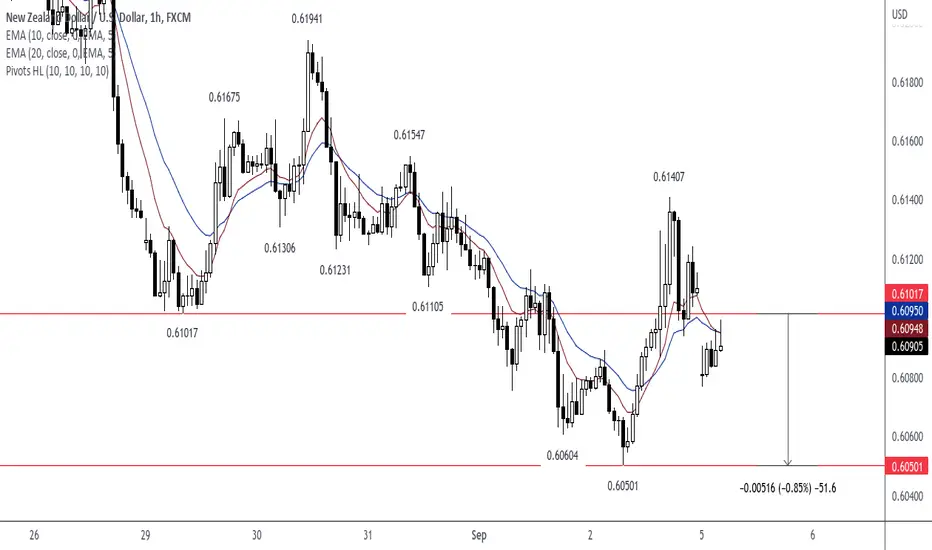
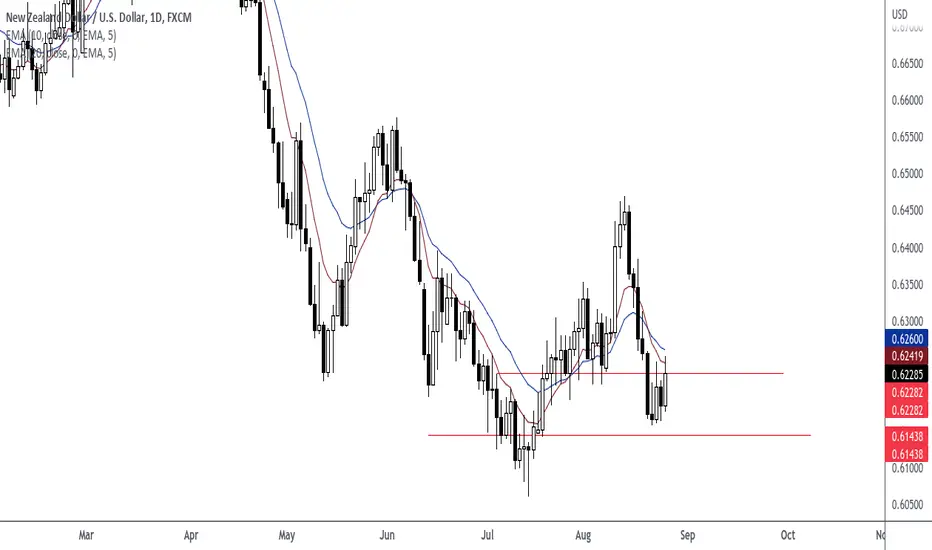
Pip Goal: 83.3 Pips (NZDUSD)First Entry Price: 0.62282
Second Entry Price: 0.61438
Watch for a pull back at 0.61438 for a short position. First, price needs to close below 0.61438. Next, price needs to retrace back to 0.61438 horizontal level.
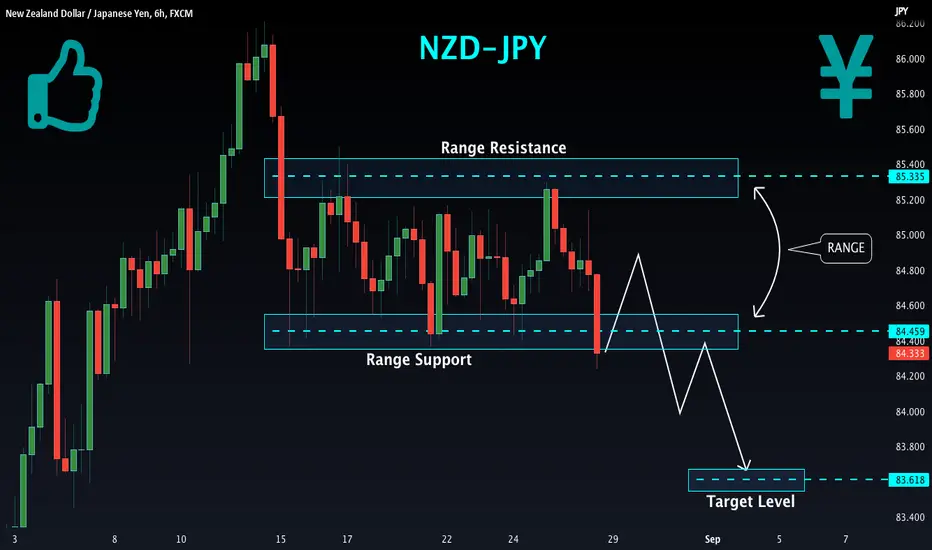
NZD-JPY Wait For Breakout! Sell!
Hello,Traders!
NZD-JPY is trading in in a range
And the recent price action is bearish
Because the pair seems to be trying to break
The support so we are watching it closely
And IF we see a bearish breakout of the range
Then the price will go further down
Sell!
Like, comment and subscribe to boost your trading!
See other ideas below too!
NZDUSD - 240 MINS CHARTThe Structure looks good to us, waiting for this instrument to correct and then give us these opportunities as shown on this instrument (Price Chart).
Note: its my view only and its for educational purpose only. only who has got knowledge in this strategy will understand what to be done on this setup. its purely based on my technical analysis only (strategies). we don't focus on the short term moves, we look for only for Bullish or Bearish Impulsive moves on the setups after a good price action is formed as per the strategy. we never get into corrective moves. because it will test our patience and also it will be a bullish or a bearish trap. and try trade the big moves.
we do not get into bullish or bearish traps. we anticipate and get into only big bullish or bearish moves (Impulsive moves).
Just ride the bullish or bearish impulsive move. Learn & Know the Complete Market Cycle.
buy low and sell high concept. buy at cheaper price and sell at expensive price.
Keep it simple, keep it Unique.
please keep your comments useful & respectful.
Thanks for your support....
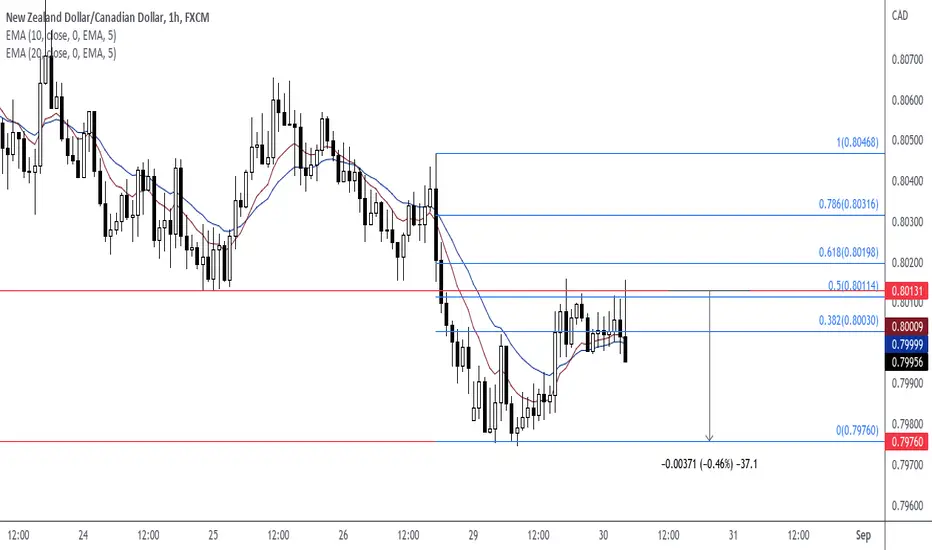
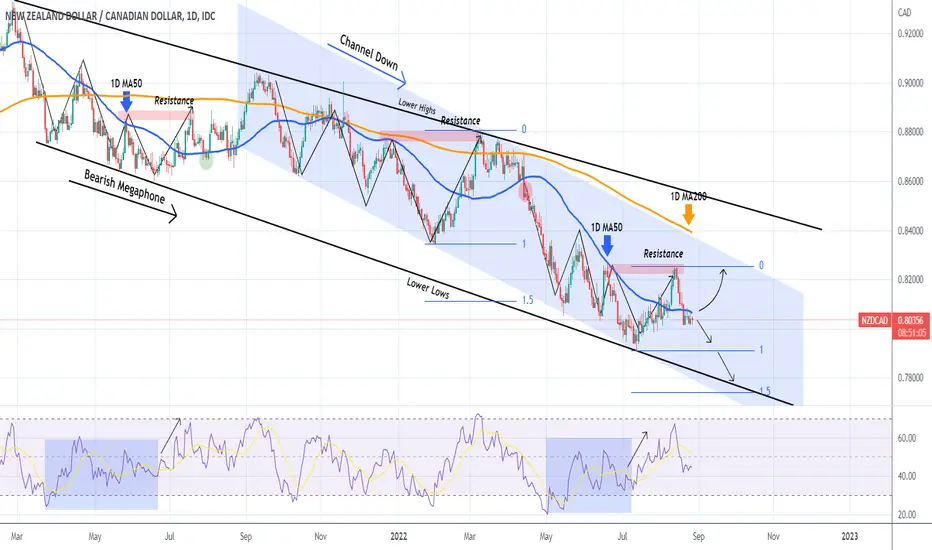
NZDCAD 1D MA50 is the key. Sell below, buy above.The NZDCAD pair has offered us an excellent pattern for a sell high/ buy low plan on our previous analysis more than two months ago:
As you see, we were successful on the sell exactly on the 1D MA50 (blue trend-line) rejection and the buy on the Lower Lows trend-line of both the Megaphone and Channel Down patterns.
Right now there is a conflict as to where we could be in relation to the prior formations. This may be a quick accumulation below the 1D MA50 similar to July 30 2021 (green circle) or a failure below the 1D MA50 similar to April 15 2022.
The 1D MA50 can give the solution to this. As long as 1D candles close below it, the action is a sell targeting first the 0.79100 Support and the 1.5 Fibonacci extension (0.7745) as part of a new Lower Low formation. A closing above the 1D MA50 though, should be taken as a bullish signal, targeting the 0.8250 Resistance and potentially the 1D MA200 (orange trend-line).
--------------------------------------------------------------------------------------------------------
** Please support this idea with your likes and comments, it is the best way to keep it relevant and support me. **
--------------------------------------------------------------------------------------------------------
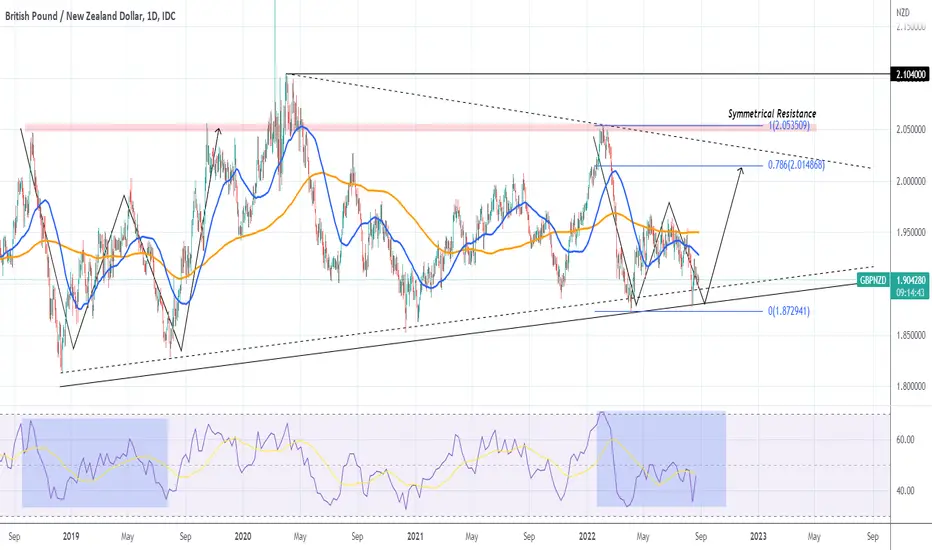
GBPNZD Excellent buy level for a rally to the end of the yearThe GBPNZD pair has been following exactly our trading plan since our last update a month ago, getting rejected on the 1D MA200 (orange trend-line) and hitting the Higher Lows zone of the long-term Triangle pattern that it has been trading in since the April 02 2020 High:
The initial rebound after the August 12 Low is seeing a pull-back in the last 10 days and that may be the perfect opportunity for those who missed it, to buy again. Our long-term target for the end of the year is just below the 0.786 Fibonacci retracement level at 2.010. Those who seek more risk, there is also the Symmetrical Resistance if the Triangle breaks to the upside.
--------------------------------------------------------------------------------------------------------
** Please support this idea with your likes and comments, it is the best way to keep it relevant and support me. **
--------------------------------------------------------------------------------------------------------
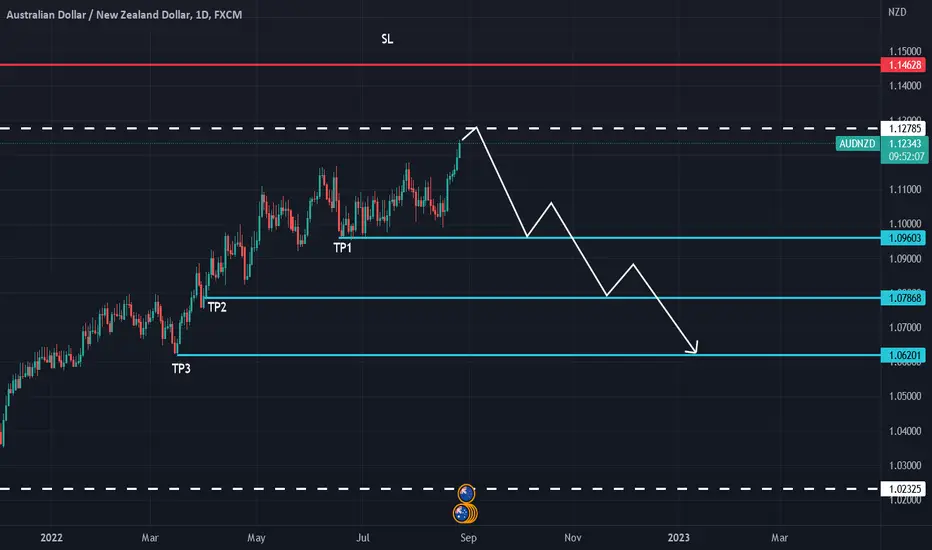
AUDNZD: Important Structure Breakout 🇦🇺🇳🇿
Important thing happened this night on AUDNZD pair:
the price broke and closed above a wide daily supply area.
The broken structure turned into a support now.
The next goal for buyers is the narrow area around 1.128 level.
It is based on a key monthly structure and 5 years' high.
I will be patiently waiting for an occasional retest of the broken structure to buy AUDNZD.
❤️If you have any questions, please, ask me in the comment section.
Please, support my work with like, thank you!❤️

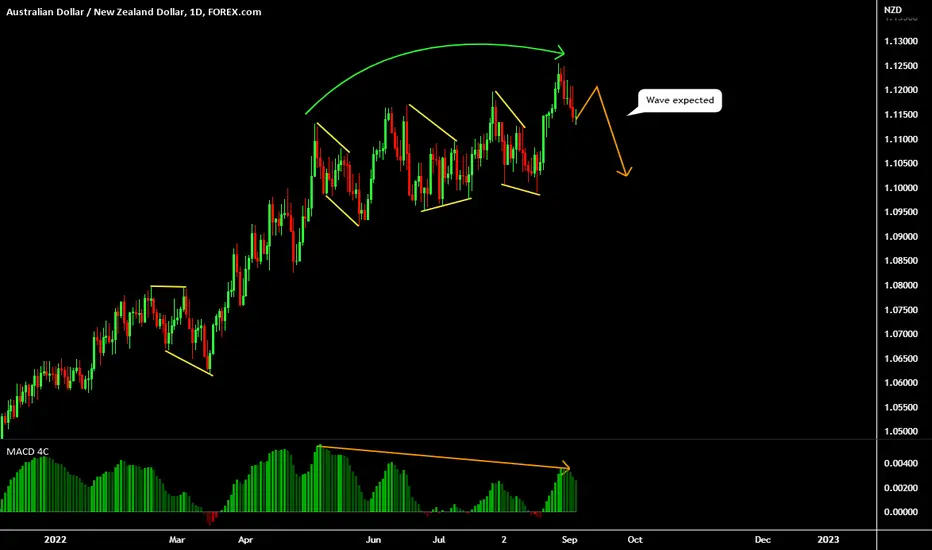
AUDNZD | ShortThe AUDNZD currency pair has moved in a very strong and long time side trend (about 9 years) and is currently approaching the ceiling of this side area, so the probability of the price return from this area is very high. .
Don't forget to place your stop loss outside the upper side line and at a relative distance.
GBP/NZD potential sell setup 260 PipsBasically structure is showing movement to downside. wait for the price to retrace before entering and confirming continuation with candlestick formation.
Show love by sharing and commenting. follow for more setup breakdown
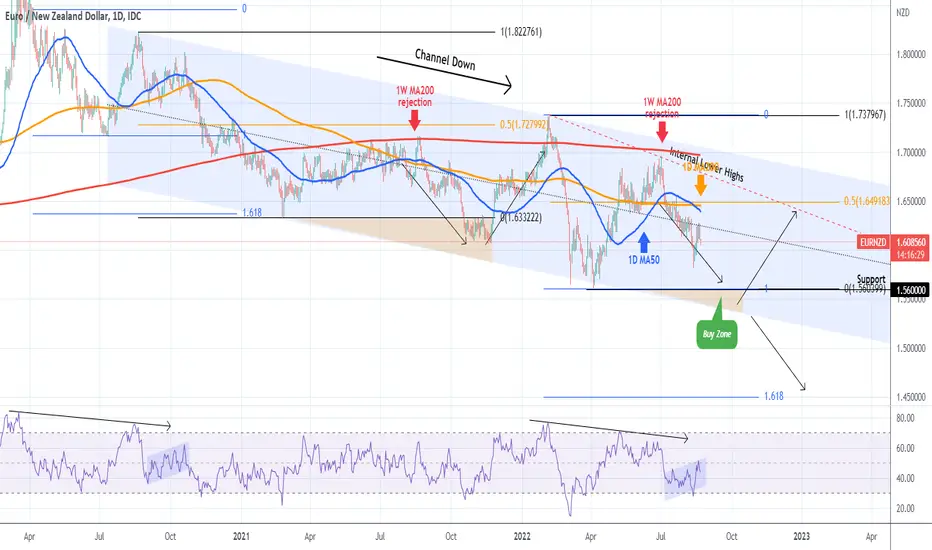
EURNZD remains a sell option below the 1D MA50The EURNZD pair continues trade on a bearish trend following our latest analysis last month. The price remains below both the 1D MA50 (blue trend-line) and the 1D MA200 (orange trend-line) and within the long-term pattern of the Channel Down since the August 20 2020 High, it is aiming for at least the 1.5600 Support.
The Buy Zone of the Channel Down is located right below the Support. A buy there offers an excellent Risk/ Reward ratio targeting the 0.5 Fibonacci retracement level (1.6491) but a break below the Channel Down, should see us taking the loss and shifting back to selling as based on the 2020 fractal, the price can go as low as the 1.618 Fib extension (1.4500).
--------------------------------------------------------------------------------------------------------
** Please support this idea with your likes and comments, it is the best way to keep it relevant and support me. **
--------------------------------------------------------------------------------------------------------
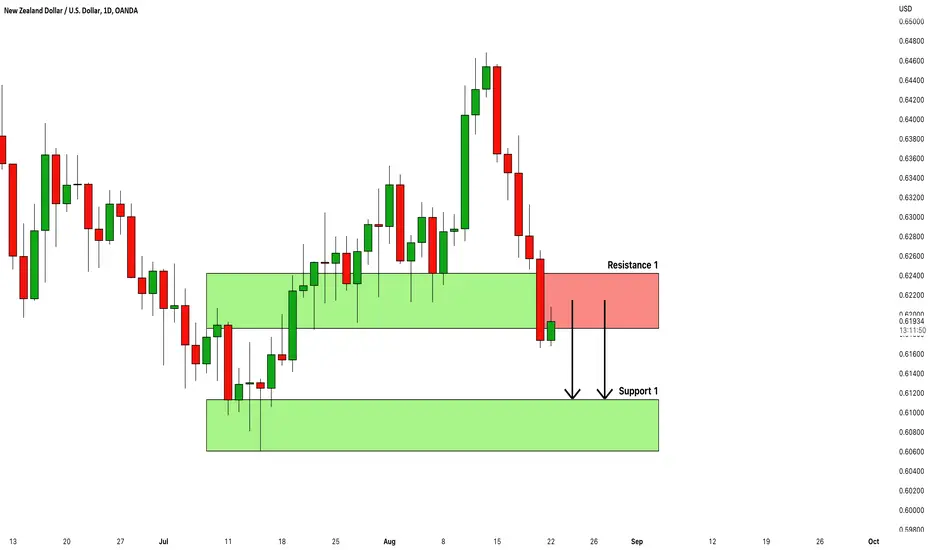
NZDUSD: Important Structure Breakout 🇳🇿🇺🇸
NZDUSD broke and closed below a wide demand area.
The broken structure turned into a supply zone now.
I will expect a bearish move from 0.6185 - 0.624 area.
Next support: 0.606 - 0.611
❤️If you have any questions, please, ask me in the comment section.
Please, support my work with like, thank you!❤️
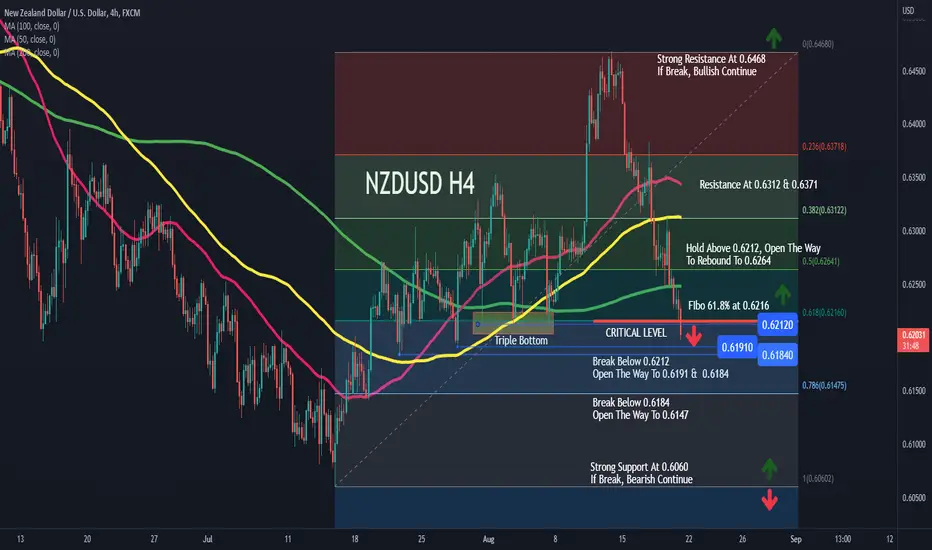
NZDUSD H4, BREAK CRITICAL POINT 0.6212 To 0.6191 & 0.6184NZDUSD Break critical level at 0.6212 and Fibo 61.8% at 0.6216.
Break Below 0.6212 then Open The Way To 0.6191 & 0.6184.
Break Below 0.6184, then Open The Way To 0.6147.
Strong Support At 0.6060. If Break, Bearish Continue.
But Hold Above 0.6212, Open The Way To Rebound To 0.6264.
Resistance At 0.6312 & 0.6371.
Strong Resistance At 0.6468, If Break, Bullish Continue.