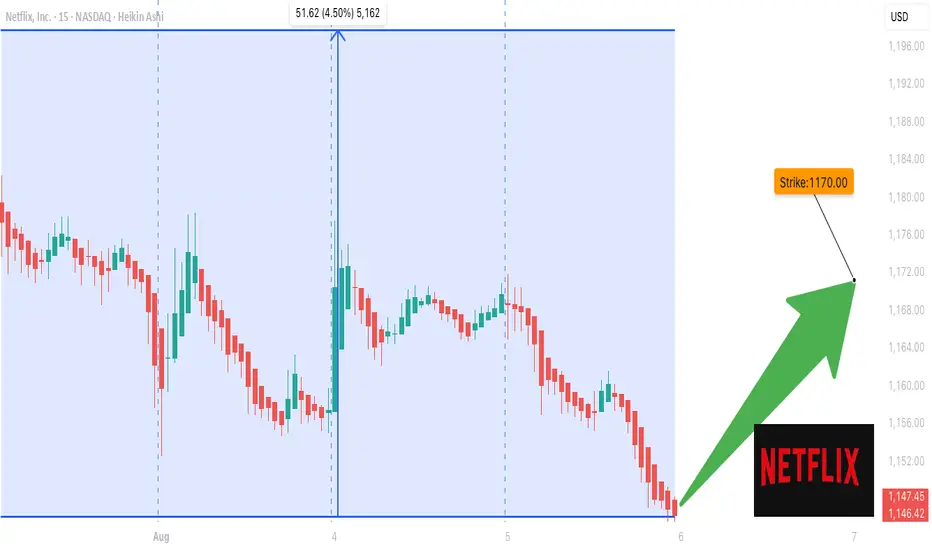
Netflix Options Flash Green – $1170 Target in Sight?
## 🚨 NFLX Options Alert: Quiet Volume, Loud Calls 🚨
**Earnings Loom, Institutions Lean Bullish** 💥
🔹 **Models Align:** 4 out of 5 models flash *Moderate Bullish*
🔹 **RSI**: Daily (35.6) cooling off, Weekly (56.1) still rising
🔹 **Call/Put Ratio**: 1.47 → Bullish positioning building
🔹 **VIX**: At 17.9, IV environment favors options buyers
🔹 **Volume Weakness**: Institution hesitation = key risk
### 📈 TRADE IDEA:
🎯 **NFLX \$1170 Call**
💵 Entry: \$11.80 | 🎯 Target: \$17.70 | 🛑 Stop: \$4.70
📆 Expiry: 2025-08-08 | ⚖️ Confidence: 65%
💡 *Enter at market open. Position size small. Event risk high.*
> “Volume is low, but flow is glowing.”
> Could this be *the* earnings week breakout?
---
### 🏷 Hashtags for Viral Reach:
`#NFLX #OptionsFlow #EarningsTrade #TechStocks #UnusualOptionsActivity #Netflix #TradingSignals #CallOptions #WeeklySetup #TradingViewIdeas`
Nflxtechnicalanalysis
NFLX Wait For Break Out Fibo Level
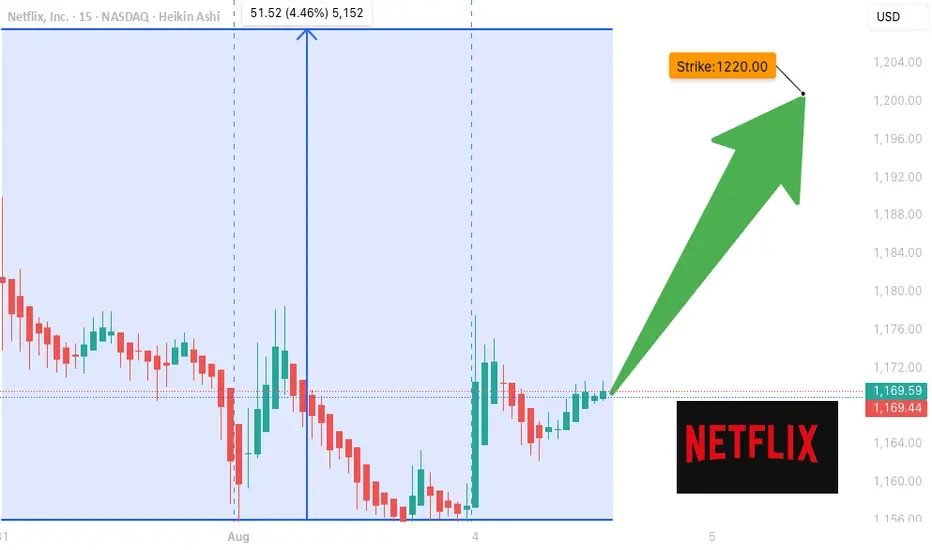
## 📈 \ NASDAQ:NFLX WEEKLY TRADE IDEA (AUG 5–9)
**🔥 BULLISH FLOW | CALL/PUT RATIO: 1.84 | CONFIDENCE: 65%**
---
### 🧠 AI-DRIVEN SENTIMENT
* **Weekly RSI**: 54.9 ✅ (Bullish Momentum)
* **Daily RSI**: 38.4 ↗️ (Climbing but still weak)
* **Volume**: 📉 0.7x last week = Low institutional follow-through
* **Options Flow**: Massive call buying = Institutions lean bullish
* **Volatility**: VIX at 18.2 = Option-friendly zone
---
### 🛠️ TRADE SETUP
| 🔹 | Trade Type | Long Call |
| -- | --------------- | ------------------- |
| 🎯 | **Strike** | **\$1200** |
| 📅 | **Expiry** | **Aug 8 (Fri)** |
| 💵 | **Entry** | **\$4.05** |
| 📈 | **Target** | **\$6.00 – \$8.00** |
| 🛑 | **Stop** | **\$2.50** |
| 🔐 | **Size** | 1 contract |
| ⚖️ | **Risk/Reward** | \~1:2 |
---
### ⚠️ RISK CHECK
* 🔸 Daily RSI still < 45 — needs breakout for full confirmation
* 🔸 Volume not convincing — watch for fakeouts
* 🔸 Short expiry = 🔥 gamma risk
---
### 🧩 STRATEGY INSIGHT
> "Call buyers are in. RSI is rising. But volume is soft. You’re early — not late."
🎯 Enter @ Open
🚀 Target quick momentum pop
👀 Exit if RSI fails to break or macro hits
---
💬 **Plan to enter?** Comment “IN”
🔁 Repost if you're tracking NFLX
📊 Follow for more AI-synced trades
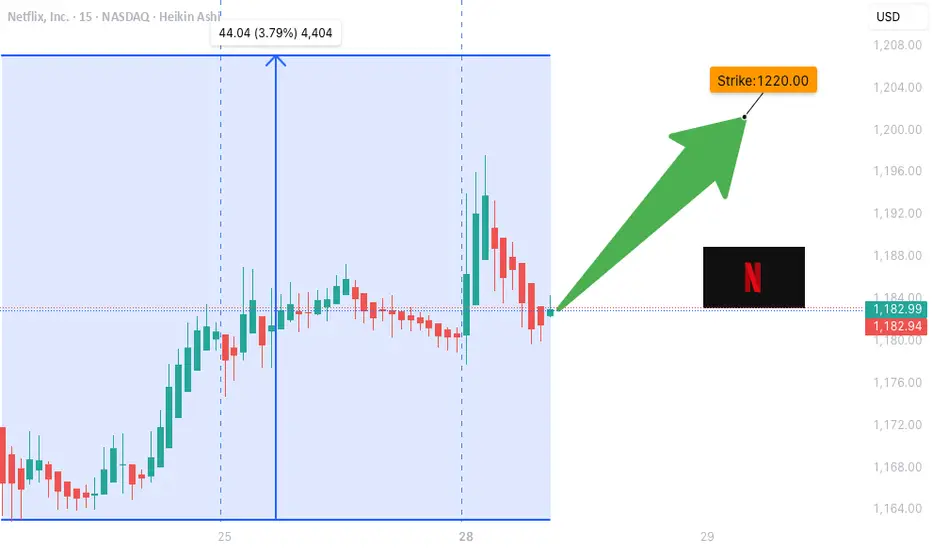
NFLX WEEKLY OPTIONS TRADE (07/28/2025)**🎬 NFLX WEEKLY OPTIONS TRADE (07/28/2025) 🎬**
**Institutions Are Buying Calls – Should You?**
---
📈 **Momentum Breakdown:**
* **Daily RSI:** Mixed ➡️ Possible short-term weakness
* **Weekly RSI:** Bullish bias intact ✅
🔥 Overall = **Moderate Bullish** trend confirmed on the **weekly timeframe**
📊 **Options Flow:**
* **Call/Put Ratio:** **2.23** 🚨
💼 Strong institutional call flow = **bullish bias** from big money
* **Strike Ideas from Models:**
* \$1260 (Grok/xAI)
* \$1230 (Gemini/Google)
* \$1220 (Meta)
* ✅ **\$1200** (Consensus Strike)
🧨 **Volume Warning:**
* 📉 Institutional participation is **lower than average**
* 🚫 Could signal weak follow-through or fading interest
---
🧠 **AI Model Consensus (Grok / Gemini / Claude / Meta / DeepSeek):**
✅ Call buying favored across the board
✅ Weekly bullish momentum confirmed
⚠️ Daily RSI & low volume = headwinds
📌 Play it smart: momentum’s real, but conviction isn’t maxed
---
💥 **RECOMMENDED TRADE (65% Confidence):**
🎯 **Play:** Buy CALL Option
* **Strike:** \$1200
* **Expiry:** 2025-08-01
* **Entry:** \~\$8.50
* **Profit Target:** \$16.00 → \$17.00
* **Stop Loss:** \$5.10
📆 Entry Timing: Monday market open
📏 Position Size: Risk-managed (2-4% portfolio)
---
⚠️ **RISK CHECKLIST:**
* 🟡 **Volume Fragility:** Institutions not fully loading
* 🟥 **Gamma Risk:** Expiry this week = possible sharp swings
* 🔴 **Daily RSI Divergence:** Short-term weakness still possible
---
📌 **TRADE DETAILS (JSON Format for Automation):**
```json
{
"instrument": "NFLX",
"direction": "call",
"strike": 1200.0,
"expiry": "2025-08-01",
"confidence": 0.65,
"profit_target": 16.00,
"stop_loss": 5.10,
"size": 1,
"entry_price": 8.50,
"entry_timing": "open",
"signal_publish_time": "2025-08-01 09:30:00 UTC-04:00"
}
```
---
**TL;DR:**
🟢 Weekly bullish setup with strong options flow
🟡 Daily weakness = proceed with discipline
🎯 \ NASDAQ:NFLX \$1200C for short-term momentum upside
💬 Are you following the institutions or fading the low volume?
\#NFLX #OptionsFlow #AITrading #WeeklySetup #InstitutionalMoney #TechStocks #UnusualOptionsActivity #TradingView #MomentumTrading
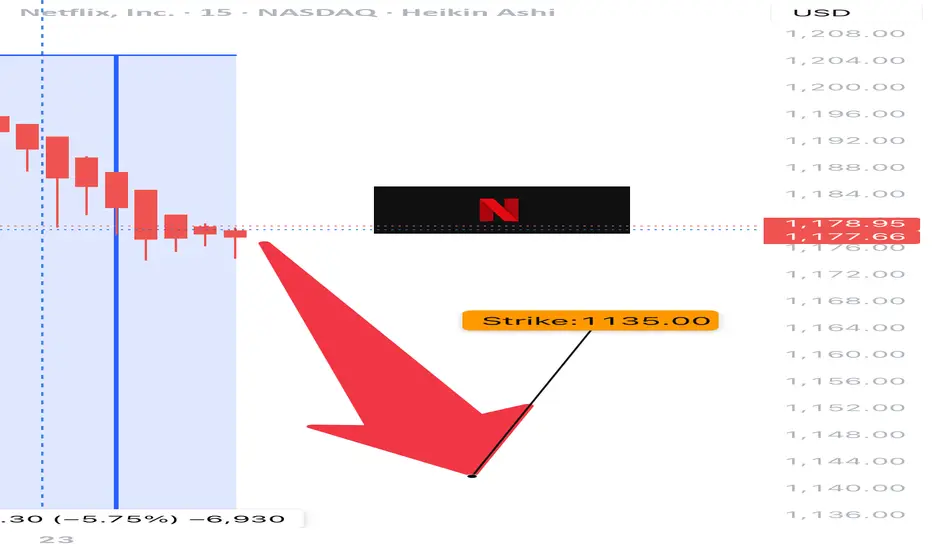
NFLX WEEKLY BEARISH PLAY — 07/23/2025
📉 NFLX WEEKLY BEARISH PLAY — 07/23/2025
🧠 Multi-model AI Consensus Trade Setup
⸻
🔍 QUICK SUMMARY
After reviewing 5 AI model reports (Grok, Gemini, Claude, Meta, DeepSeek), the consensus is moderate bearish for NFLX this week following heavy institutional selling and post-earnings weakness.
💣 Key Reason:
All reports cite declining daily RSI, strong institutional outflows, and mixed-to-bearish volume trends. Despite some caution, the majority lean bearish.
⸻
🎯 TRADE IDEA (WEEKLY PUT PLAY)
{
"instrument": "NFLX",
"direction": "PUT",
"strike": 1135,
"entry_price": 0.77,
"profit_target": 1.50,
"stop_loss": 0.41,
"expiry": "2025-07-25",
"confidence": 70%,
"entry_timing": "Open",
"size": 1 contract
}
⸻
📊 TRADE PLAN
🔹 🔸
🎯 Strike 1135 PUT
💵 Entry Price 0.77
🎯 Target 1.50 (approx. 95% upside)
🛑 Stop Loss 0.41
📅 Expiry July 25, 2025 (2DTE)
📈 Confidence 70%
⏰ Entry Market Open
🧠 Gamma Risk High (be nimble!)
⸻
🧠 Model Summary
• Gemini/Google: 🔻 Strong SELL — Institutional unload, 85% confidence
• Grok/xAI: ⚠️ NO TRADE — mixed signals
• Claude/Anthropic: ⚠️ NO TRADE — high sell volume, but conflicting indicators
• Meta/LLaMA: 🔻 Moderate Bearish — suggests 1175P but supports this setup
• DeepSeek: 🔻 Bearish lean — supports 1135P w/ caution on gamma/time decay
⸻
🚨 NOTES
• 🕒 Only 2DTE — expect volatility + fast decay
• 🔍 Watch price action into open + first 30 mins
• 📉 If NASDAQ:NFLX cracks below $1130 support zone, this setup could fly
⸻
💬 Drop a ⚠️ if you’re watching
💣 Drop a 🔻 if you’re in this PUT
📈 #OptionsTrading #NFLX #WeeklyTrade #AITradeAlert #MemeStocks #PutOptions #ShortSetup
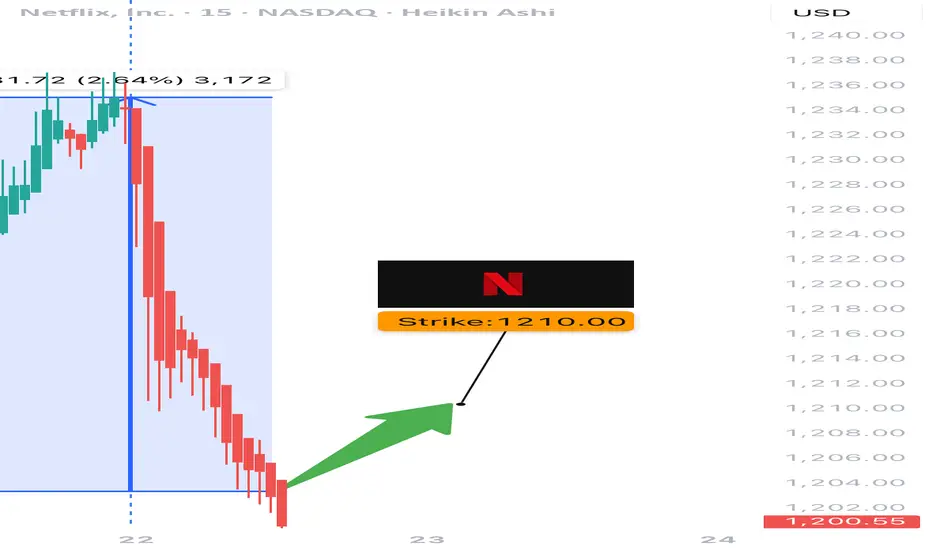
$NFLX Weekly Call Setup – 07/22/25
🚀 NASDAQ:NFLX Weekly Call Setup – 07/22/25
Volume Surge 📈 | RSI Bullish ✅ | Options Flow Mixed 🔁 | 3DTE Lotto Play 🎯
⸻
📊 Market Snapshot
• Price: $1203.16
• Call/Put Ratio: 1.01 → ⚖️ Neutral
• Weekly RSI: ✅ 63.2 (Momentum confirmed)
• Volume Surge: 📈 1.6x previous week
• Gamma Risk: ⚠️ Moderate
• DTE: 3 (Theta decay accelerating)
⸻
🧠 Trade Setup
{
"Instrument": "NFLX",
"Direction": "CALL",
"Strike": 1210.00,
"Entry": 24.10,
"Profit Target": 7.00,
"Stop Loss": 12.00,
"Expiry": "2025-07-25",
"Confidence": 0.65,
"Size": 1,
"Entry Timing": "Open"
}
⸻
🔎 Sentiment Breakdown
Indicator Status
📈 Weekly RSI ✅ Bullish confirmation
📉 Daily RSI ⚠️ Flat – no momentum edge
🔊 Volume ✅ Surge (1.6x baseline)
🔁 Options Flow ⚖️ Neutral (C/P = 1.01)
💨 VIX ✅ Favorable for calls
📰 News Risk ❌ Downgrade noise = volatility
⸻
📍 Chart Zones to Watch
• Support: $1198
• Breakout Trigger: $1210
• Resistance Targets: $1220 → $1250
• ⚠️ Key Watch: Gamma acceleration if $1210 breaks with volume
⸻
🎯 Viral Caption / Hook (for TV/X/Discord):
“ NASDAQ:NFLX 1210C is riding a volume rocket. RSI says go — options flow says maybe. Gamma vs. downgrade risk. 3DTE = Lotto edge or fade?”
💵 Entry: $24.10 | 🎯 Target: +30–50% | 📉 Stop: $12.00 | ⚖️ Confidence: 65%
⸻
⚠️ Best For:
• 📊 Breakout traders riding weekly momentum
• 🚀 Volume chasers following RSI confirmation
• ⏳ Scalpers with a handle on 3DTE gamma dynamics
⸻
💬 Want a debit spread alternative (e.g., 1200/1225)? A theta-scalped condor? Or 0DTE lotto scalp?
Drop a comment!!!
NFLX 1W Is the price of $860 per share real in the near future?Today, we will write down our expectations regarding the value of Netflix shares in the future, as well as a little bit tackle of the history of the company's development.
If you love reading business literature to inspire yourself for future achievements, then we strongly recommend that you read the story of "getting on your feet" once a small company Netflix that has been renting and selling VSH cassettes and DVDs by mail since 1997.
One year after founding, the owners stopped selling VSH and DVDs to focus on the initial idea of renting discs and cassettes.
Their entire history is based on the "super flexibility" of executives who sensed the future trend of their market and acted ahead of the curve.
Here's an example of how a small then Netflix beat the giant of their segment — Blockbuster
The heyday of Blockbuster dates back to 2004, when the company employed about 60 thousand people, and the company owned 9 thousand points of rent and stores. In the late 2000s, Blockbuster faced strong competition from online video service Netflix and filed for bankruptcy in 2010.
Meanwhile, Netflix has expanded its business since 2007 by introducing online media streaming, while not closing the DVD and Blu-ray rentals.
Since 2010, the company has expanded from the United States and expanded internationally.
And since 2013, Netflix has entered the industry of its own content with the debut of its first series.
Now, there are plenty of competitors to Netflix, and we all know them and use their services, but the price of NFLX shares confirms their strength in the market.
If you narrow the chart, you will see that the NFLX share price has been moving in a dynamic channel upward since 2004.
In 2012, the share price bounced off the lower boundary of the channel and t he $8 mark and began an upward trend that continues to this day.
In February-March 2020, when the entire market fell by 30-35%, or even more, NFLX shares fell in value only by -26%
However, the CoviD crisis was good for the company. Everyone sitted home and bought subscriptions to their services, and Netflix's stock doubled.
In fact, for the last 12 months, the price of NFLX shares has been in consolidation in the corridor of $475-575
Trading volumes are decreasing, which means that in the near future, the price will have a strong impulse.
There is a high probability that the momentum will be up , the price will break up and consolidate above $575 , and the next target from above will be $860 per NFLX share.
An alternative scenario is a fall in the NFLX price to the $275-325 zone. This scenario will activate when the price breaks and consolidates below $475 , and the first bell that it is worth refraining from longs will be the price approaching $500.

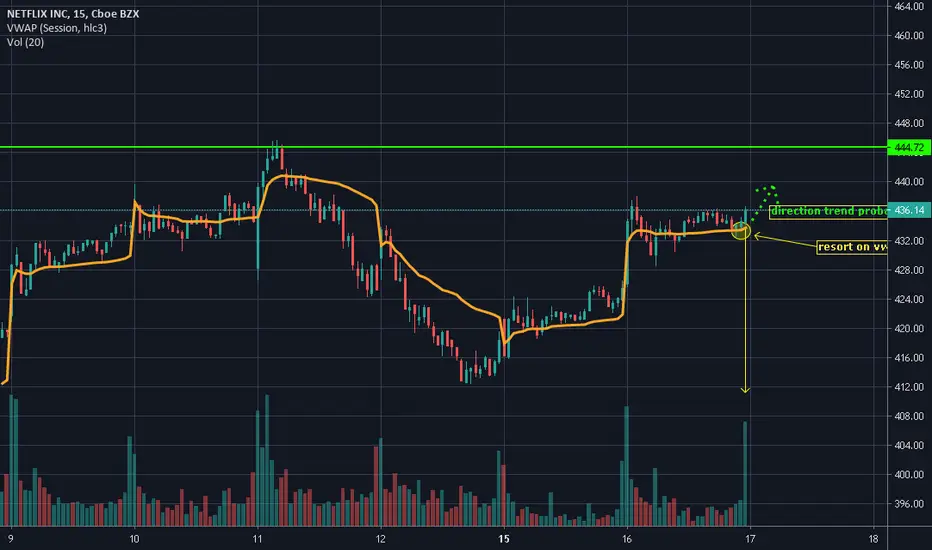
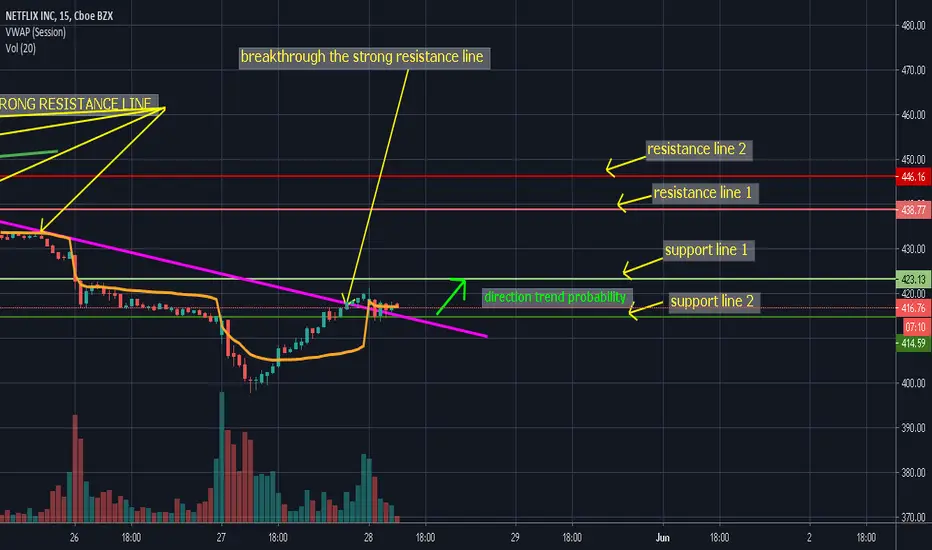
NFLX: ANALYSE, ORDER: BUYafter all i notice on the chart high probability to the trend go up to test the resistance line 1

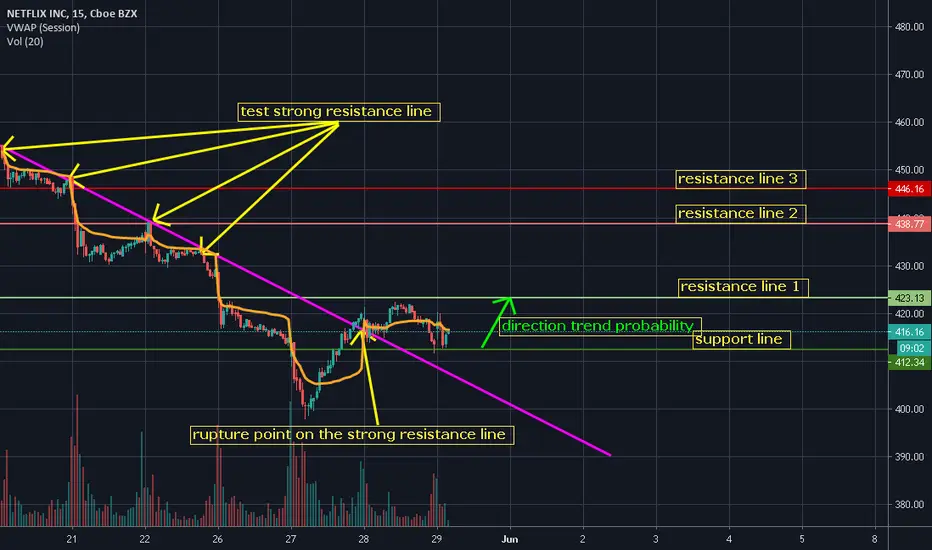
ANALYSE: NFLXafter rupture the strong resistance line
go up to test resistance line 1
go down to test the support line
---------------------------------------------------
the probability to trend go up to test the resistance line 1
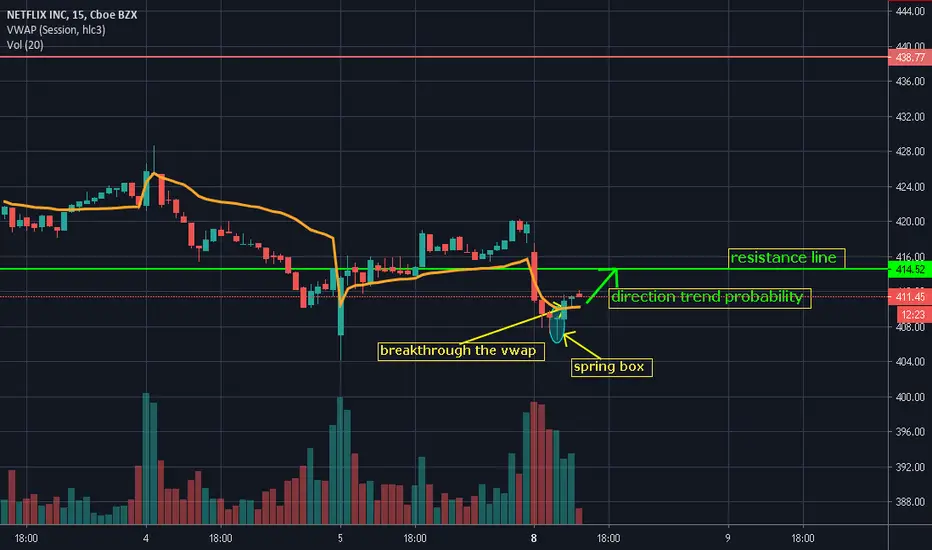
NFLX: ANALYSEafter a breakthrough the strong resistance line high probability to the trend go up to the support line 1
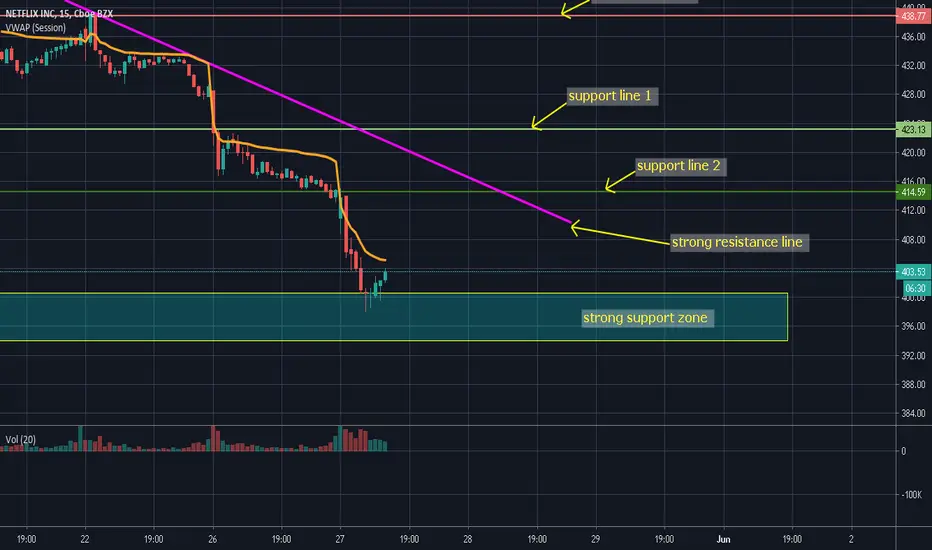
ORDER: BUYThis STRONG SUPPORT ZONE was a breakthrough on the 14th of April, towards the top, and it was retested on the 29th of April. The trend did not breakthrough it towards it, but it made a strong ascending to the top. This indicates that it is a strong area and a high probability that it will be the beginning of a corrective movement towards the top.
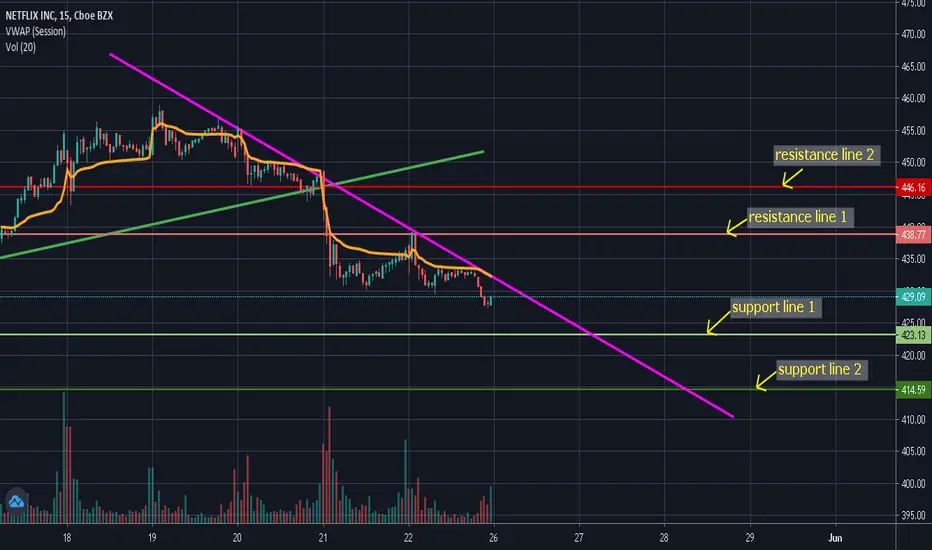
ANALYSE: NFLXWe notice that since May 19th there has been a gradual depression of the curve
There is a high probability that it will climb to touch and test the curved resistance line and descend to the support line 1
After that, there are two possibilities that either it completes the descending and breaches the support line 1 to reach the support line 2 or does the cumulation and returns to the curved resistance line test
NFLX stock price prediction trend analysis by pretiming28-Jun NASDAQ:NFLX
Price forecast timing analysis based on pretiming algorithm of Supply-Demand(S&D) strength.
Investing position about Supply-Demand(S&D) strength: In Falling section of high risk & low profit
Supply-Demand(S&D) strength Trend Analysis: In the midst of a downward trend of strong downward momentum price flow marked by temporary rises and strong falls.
Today's S&D strength Flow: Supply-Demand strength has changed from a weak selling flow to a suddenly strengthening selling flow.
read more: www.pretiming.com
D+1 Candlestick Color forecast: RED Candlestick
%D+1 Range forecast: 0.3% (HIGH) ~ -2.6% (LOW), -1.8% (CLOSE)
%AVG in case of rising: 2.2% (HIGH) ~ -0.8% (LOW), 1.4% (CLOSE)
%AVG in case of falling: 0.9% (HIGH) ~ -2.1% (LOW), -1.5% (CLOSE)
