EURUSD – Retest in Play After NFP Reversal?EURUSD started last week with a heavy bearish tone, dropping 200 pips on Monday alone — which is quite a move for such a typically stable pair.
After a brief consolidation around the neckline support of the recent double top, sellers came back in, pushing the pair down to 1.1400 by Friday — a level I highlighted in my previous analysis.
But then came NFP...
The weak jobs data triggered a sharp bullish reversal, and the euro took off like a rocket.
By the weekly close, the pair had rallied all the way back to the neckline zone, now acting as potential resistance.
________________________________________
🔍 Technical Outlook:
This area around 1.1550–1.1590 could now serve as a retest of the broken structure.
• 🔽 A rejection here, followed by a break back below 1.1500, would confirm the bearish scenario and open the door for a move toward 1.1200, the next major support.
• 📌 On the flip side, a sustained move above the neckline would invalidate the double top — and put bulls back in control.
________________________________________
Conclusion:
Watching for sell signals around the neckline makes technical sense — but confirmation is key.
The reaction early this week will likely set the tone for the next major swing.
Disclosure: I am part of TradeNation's Influencer program and receive a monthly fee for using their TradingView charts in my analyses and educational articles.
Nfp

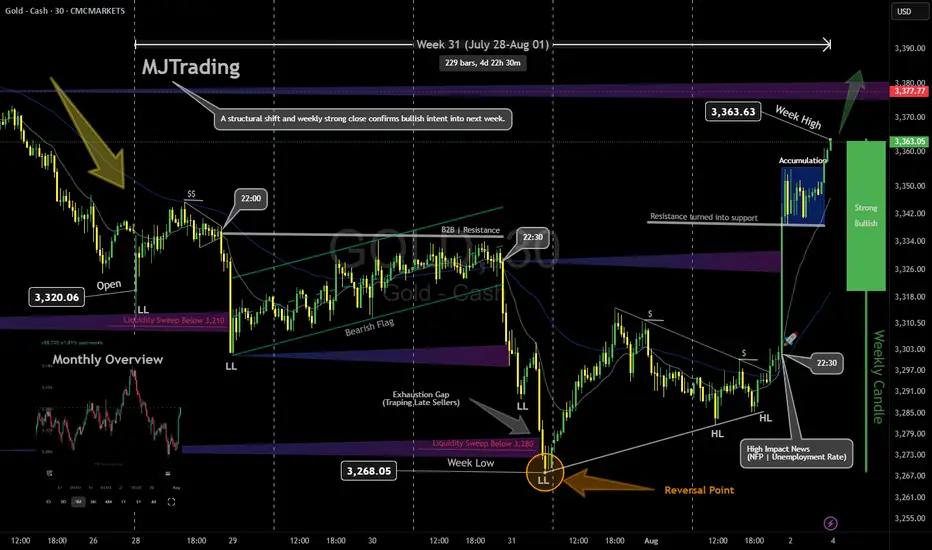
GOLD Weekly Recap & Outlook (Week 31 | July 28 – Aug 01)Note: Some elements may shift depending on your screen size. View the full snapshot in perfect layout:
📈 CAPITALCOM:GOLD
Timeframe: 30m | MJTrading View
⸻
🔹 Weekly Performance
• Open: 3,320.06
• High: 3,363.63
• Low: 3,268.05
• Close: 3,363.05
Gold delivered a classic Smart Money move this week: liquidity sweep, structural shift, and bullish expansion.
⸻
🔹 Price Action Breakdown
1️⃣ Early Week: Bearish Continuation
• Price opened around 3,320 with a gap and extended last week’s bearish leg.
• Formed lower lows (LL) and a bearish flag, signaling continuation.
2️⃣Midweek: Liquidity Grab, Reversal Point and
• Last Bearish leg marks the exhaustion gap and stop run.
• Market printed a liquidity sweep below 3,310 then 3,280 (weekly low), trapping late sellers.
• Smart Money likely absorbed sell-side liquidity before initiating the reversal leg.
• This aligns perfectly with SMC principles: sweep → accumulation → expansion.
3️⃣ Late Week Rally
• Following NFP & Unemployment Rate news, price broke 3,333 and rallied strongly to 3,363.63 confirming a Bullish Market Structure Shift (MSS).
• Resistance turned into support, validating the accumulation phase.
• Price rallied strongly to 3,363.63,.
• The weekly candle flipped bullish, closing near the high, with Smart Money leaving a clear footprint of accumulation and expansion.
⸻
🎯 Key Levels & Outlook
• Support: 3,355 → 3,333 - 3,340
• Resistance: 3,377 → 3,380+
• Bias: Bullish above 3,333.
• Watch for liquidity sweeps of intraday lows to catch new long entries, targeting 3420-3440.
⸻
💡 MJTrading View:
A structural shift and weekly strong close confirms bullish intent into next week.
As long as 3,333 holds, dips are buying opportunities.
⸻
Please share your opinions...
#MJTrading #GoldAnalysis #SmartMoney #LiquiditySweep #PriceAction #MarketStructure #Forex #TradingView #ChartDesigner #BullishMarket
Fortnight Overview:
Psychology Always Matters:
What to trade if you can't trust jobs data? U.S. President Donald Trump has dismissed the head of the Bureau of Labor Statistics (BLS), reportedly in response to jobs figures he disagreed with.
This raises concerns about the integrity of government-reported economic data, especially ahead of the next key Non-Farm Payrolls (NFP) release on September 5.
This upcoming report also includes the BLS’s annual revision, adjusting past job growth figures from April 2024 through March 2025. Goldman Sachs “estimate a downward revision on the order of 550,000 to 950,000 jobs—or a reduction of 45,000 to 80,000 jobs per month over the April 2024 to March 2025 period.”
Given macro uncertainty and signs of distrust in U.S. economic data, the bid for gold may persist.
Gold has rebounded sharply in recent sessions, breaking a short-term downtrend and climbing back above the 3,360 level. Price has now retraced more than 50.0% of the July 24–31 selloff. The pair may be Short-term bullish, if price holds above 3,310.

Australia inflation gauge hits 20-month high, Aussie gains grounThe Australian dollar has extended its gains on Monday. In the North American session, AUD/USD is trading at 0.6483 up 0.22% on the day. The US dollar made inroads last week against all the major currencies except the yen and gained 1.5% against the Australian dollar.
Australia's Melbourne Institute inflation guage soared 0.9% m/m in July, up sharply from 0.1% in June and marking the highest rise since Dec. 2023. The MI gauge, which provides a monthly guide to consumer inflation (official CPI is published quarterly), will no doubt raise concerns at the Reserve Bank of Australia, which has been cautious about cutting rates due to inflation worries.
Last week, CPI for the second quarter eased to 1.9%, down from 2.2% in Q1 and just below the central bank's target of 2%-3%. This cements a rate cut at the Aug. 12 meeting, after the RBA shocked the markets last month when it held rates. The markets had widely priced in a rate cut but the RBA defended its non-move, saying it wanted to see additional inflation data.
The week ended with a softer-than-expected US employment report. Nonfarm payrolls for July rose by only 73 thousand, missing the market estimate of 110 thousand. Adding to the bad news, the June and May reports were both revised sharply lower, down by a combined 258 thousand. The unemployment rate ticked higher to 4.2%, up from 4.1%.
The weak July reading and the downward revisions indicate that the labor market may be cooling more quickly than initially anticipated. The weak numbers support the case for the Fed to lower interest rates at the next rate meeting in September. The likelihood of a cut has climbed to 75%, compared to 63% on Thursday.
The soft jobs report should serve as a wake-up call regarding the effect of US tariffs on the economy, as the employment picture is worse than previously thought.

XAUUSD - Will Gold Continue to Rise?!Gold is trading above the EMA200 and EMA50 on the 4-hour timeframe and is trading in its medium-term ascending channel. A correction towards the demand zone would provide us with a better risk-reward buying position, and if it rises, we could consider selling it in the supply zone.
After a relatively quiet summer, the release of disappointing U.S. employment data brought a sharp shift in the gold market’s momentum, sparking a wave of optimism among Wall Street analysts. Gold ended the trading week near the short-term resistance level of $3,350—an area that, according to Kitco’s weekly survey, reflects a surge in bullish sentiment among market analysts.
This market turnaround happened rapidly. At the start of the week, gold came under selling pressure as economic data revealed that U.S. GDP grew by 3% in the second quarter. However, many economists questioned the reliability of this growth, noting its heavy dependence on volatile trade balance figures, which makes it a poor indicator of sustainable economic strength.
Midweek, another headwind emerged for gold. The Federal Reserve decided to keep interest rates unchanged, and in a press conference, Fed Chair Jerome Powell stated that no decision had been made yet regarding the September meeting. His cautious tone was captured in the statement: “We haven’t made any decisions about September.”
However, these remarks quickly lost weight. Just two days later, U.S. employment data significantly missed expectations, dramatically reshaping the outlook for monetary policy.
According to the Bureau of Labor Statistics, the U.S. economy added only 73,000 jobs in July—a number far below forecasts. Moreover, previous job gains for May and June were sharply revised downward, with a total of 258,000 jobs removed from earlier estimates. The updated figures showed only 14,000 jobs added in June and 19,000 in May. This disappointing data alone was enough to reignite expectations of a rate cut at the September meeting—an outcome that immediately boosted gold demand.
David Morrison, adopting a cautious stance, emphasized that although the jobs data favored gold, the market remains stuck in a narrow trading range, with limited evidence of a sustained short-term rally.
He explained, “Despite the significant gains last week, gold is still consolidating within a defined range. To break above $3,400 again—and more importantly, to hold it during any retracements—we’ll likely need a period of corrective volatility and price consolidation.”
Morrison also pointed out that the recent gold price rally was driven more by a sharp decline in the U.S. dollar than by internal factors within the gold market. “This sudden spike was largely a result of the unexpected downturn in the dollar following the release of the weak non-farm payroll report (NFP),” he said.
He further warned against over-interpreting a single data point: “Yes, the report has increased the odds of a rate cut in September, but we’re dealing with highly volatile data. It’s just one number—alongside a negative revision—and it can’t alone dictate the course of monetary policy.”
Meanwhile, investment bank Citi has raised its three-month gold price forecast from $3,300 to $3,500 per ounce. The expected trading range has also shifted—from $3,100–$3,500 to $3,300–$3,600.
According to Citi, this upward revision is driven by weak U.S. economic growth, heightened concerns about inflation linked to tariffs, and a weakening U.S. dollar. The bank also cited poor labor market data in Q2 and growing doubts about the credibility of the Federal Reserve and the Bureau of Labor Statistics. At the same time, investment demand for gold remains strong, with steady central bank purchases helping to sustain the metal’s favorable market position.

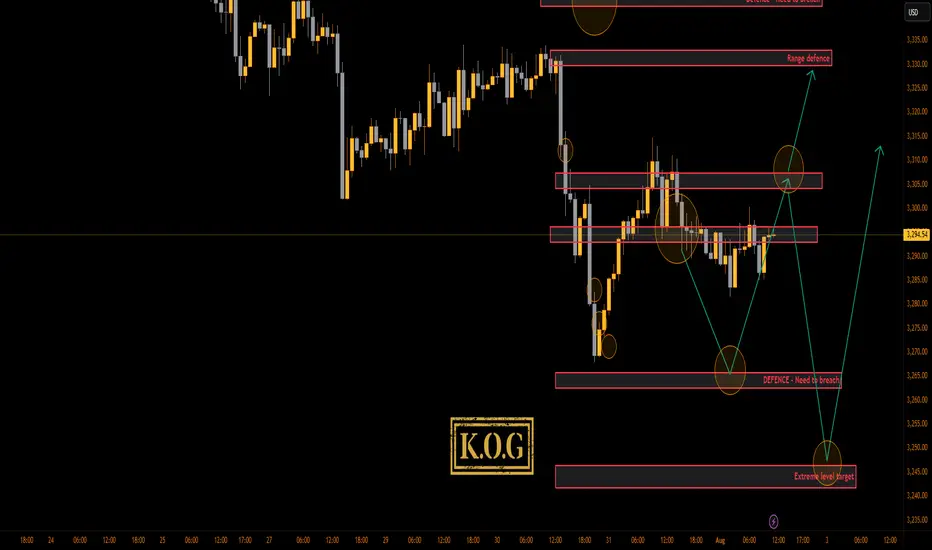
THE KOG REPORT - NFPTHE KOG REPORT – NFP
This is our view for NFP, please do your own research and analysis to make an informed decision on the markets. It is not recommended you try to trade the event if you have less than 6 months trading experience and have a trusted risk strategy in place. The markets are extremely volatile, and these events can cause aggressive swings in price.
Following on from the FOMC KOG Report which worked quite well, we’ll stick with the same chart and for today suggest caution. It’s the first day of the month and the last day of the weekly candle. The close here for gold is important and will give us further clues to the next few months.
We’ve shared the red boxes and the red box targets are below. There is a key level above 3306-10 which will need to be breached to correct the move back up to the 3330-34 region for the weekly close. However, we now have an undercut low which is potential if there is more aggressive downside to come and that level is sitting around the 3240-50 region which for us may represent an opportunity for a swing low. We’re a bit low and stretched here to short and as we’ve already hit our target for the day so we’ll wait for the extreme levels and if hit and our indicators line up, we may take some scalps. Otherwise, as usual on these events, the ideal trade will come next week.
RED BOXES:
Break above 3290 for 3295, 3306, 3310 and 3320 in extension of the move
Break below 3275 for 3267, 3260, 3255 and 3250 in extension of the move
Please do support us by hitting the like button, leaving a comment, and giving us a follow. We’ve been doing this for a long time now providing traders with in-depth free analysis on Gold, so your likes and comments are very much appreciated.
As always, trade safe.
KOG
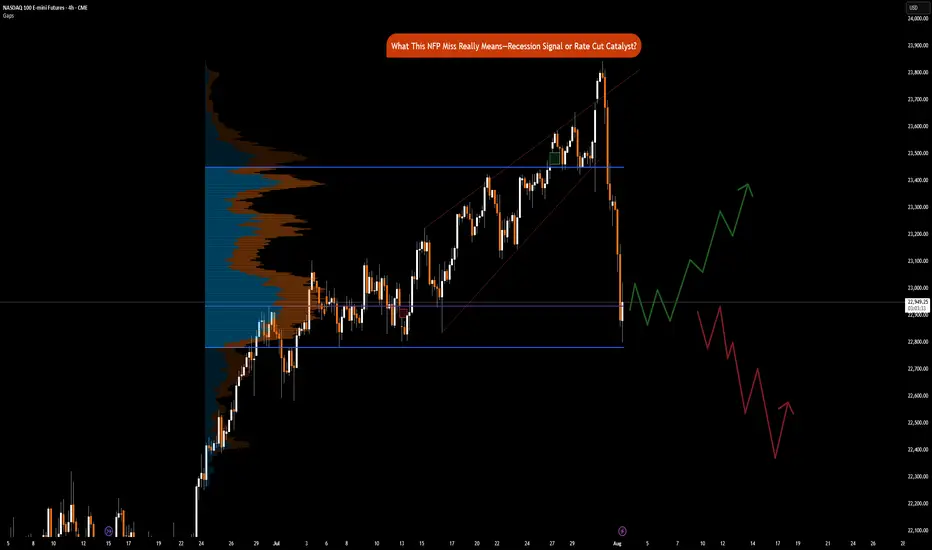
NFP Miss Implications: Recession Signal or Rate Cut CatalystCME_MINI:NQ1! CME_MINI:ES1! CME_MINI:MNQ1!
Happy Friday, folks!
Today is the first Friday of August, and that means the highly anticipated Non-Farm Payroll (NFP) numbers came in at 7.30 am CT.
US Non-Farm Payrolls (Jul) 73.0k vs. Exp. 110.0k (Prev. 147.0k, Rev. 14k); two-month net revisions: -258k (prev. +16k).
Other key labor market indicators were as follows:
• US Unemployment Rate (Jul) 4.2% vs. Exp. 4.2% (Prev. 4.1%)
• US Average Earnings MM (Jul) 0.3% vs. Exp. 0.3% (Prev. 0.2%)
• US Average Earnings YY (Jul) 3.9% vs. Exp. 3.8% (Prev. 3.7%, Rev. 3.8%)
• US Labor Force Particle (Jul) 62.2% (Prev. 62.3%)
Data and Key Events Recap:
What a year this week has been! It's been packed with high-impact economic data and pivotal central bank decisions, especially from the Federal Reserve. On top of that, trade and tariff announcements have dominated the headline.
U.S. economic data this week was broadly strong. Second-quarter GDP came in at 3.0%, beating expectations and signaling solid growth. The ADP employment report also surprised to the upside, printing 104K vs. the 77K forecast. Consumer confidence showed resilience as well, with the Conference Board’s reading rising to 97.2.
Inflation data was mixed but mostly in line. Core PCE for June rose 0.3% MoM, while the YoY reading ticked up to 2.8%, slightly above the expected 2.7%. The broader PCE Price Index also came in at 0.3% MoM, with a YoY print of 2.6%, slightly higher than forecast.
The Federal Open Market Committee (FOMC) voted to keep the federal funds rate target range unchanged at 4.25% – 4.50%. Notably, Governors Waller and Bowman dissented, favoring a 25-basis-point rate cut as expected, however, marking the first dual dissent by governors since 1993.
Changes to the FOMC Statement included a downgraded assessment of economic growth, reflecting slower real consumer spending. The Committee reiterated that uncertainty around the economic outlook remains elevated. It maintained its view of the labor market as "solid" and inflation as "somewhat elevated." Forward guidance remained unchanged, emphasizing the Fed’s readiness to adjust policy as necessary while continuing to monitor risks to both sides of its dual mandate.
Here’s a summary of key points from the FOMC press conference:
• On current policy stance:
“We decided to leave our policy rate where it’s been, which I would characterize as modestly restrictive. Inflation is running a bit above 2%... even excluding tariff effects. The labor market is solid, financial conditions are accommodative, and the economy is not performing as if restrictive policy is holding it back.”
Chair Powell commented on the need to see more data to help inform Fed’s assessment of the balance of risks and appropriate Fed Funds rate.
• On labor market risks:
“By many statistics, the labor market is still in balance... You do see a slowing in job creation, but also a slowing in the supply of workers. That’s why the unemployment rate has remained roughly stable.”
• On inflation and tariffs:
“It’s possible that tariff-related inflationary effects could be short-lived, but they may also prove persistent. We’re seeing substantial tariff revenue—around $30 billion a month—starting to show up in consumer prices. Companies intend to pass it on to consumers, but many may not be able to. We’ll need to watch and learn how this unfolds over time.”
Trade Headlines:
US President Trump announced tariffs on countries ranging from 10%-41%. Average US tariff rate now at 15.2% (prev. 13.3%; 2.3% pre-Trump), according to Bloomberg. US officials said that if the US has a surplus with a country, the tariff rate is 10% and small deficit nations have a 15% tariff, US officials said they are still working out technicalities of rules of origin terms for transshipment and will implement rules of origin details in the coming weeks. No details on Russian oil import penalty. Sectoral Tariffs White House said new reciprocal tariff rates take effect on Friday. Although Canada’s tariffs were increased to 35%, excluding USMCA goods, the effective rate is only 5%.
The economic data is showing strength, on the contrary, tariffs announcements for most countries have now been announced. Investors need to consider that tariffs are not just a tool to reduce trade deficit, it is also a geopolitical tool presently being used to shape alliances. The US wants to soften BRICS, China and Russian influence on the world stage.
Key to note is that these tariffs are substantially lower than what was announced on April 2nd, 2025.
The key question now remains, do participants buy the dip or ‘sell the fact’ is the current playbook?
Market Implications
Given the prior revisions in NFP data of -258K, July’s payroll came in at 73K, missing forecasts of 110K. What does this mean for markets? Markets are now pricing in 75% chance of a September rate cut. Prior revisions along with the current job market slowing down imply that risks to the downside are substantially increasing. Fed’s current policy is not just moderately restrictive but rather it may likely tip the US into a recession if Fed Funds rates remain elevated. The Chair asked to see more data, and here it is but I do wonder why they did not take this data into account for the July meeting. Surely, it would have been available to them.
Another question to ask would be, is it due to defiance of rate cut calls by the US administration? Is the Fed already behind the curve?
Fed’s dual mandate targets inflation and maximum employment. While inflation is sticky, the Fed may need to abandon their 2% mandate in favor of average inflation of 2.5% to 3%. A less restrictive policy will provide needed stimulus along with the fiscal stimulus provided via the BBB bill.
This drastically changes, in our analysis, how investors position themselves heading into the remainder of the year.
Markets (equities) may retrace slightly but the dip in our opinion will still be the play given weaker labor market data and increased rate cut bets. The bad news here means that the Fed has the data it wants to see to start cutting. Market pricing in 2 cuts seems to be the way forward for now.
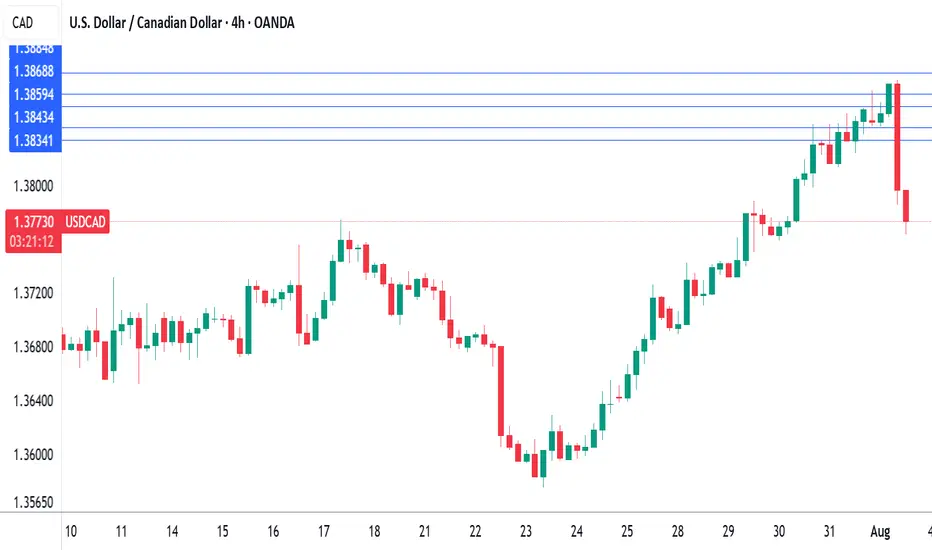
Canada's GDP contracts, US nonfarm payrolls misses forecastThe Canadian dollar continues to lose ground against its US counterpart and is trading at two-month lows. In the European session, the Canadian dollar is trading at 1.3875, down 0.13% on the day. USD/CAD has risen for six straight days, climbing 1.9% during that time.
US nonfarm payrolls for July were softer than expected at 73 thousand, compared to the forecast of 110 thousand. The June report was revised sharply downwards to 14 thousand from an initial 147 thousand.
Canada's GDP posted a small decline of 0.1% m/m in May, matching the market estimate. This followed an identical reading in April, as the economy is essentially treading water. A drop in retail trade was a significant factor in the weak GDP reading, particularly in motor vehicles and parts.
The decline in GDP in April and May can be squarely blamed on the trade war with the US, which has put a chill in economic activity. The markets are expecting a slight improvement in June, with an estimate of a 0.1% gain.
The Bank of Canada held the benchmark rate at 2.75% on Thursday for a third consecutive meeting. The rate statement noted that US trade policy remains "unpredictable" and Governor Macklem reiterated this at his press conference, saying that "some level of uncertainty will continue" until the US and Canada reach a trade agreement.
Meanwhile, the trade war between the two sides is heating up. President Trump announced on Thursday that the US was slapping 35% tariffs on Canadian products, effective Aug. 1. The new tariff will not apply to goods covered under the US-Mexico-Canada Agreement.
Canada's Prime Minister Mark Carney said he was "disappointed" with the US decision and vowed that "Canadians will be our own best customer". These are brave words, but Carney will be under pressure to reach a deal with the US, as 75% of Canadian exports are shipped to the US and Canada can ill-afford a protracted trade war with its giant southern neighbor.
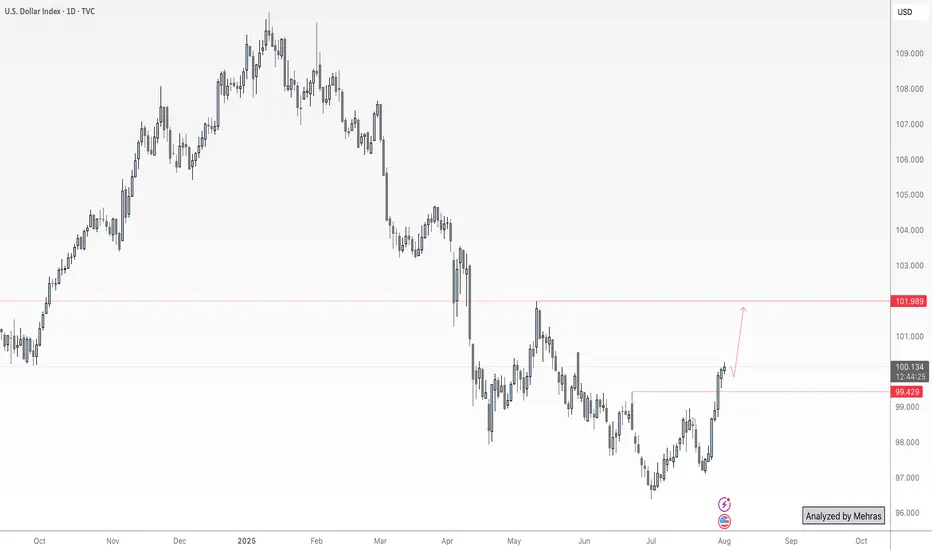
NFP Volatility Ahead – Is the Dollar Ready to Break Higher?🟢 DXY Outlook – A Key Day for the Dollar Index
Yesterday’s monthly candle closed with strong bullish momentum, marking a powerful start to August. Today, on the first trading day of the month, we’re expecting three major U.S. economic releases:
NFP, Average Hourly Earnings (m/m), and the Unemployment Rate.
As discussed in last week’s outlook, DXY has successfully broken above the key 100 level and confirmed a monthly close above it — a significant technical development. With no major order blocks or visible resistance in the way, the path toward the 102 target appears technically clear.
That said, I anticipate mixed data from today’s releases — which means we could see both sides of liquidity being taken during the initial reaction. Price might dip toward lower zones temporarily to collect liquidity before resuming its bullish move toward 102.
📌 In summary:
From a swing perspective, I believe the direction remains bullish for the Dollar Index as long as we hold above the 100 level.
When I say the data might be “mixed,” I mean the market could show an initial drop toward lower zones at the time of release — not because of a reversal, but to grab liquidity before continuing higher toward the 102 target.
Unless we see something unexpectedly extreme in the numbers, I expect the DXY to remain on track to reach the 102 level in the coming days or next week.
🔁 This analysis will be updated whenever necessary.
Disclaimer: This is not financial advice. Just my personal opinion.
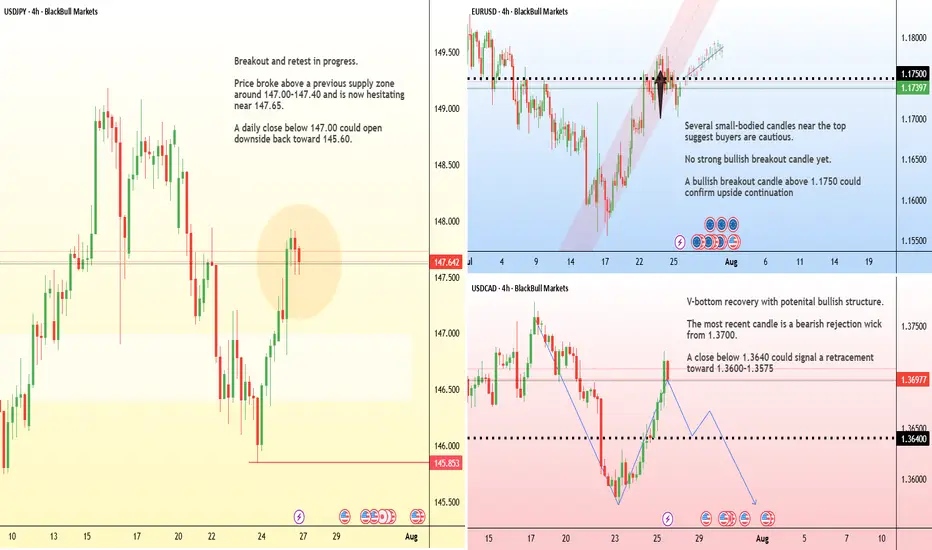
Interesting few days ahead... USD pairs approaching key levelsDXY is finishing a HTF consolidation and is approaching medium-term key areas. Other USD pairs are also in areas where they could aggressively turn around. EURUSD just finished a H4 3-touch continuation flag and is starting to stall on the 3rd touch, suggesting indecision in the markets.
Considering the news events in the next 3 days, starting today with USD advanced GDP data, we could see volatility kicking in on these key levels. We do need a catalyst to push price into a larger directional move, and we are prime positioned for the next leg. Technically, a breakout in both directions would make sense in these areas. Time to set alarms and be vigilant but not jump into trades too early, considering NFP on Friday as well.
*** **** ****
📈 Simplified Trading Rules:
> Follow a Valid Sequence
> Wait for Continuation
> Confirm Entry (valid candlestick pattern)
> Know When to Exit (SL placement)
Remember, technical analysis is subjective; develop your own approach. I use this format primarily to hold myself accountable and to share my personal market views.
The pairs I publish here are usually discussed in detail in my Weekly Forex Forecast (WFF) and are now showing further developments worth mentioning.
⚠ Ensure you have your own risk management in place and always stick to your trading plan.
*** **** ****
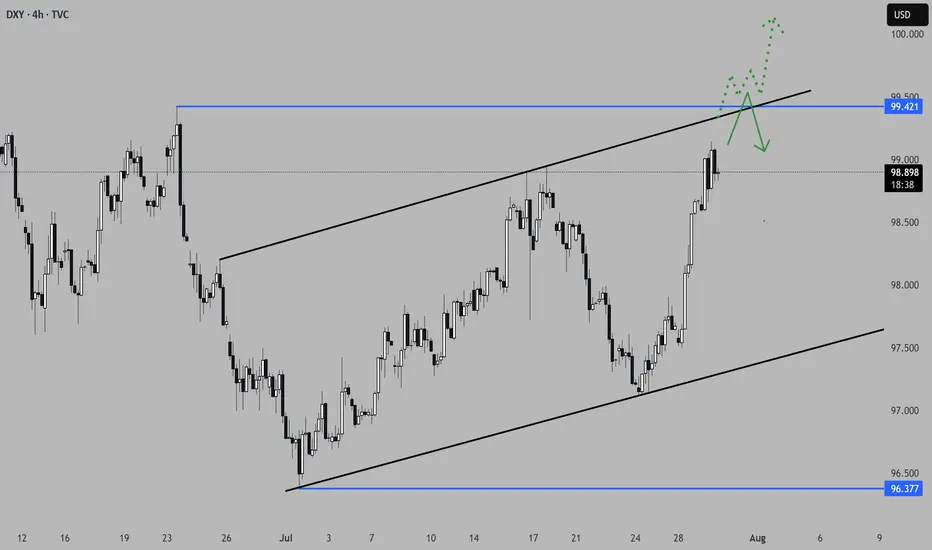
DXY at Its Most Critical Level of 2025 — Will the 100 Bank LevelThe Dollar Index (DXY), just like several other majors, is approaching a very important level. We’re now near the 100 mark, which is not only a psychological level — but also a key institutional (bank) level.
There’s also a gap zone left behind that price is about to fill. I believe the index will stay in a range over the next 1–2 days as it waits for critical data later this week — especially Wednesday’s announcements and Friday’s NFP report, which could set the tone for what’s next.
Based on current market sentiment, Trump’s remarks, Powell’s upcoming speech, and broader macro factors, I believe DXY has the potential to break above 100 and move toward 102–104, if that level is broken cleanly.
Let’s also not forget — price bounced from a monthly demand block near 96, and we’re seeing weak support across majors like EUR and Gold. That adds confluence for potential dollar strength.
📌 What do you think — is dollar strength just around the corner?
🔁 This analysis will be updated whenever necessary.
Disclaimer: This is not financial advice. Just my personal opinion.
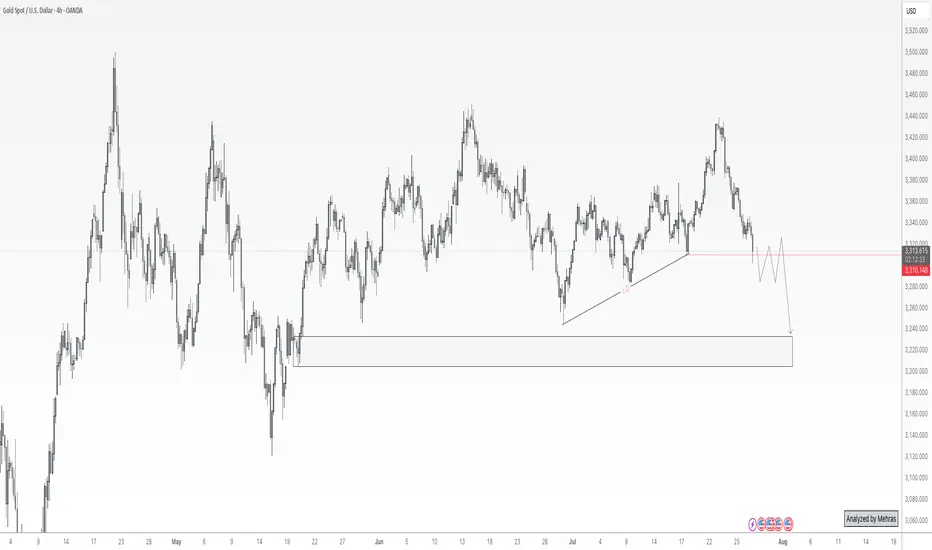
Gold at a Crossroads: $100 Drop Ahead or New All-Time High?Gold is now sitting at a critical decision zone near the $3300 level — a key bank-level area. If we see a daily candle close below this level, I anticipate a minimum drop of 1,000 pips, with the first major support around the $3220–$3200 range. The $3200 level is extremely significant, and I’ll discuss its importance more in future updates if necessary.
On the flip side, if buyers step in and we get a daily close above $3300, I still believe it’s too early to jump into longs. The selling pressure remains quite obvious, and we’ve already seen multiple failed attempts to push beyond this level toward the $3500 all-time high. That tells me the orders at this level might be exhausted.
Personally, I’ll only consider a long position if we get at least a clean 4-hour candle close above $3350.
It’s going to be an exciting week ahead with high-impact data releases including ADP, Core PCE, the Federal Funds Rate — and most importantly, Friday’s NFP.
📌 Stay tuned for updates throughout the week!
Disclaimer: This is not financial advice. Just my personal opinion!!!
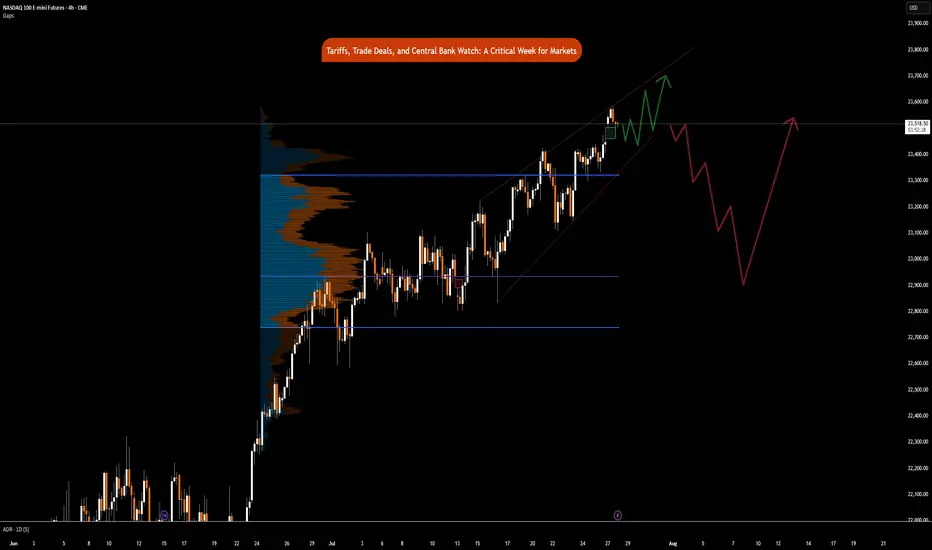
Tariffs, Trade Deals, & Central Bank Watch: Key Week in MarketsCME_MINI:NQ1! CME_MINI:ES1! CME_MINI:MNQ1! COMEX:GC1! CME_MINI:MES1! NYMEX:CL1!
This is a significant week in terms of macroeconomic headlines, key data releases, central bank decisions, and major trade policy developments. We get numbers for growth, inflation and decision and insights into monetary policy. Combining this with ongoing trade policy developments, we have a key week which may shape how the rest of the year unfolds.
Below is a consolidated summary of the latest trade negotiations, scheduled economic releases, and policy outlooks.
US - EU Trade Deal:
• US–EU Tariffs: The US will impose a 15% tariff on most EU goods, including cars, semiconductors, and pharmaceuticals, but retain a 50% tariff on steel and aluminium with a new quota system.
• Exemptions: Zero-for-zero tariffs agreed for agriculture, aircraft parts, and chemicals; aircraft exports are temporarily exempt.
• EU Commitments: The EU will invest $600 billion in the US and purchase $750 billion in US energy, mainly LNG.
• Agriculture: The EU will lower tariffs on many US agricultural goods, though not comprehensively.
• Political Reactions: EU leaders are mixed, Germany and the Netherlands praised the deal, France called it unbalanced, and Hungary viewed it unfavorably.
• The deal is not final until it is ratified by all EU national parliaments and the EU Parliament.
China Talks: US and China expected to extend their trade truce by 90 days. US-China meeting expected in Stockholm on Monday and Tuesday. Trump to freeze export controls to secure a deal. A group of US executives will visit China for trade discussions, organized by the US-China Business Council.
South Korea Trade Talks: Korea proposes a shipbuilding partnership with the US and is preparing a trade package.
UK–US Relations: PM Starmer and Trump to meet in Scotland to discuss the UK–US trade deal implementation, Middle East ceasefire, and pressure on Russia.
Thus far, the US has announced trade deals with the UK, Vietnam, Philippines, Indonesia, Japan and The EU. Trade delegations are working to finalize deals with China, Mexico, Canada
Key Economic Data Releases:
Monday: Treasury refunding financing estimates.
Supply: 2-Year and 5-Year Note Auction, 3 & 6-Month Bill Auction
Tuesday: US Advance Goods Trade Balance, Wholesale Inventories Advance, CB Consumer Confidence, JOLTS Job Opening (Jun), Atlanta Fed GDPNow, Australian CPI Q2
Supply: 7-Year Note Auction
Wednesday: German GDP Q2, EUR GDP Q2, US ADP Non-farm Employment, US GDP Q2, Crude Oil Inventories, Chinese Manufacturing PMI
Canada: BoC Interest Rate Decision, Rate Statement, Monterey Policy Report, BoC Press Conference
US: Fed Interest Rate Decision,FOMC Statement, Fed Press Conference.
Japan: BoJ Interest Rate Decision, Monetary Policy Statement
Thursday: EU Unemployment (Jun), US PCE & Core PCE Price Index (Jun)
Japan: BoJ Press Conference
Friday: EU CPI, US NFP, Unemployment Rate, Average Hourly Earnings, ISM Manufacturing PMI, Michigan 1-Year & 5-Year Inflation Expectations.
It is also a busy earnings week. See here for a complete earnings schedule .
Markets are interpreting trade deals as positive news thus far. The dollar is strengthening.
As we previously mentioned, we anticipate no rate cuts this year as economic data proves to be resilient and inflation largely under control. WSJ also posted an article stating that most tariffs costs are being absorbed by companies due to weaker pricing power. We previously wrote about this on our blog: “ In our analysis, the inflation impact of tariffs may not show up until Q4 2025 or early 2026, as tariff threats are mostly used as a lever to negotiate deals. While effective tariff rates have increased, as Trump reshapes how tariffs are viewed, cost pass-through to consumers will be limited in Q3 2025, as companies’ front-loaded inventory helps mitigate the risks of increased tariff exposure.
So, what we have is an interesting development shaping up where, while inflation may rise and remain sticky, it is yet to be seen whether slowing consumer spending will weaken enough to the point where companies must start offering discounts, which would nullify the tariff risk to the end consumer and result in companies absorbing all tariffs. This scenario will see reduced earnings margins leading into the last quarter and early 2026. However, it will materially reduce risks of higher inflation.”
In our view, the US dollar has a higher probability to rally in the short-term i.e., Q3 as markets re-align FX rate differentials. Bond yields stabilize, Equities continue pushing higher, while Gold retraces as previously mentioned. This in our view, is what investors and participants refer to as the Goldilocks scenario. If this plays out as expected we anticipate continued strength with AI, tech, energy and defense sectors outperforming into mid- 2026.
Institutional View: Morgan Stanley
Morgan Stanley also sees no rate cuts in 2025, despite market pricing for two 25 bps cuts. They forecast more aggressive cuts in 2026 due to:
• Tariff-related inflation emerging before labor market deterioration
• Slowing US growth, as fiscal support fades
• Impact of tighter immigration policy and global trade realignment
That said, MS continues to cite longer-term risks to the dollar, including:
• Twin deficits (fiscal + current account)
• Ongoing debate around USD’s safe haven status
• USD hedging activity picking up by international investors
• Strained credibility of the Fed due to tension between Fed Chair and the US Administration
How Fed policy evolves in Q4 2025 and Q1 2026 will depend heavily on the incoming Fed Chair nominee, who is expected to replace Jerome Powell in May 2026. This nomination could significantly influence future policy direction around growth and inflation targets.
XAUUSD - Gold is in for a big week?!Gold is trading below the EMA200 and EMA50 on the 4-hour timeframe and near the bottom of its medium-term ascending channel (breakout or no break is yet fully confirmed). A correction towards demand levels would provide us with a better risk-reward buying position, and if it rises, we could consider shorting it in supply levels.
In the past week, gold experienced two distinct phases in its price movement: a strong upward trend in the first half that stalled at key resistance levels, leading the market into a more cautious mode. The latest surveys reveal a clear division among gold analysts—some foresee a bearish outlook, while others prefer to remain neutral and wait for further signals. Meanwhile, retail traders remain optimistic about gold’s short-term trajectory and emphasize the continuation of its upward trend.
Analysts at Commerzbank believe the gold market is currently directionless and searching for a clear trend. In their view, recent news around potential trade agreements has weakened demand for gold as a safe-haven asset. They have adopted a neutral stance in the short term, stating that gold prices are near their upper limit with limited room for further gains at the moment.
Conversely, some experts are confident in the continuation of gold’s bullish trend. Rich Checkan, President and CEO of Asset Strategies International, declared: “Gold is in an uptrend. Today’s pullback is setting the stage for next week’s rally. If the Federal Open Market Committee (FOMC) meets expectations and holds rates steady, both gold and silver will keep climbing. And if the Fed exceeds expectations by cutting rates, we’ll see an even stronger surge in both metals. Either way, the direction is upward.”
At the same time, other analysts remain cautious about the trend’s sustainability. Mark Leibovit, editor of VR Metals/Resource Letter, warned that the U.S. dollar may be forming a bottom, which could exert downward pressure on gold and calls for increased caution from investors.
Despite continued political pressure from President Trump, the Federal Reserve is not expected to lower interest rates at the upcoming meeting. Central bankers have stated that they want to observe the economic effects of tariffs before making any adjustments. Although some Fed officials are moving away from the “wait and see” approach, analysts still believe the Fed will leave rates unchanged this week—though markets are closely watching for any signals suggesting that rate cuts could begin as early as September.
Meanwhile, China’s gold consumption in the first half of 2025 declined, though the drop was less severe than in previous years. The primary reason was increased demand for gold as a safe-haven investment, which partially offset reduced jewelry purchases due to high prices.
According to data from the China Gold Association, a government-affiliated body, gold consumption fell by 3.54% year-over-year in the first half of the year to 505,205 tons. In comparison, Q1 saw a 5.96% annual decline, and the same period in 2024 recorded a 5.61% drop.
The association stated that growing geopolitical tensions and ongoing economic uncertainty have strengthened gold’s role as a store of value and safe asset, prompting a significant rise in private investment in bars and coins.
Gold bar and coin purchases—a key indicator of safe-haven demand—surged by 23.7% to 264,242 tons, accounting for 52% of total consumption and overtaking jewelry as the largest consumption segment. Meanwhile, gold jewelry demand fell by 26% to 199,826 tons, reflecting weakened consumer interest due to high prices.
Still, the association noted that lighter jewelry products with unique designs and higher value-added features remain popular. Additionally, official data from the People’s Bank of China (PBOC) showed that the central bank increased its gold reserves in June for the eighth consecutive month.
On the supply side, domestic gold production fell by 0.31% year-over-year to 179,083 tons in the first half of the year, while output from imported sources rose by 2.29% to 76,678 tons. Altogether, China’s total gold production grew by 0.44%, reaching 252,761 tons.

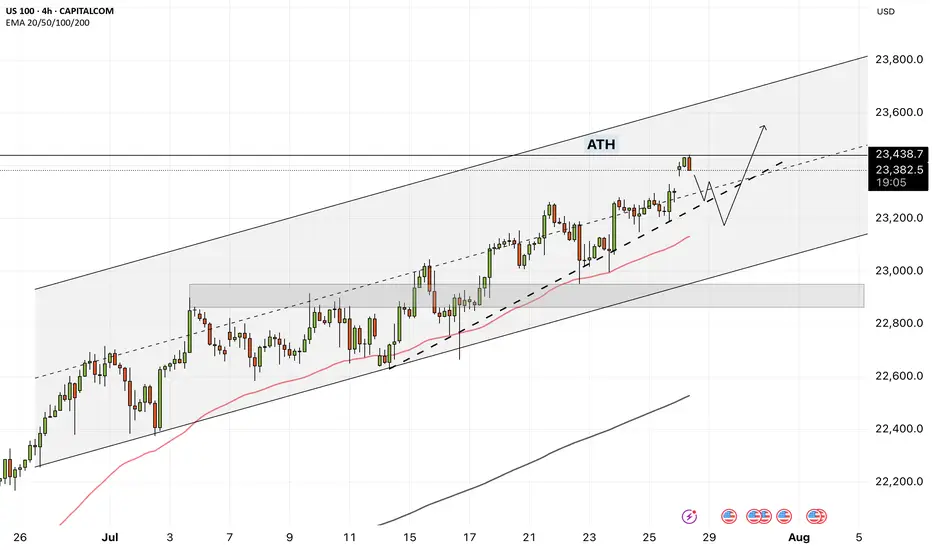
NAS100 - How will the stock market react to the FOMC meeting?!The index is trading above the EMA200 and EMA50 on the four-hour timeframe and is trading in its ascending channel. The target for this move will be the ceiling of the channel, but if it corrects towards the indicated support area, you can buy Nasdaq with better reward-risk.
As signs of easing global trade tensions begin to emerge, the Federal Open Market Committee (FOMC) is scheduled to meet this week. Analysts widely expect the Fed to hold interest rates steady for a fifth consecutive time. This anticipated decision comes as the U.S. President continues to push for rate cuts, persistently pressuring the Fed to adopt a more accommodative monetary stance.
So far, the Federal Reserve has kept its benchmark rate within a range of 4.25% to 4.5%. While some officials project two cuts by the end of the year, markets are waiting for the Fed’s patience to run out. According to the CME Group’s FedWatch tool, investors have priced in a 62% chance of a rate cut in the September meeting. By then, the Fed will have access to the July and August employment reports—key indicators of whether the labor market is weakening or remains resilient.
The upcoming week marks the peak of Q2 earnings season, with 37% of S&P 500 companies reporting results, including four major tech firms. In parallel, the August 1st tariff deadline for the EU and other countries is approaching, while legal challenges over existing tariffs remain ongoing.
According to a report by The Wall Street Journal, many large U.S. corporations have so far absorbed the bulk of tariff-related costs without passing them on to consumers. This strategy aims to maintain market share and avoid drawing criticism from President Trump. However, the question remains—how long can this continue?
Examples from the report include:
• General Motors paid over $1 billion in tariffs in Q2 alone without announcing any price hikes.
• Nike expects a $1 billion hit from tariffs this fiscal year and is planning price increases.
• Hasbro is working on a combination of price hikes and cost cuts to offset $60 million in tariff impacts.
• Walmart has made slight pricing adjustments (e.g., bananas rising from $0.50 to $0.54) and managed pressure through inventory reductions.
This week is shaping up to be one of the busiest on the economic calendar in recent months. A flood of key data on growth, inflation, and employment, alongside three major interest rate decisions, has markets on high alert.
On Tuesday, attention will turn to two significant reports: the Job Openings and Labor Turnover Survey (JOLTS) and the U.S. Consumer Confidence Index for July. These metrics will offer a clearer view of labor market dynamics and household sentiment heading into critical monetary policy decisions.
The most anticipated day is Wednesday. That day brings the ADP private payrolls report, the first estimate of Q2 GDP, and pending home sales data. Additionally, both the Bank of Canada and the Federal Reserve will announce rate decisions—events with the potential to simultaneously steer global market trajectories.
On Thursday, the July Personal Consumption Expenditures (PCE) price index will be released—a key inflation gauge closely monitored by the Fed. Weekly jobless claims data will also be published that day.
The week concludes Friday with two heavyweight economic indicators: July’s Non-Farm Payrolls (NFP) report, a crucial input for Fed policy decisions, and the ISM Manufacturing PMI, which offers insights into the health of the real economy.
Some economists argue that a September rate cut may be premature, and even suggest that no rate changes might occur in 2025. Analysts expect Fed Chair Jerome Powell to reiterate a data-dependent stance, consistent with previous meetings.
Still, beyond political dynamics, the July meeting holds independent significance.The Fed’s internal policy tone is gradually leaning more dovish, and subtle signals of this shift may emerge in the final statement. Given that only one meeting remains before September, if policymakers are leaning toward a rate cut then, it’s critical that the groundwork for such communication be laid now.
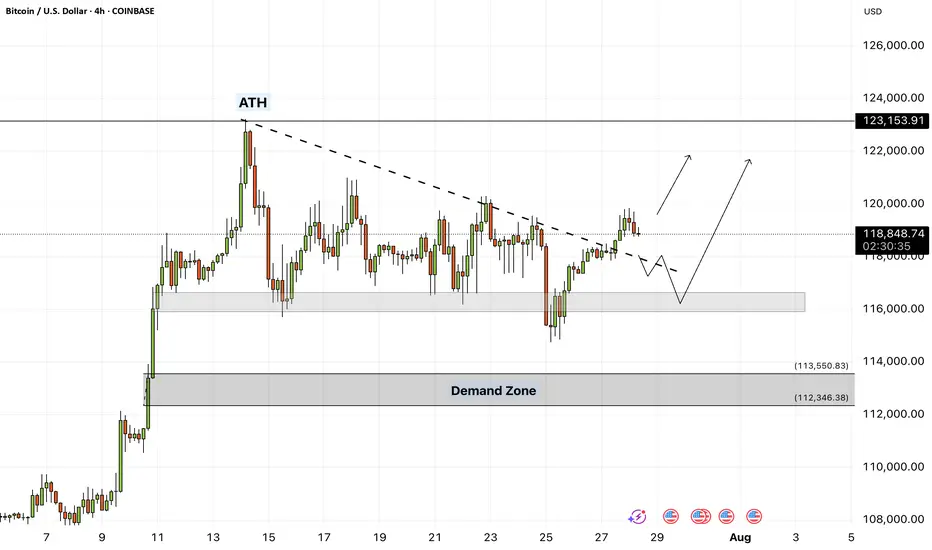
Bitcoin - Will Bitcoin continue its upward trend?!Bitcoin is above the EMA50 and EMA200 on the four-hour timeframe and is in its medium-term ascending channel. Bitcoin’s current upward momentum has the potential to reach its previous ATH. If it corrects, you can look for Bitcoin buying opportunities from the identified support area, which is also at the intersection of the bottom of the ascending channel.
If this support is lost, the decline will continue to around $113,000, where you can again buy Bitcoin with a better risk-reward ratio.
It should be noted that there is a possibility of heavy fluctuations and shadows due to the movement of whales in the market, and capital management will be more important in the cryptocurrency market. If the downward trend continues, we can buy within the demand range.
Last week, a group of U.S. senators released an initial draft of a new legislative proposal aimed at creating a clearer regulatory framework for the digital asset industry in the United States. The proposal builds on the recently passed CLARITY Act in the House of Representatives and focuses on strengthening market structure, enhancing consumer protection, and expanding regulatory oversight.
According to the senators, the bill addresses key areas such as banking, disclosure requirements, securities classification, and measures to combat illicit financial activity.Senator Lummis, in highlighting the proposal, stressed the urgent need for legal clarity to support the growth of this emerging industry within the U.S. The legislation aims to facilitate the integration of digital assets into banking services and would allow financial holding companies to provide services based on such assets.
The draft also includes measures aimed at preventing illegal financial activities, such as improving regulatory standards and boosting inter-agency cooperation to identify and block misuse of digital assets.
In addition, the senators have issued a “Request for Information” (RFI) to support the legislative process and have invited the public to share their opinions on more than 35 related topics, encouraging broader engagement in shaping the bill.
Meanwhile, in Asia, Japan-based firm Metaplanet announced that it has added 780 BTC worth $93 million to its digital holdings. This acquisition brings the company’s total Bitcoin reserves to 17,132 BTC, valued at roughly $2 billion. Metaplanet is fast becoming one of the largest institutional Bitcoin treasuries in the region—potentially serving as a model for other firms across Asia.
At the same time, publicly traded U.S. companies have significantly ramped up their Bitcoin holdings. By the end of Q2 2025, these companies had accumulated nearly 900,000 BTC, marking a 35% increase over the previous quarter. This surge, driven primarily by firms such as MicroStrategy, has sent demand for Bitcoin soaring.
Some analysts believe that the $1.5 trillion in free cash flow held by companies within the S&P 500 index could spark a new wave of institutional Bitcoin buying.
Looking ahead, the upcoming week is packed with critical U.S. economic data. Alongside the Non-Farm Payroll (NFP) employment report and inflation metrics via the Personal Consumption Expenditures (PCE) index, the initial estimate for Gross Domestic Product (GDP) and various other indicators will be released—potentially offering a clearer picture of where the U.S. economy is heading.
The Federal Reserve remains primarily focused on inflation and labor market dynamics. June CPI data indicated signs of inflationary pressure caused by tariffs. If Thursday’s PCE report—particularly its core reading—confirms a similar trend, the Fed may decide against a rate cut in September. As a result, financial markets have priced in only about a 65% chance of a rate cut at that meeting.
Markets face a PACKED schedule this weekThe tariff truce between the U.S. and several major trading partners is set to expire on August 1 . A deal with Japan has already been reached, but talks with the EU, Canada, and Mexico remain active.
In monetary policy, the Federal Reserve is widely expected to hold rates steady at 4.5% during its midweek meeting .
Across the border, the Bank of Canada is also expected to leave its interest rate unchanged at 2.75% . After cutting rates twice earlier this year, the BoC is seen as entering a wait-and-see phase.
In Asia, the Bank of Japan will announce its decision on Wednesday . While the BoJ isn’t expected to hike this month, recent U.S.–Japan trade progress has opened the door for policy tightening later this year.
Finally, the week concludes with the U.S. Non-Farm Payrolls report on Friday. Economists expect job gains of around 110,000 in July, down from 147,000 in June.
GBPUSD: Sellers Are Taking ControlWelcome back to the Weekly Forex Forecast for the week of July 28 - Aug 1st
In this video, we will analyze the following FX market:
GBPUSD
GBP is weak vs USD. GU is heading lower with a bit of steam.
The Monthly and the Weekly are still bullish, but the Daily and 4H indicate weakness. I would not entertain longs until I see a bullish BOS.
Look for the CISD on the 4H in the beginning of the week, confirming sells are the way to go.
Enjoy!
May profits be upon you.
Leave any questions or comments in the comment section.
I appreciate any feedback from my viewers!
Like and/or subscribe if you want more accurate analysis.
Thank you so much!
Disclaimer:
I do not provide personal investment advice and I am not a qualified licensed investment advisor.
All information found here, including any ideas, opinions, views, predictions, forecasts, commentaries, suggestions, expressed or implied herein, are for informational, entertainment or educational purposes only and should not be construed as personal investment advice. While the information provided is believed to be accurate, it may include errors or inaccuracies.
I will not and cannot be held liable for any actions you take as a result of anything you read here.
Conduct your own due diligence, or consult a licensed financial advisor or broker before making any and all investment decisions. Any investments, trades, speculations, or decisions made on the basis of any information found on this channel, expressed or implied herein, are committed at your own risk, financial or otherwise.

XAUUSD (GOLD): Wait For The BOS! FOMC and NFP Looms!In this Weekly Market Forecast, we will analyze the Gold (XAUUSD) for the week of July 28 - June 1st.
Gold is in the middle of a consolidation. Bas time to look for new entries!
FOMC on Wednesday and NFP on Friday. Potential news drivers to move price in a decisive direction!
Wait for a break of structure (BOS) either direction before entering a new trade.
Be mindful that the Monthly is bullish, and the Weekly is neutral.
The Daily is bearish, with 3 days of data indicating so. I am leaning towards this bias, as the draws on liquidity are near and obvious.
Enjoy!
May profits be upon you.
Leave any questions or comments in the comment section.
I appreciate any feedback from my viewers!
Like and/or subscribe if you want more accurate analysis.
Thank you so much!
Disclaimer:
I do not provide personal investment advice and I am not a qualified licensed investment advisor.
All information found here, including any ideas, opinions, views, predictions, forecasts, commentaries, suggestions, expressed or implied herein, are for informational, entertainment or educational purposes only and should not be construed as personal investment advice. While the information provided is believed to be accurate, it may include errors or inaccuracies.
I will not and cannot be held liable for any actions you take as a result of anything you read here.
Conduct your own due diligence, or consult a licensed financial advisor or broker before making any and all investment decisions. Any investments, trades, speculations, or decisions made on the basis of any information found on this channel, expressed or implied herein, are committed at your own risk, financial or otherwise.

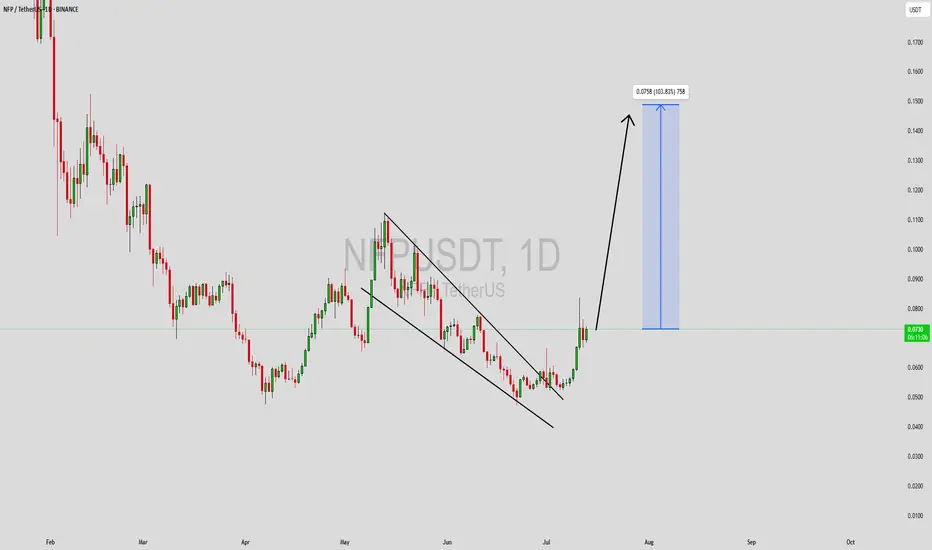
NFPUSDT Forming Descending ChannelNFPUSDT is starting to attract significant attention as it shows signs of reversing its downward trend with a promising technical setup. This crypto pair has recently broken out of a descending channel, indicating that selling pressure might be subsiding while buyers are stepping in. The price structure suggests a clear path for a potential bullish continuation, and the projected target hints at a strong gain of around 90% to 100%+. Technical traders are closely watching this level for a confirmed breakout and a sustained rally.
The volume on NFPUSDT remains good, showing that liquidity is healthy and there’s active participation from traders and investors. This is a critical factor in validating the breakout — when volume aligns with price action, the odds of a strong move increase. Many crypto traders rely on these confirmation signals to enter early positions, capturing the momentum as it picks up. With the market sentiment slowly shifting, NFPUSDT could see an influx of new interest in the coming weeks.
Investors are increasingly taking interest in this project, not just from a technical perspective but also due to its fundamentals and community engagement. As the crypto market looks for solid setups in a sea of volatility, pairs like NFPUSDT stand out for their clear patterns and realistic upside potential. Keep an eye on support levels holding firm and whether the breakout candle closes above resistance with strength.
✅ Show your support by hitting the like button and
✅ Leaving a comment below! (What is You opinion about this Coin)
Your feedback and engagement keep me inspired to share more insightful market analysis with you!
NFP Bears gathering their troops? or will the Bulls stampede...The past 9 days have been quite interesting for the EUR/USD which has been relentless. Price has been rising like a helium balloon let loose at the park...
Bulls have clearly been in control, not only the past 9 days but since the beginning of the year with the exception of the strong pullback in April & May only to bounce for another 700 pip run.
I am totally USD bearish across the board as I have been mentioning in my analysis videos for the past few months but like all macro moves, we always have pullbacks along the way and that is why I have been shorting the EUR/USD back from 1.1500+ - 1.1700+
I've given this a lot of room to breathe, more than usual but considering the following technical setup, I'm willing to give the Bears some leeway and potentially show me they'll come through.
•Rising Broadening pattern (Where two trendlines start close together only to divergence and expand) - This is a bearish pattern.
•Negative Divergence on the MACD, Linear Regression & the RSI.
•Price has made a run to the yearly R3 pivot level. (Rare extension)
•Last daily candle is a hanging man candlestick (Reversal candle)
•Weekly chart has the EUR/USD at the upper band of a polynomial regression channel which calculates for price extremities in the market.
There are a few more setups as well but it's too much to describe here and I'd have to show it in a video (Which I plan to do over the weekend)
With all of that said... It could all fail lol but seriously speaking... You just can't ask for a better probabilistic setup so whatever happens during NFP... happens.
Aside from the technical aspect... I know yearly R2 around 1.1600 was a hotspot for shorts because divergence was at the early stages and taking a short there wouldn't have been a bad idea but we know institutions are in play as well, so above 1.1600 could have been a huge area to run stop losses and margin calls before a potential reversal.
250 pips would be enough to run a large pool of stops and liquidation.
IF price is going to reverse here during NFP, I believe late longs and breakout/pullback traders are going to try and buy at the trendline at 1.1660ish but it wont hold and trap them on the other side of the trade.
Under that, I can see us pulling back towards 1.1200ish...
If the Bears give up and price continues to climb... the original macro target may very well be under way which was 1.2000 - 1.2200 (Based on a Monthly and 3-Month chart analysis)
As of this writing the EUR/USD is pretty much completely flat which is expected before the NFP fireworks ahead of July 4th.
We'll see what happens tomorrow morning! buckle up!
As always, Good luck and Trade Safe! See you post NFP.
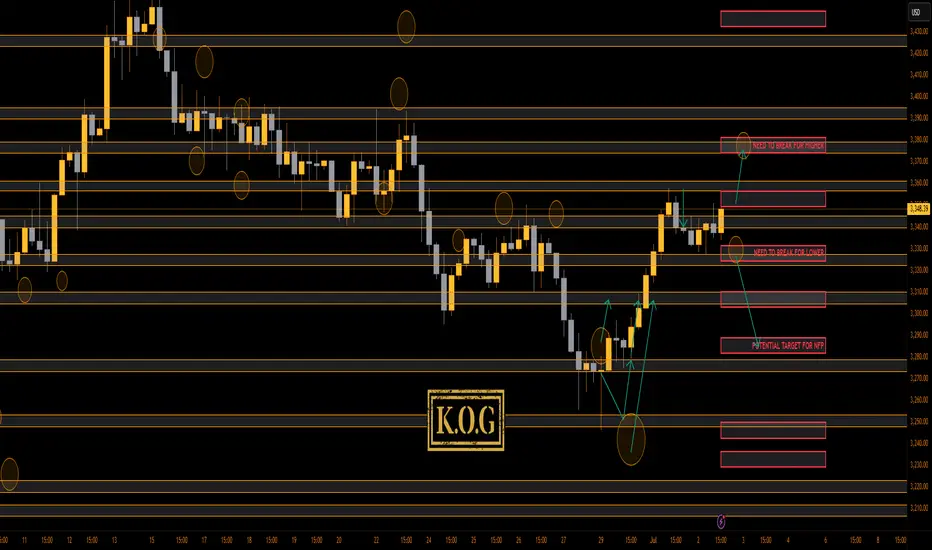
THE KOG REPORT - Update & NFP analysis End of day update from us here at KOG:
We managed to get the move into the red box we wanted which should have been a enough for the day. However, the levels were so clean during NY that we managed to get another decent trade into the Excalibur target to complete the day.
With NFP tomorrow and a US holiday on Friday, we're going to share our levels and view but due to unforeseen circumstances, I won't be around for the rest of the week to see it through.
We've added the updated red boxes, the key levels and the potential move if they break. So far, we've had a good week, so these levels are simply for reference and unless there is a clean set up, our traders will stay away until Monday.
Red boxes:
Break above 3350 for 3355, 3362, 3373, 3375 and 3390 in extension of the move
Break below 3335 for 3320, 3316, 3310. 3306, 3298 and 3285 in extension of the move
The week so far:
KOG’s bias for the week:
Bullish above 3250 with targets above 3278✅, 3285✅, 3297✅ and above that 3306✅
Bearish below 3250 with targets below 3240, 3232, 3220 and below that 3212
RED BOX TARGETS:
Break above 3275 for 3279✅, 3285✅, 3289✅ and 3306✅ in extension of the move
Break below 3260 for 3255, 3251, 3240 and 3235 in extension of the move
As always, trade safe.
KOG
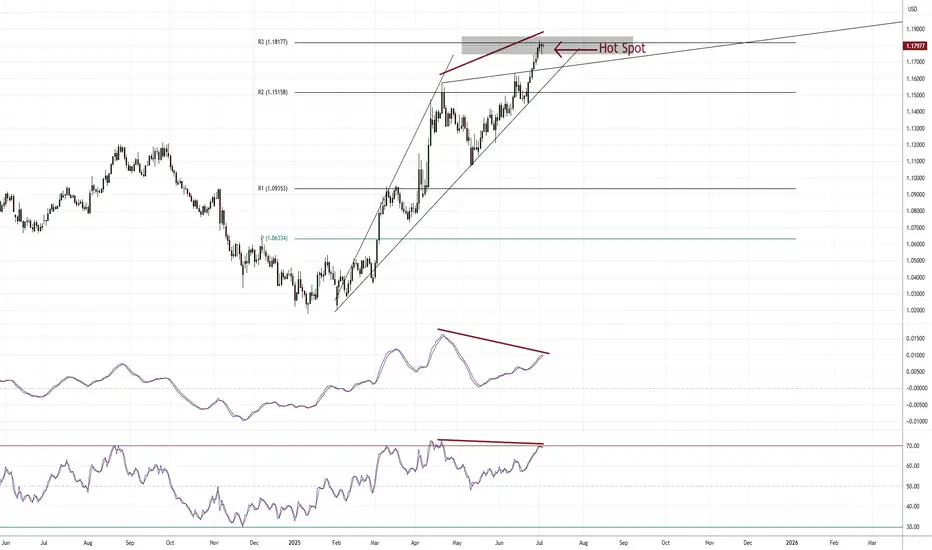
EUR/USD: A Perfect Storm for BullsThis is a high-conviction long setup based on a powerful combination of macroeconomic divergence and a confirmed multi-year technical breakout.
The Non-Farm Payrolls report has now been released, and the resulting price dip has created what I believe is an ideal entry opportunity to align with the dominant bullish trend.
The Fundamental Why 📰
NFP Aftermath: Yesterday's NFP report was a mixed bag that ultimately reinforces the case for Fed rate cuts. The headline number beat expectations, causing an initial USD rally and a dip in EUR/USD. However, the underlying details like wage growth were soft. Crucially, the market continues to price in a 96% probability of a Fed rate cut by September, a figure that was unchanged by the data. The core driver of USD weakness—a dovish Fed—remains firmly intact.
Resilient EUR 🇪🇺: In contrast, the ECB has signaled it is at or near the end of its easing cycle. Economic data from core Eurozone countries is stabilizing, providing the Euro with relative strength.
Risk-On Sentiment 💹: The broader market remains in a "risk-on" mood, which is typically negative for the safe-haven USD. Gold is soaring and equities are near all-time highs, confirming the anti-dollar flow.
The Technical Picture 📊
The Secular Breakout 🚀: The most significant event is the breakout of a decade-long downtrend resistance line. This is a major structural shift. The pair has also achieved a monthly and quarterly close above the critical 1.1500 handle, turning a historic resistance level into a new support floor.
The Impulsive Uptrend 🌊: On the 4-hour chart, the price is in a clear ascending channel. The post-NFP dip represents a healthy correction within this uptrend, bringing price back toward key support.
Key Levels 🔑:
Support Zone: The dip has brought price directly into the key support confluence between 1.1700 and 1.1760, making this an ideal area to enter long.
Resistance Zone: Major resistance still sits at 1.1900, making it a prudent take-profit target.
Strategy & Risk Management 🧠
The stronger-than-expected NFP headline has provided the exact pullback this strategy was designed for. The dip presents a prime opportunity to buy into the dominant uptrend at a more favorable price. Instead of chasing the market, we are now positioned to enter on a technically sound correction.
Good luck, and trade safe!
Trade Parameters ✅
Pair: EUR/USD
Direction: Long / Buy 🟢
Entry Type: Limit Order
Entry Price: 1.1745
Stop-Loss: 1.1685 (60 pips) 🔴
Take-Profit: 1.1895 (150 pips) 🎯
Risk/Reward Ratio: 2.5 : 1
