#GHCL#GHCL: Is consolidating or forming tight price action near All time high / Break out zone. The stock is out performing in this volatile times
Nifty50

ITC BREAKOUT Stay in Long PositionFirst Resistance:- 502.2
Second Resistance:- 505.7
Third Resistance:- 507.9
First Support:- 496.5
Second Support:- 494.3
Third Support:- 490.8
Daily Avg. Delivery Volume %
20 Aug, 2024 Week Month
57.0% 53.7% 51.9%

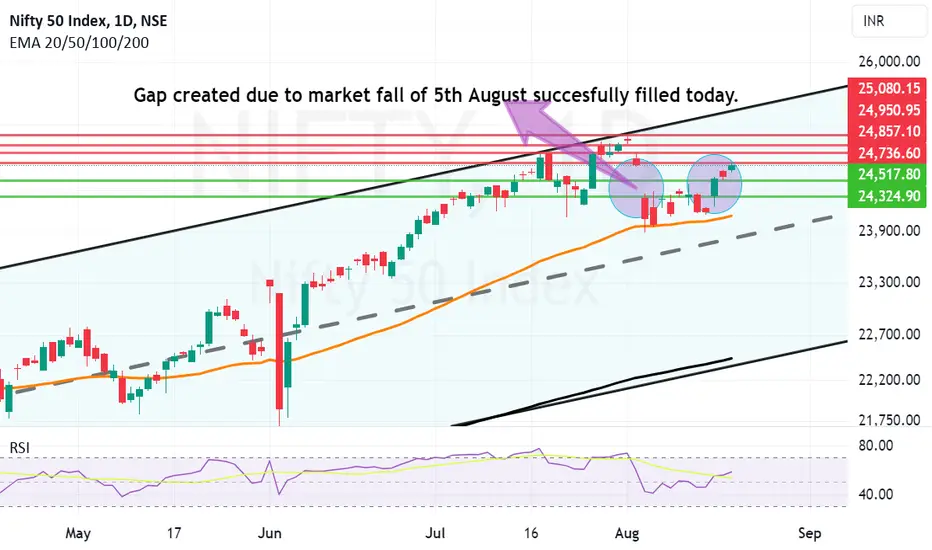
Gap generated on 5th August Finally Filled today. Gap generated due to gap down opening of 5th August is finally filled today. It is not necessary that all gaps either on the way up or on the way down are filled every time. As there are different type of gaps and different timings of gaps / intervals etc there are many factors which create loop holes in the gap theory. We will discuss that some other time. Gap Theory is a subject in itself. The supports for Nifty now are at 24517, 24324 and finally 24088. Resistances for Nifty in the short to medium term are at 24736, 24857, 24950 and 25080.
NIFTY INTRADAY LEVELS FOR 20/08/2024BUY ABOVE - 24600
SL - 24530
TARGETS - 24660,24710,24780
SELL BELOW - 24530
SL - 24600
TARGETS - 24460,24380,24320
NO TRADE ZONE - 24530 to 24600
Previous Day High - 24660
Previous Day Low - 24530
Based on price action major support & resistance's are here, the red lines acts as resistances, the green lines acts as supports. If the price breaks the support/resistance, it will move to the next support/resistance line. White lines indicates previous day high & low, high acts as a resistance & low acts as a support for next day.
Trendlines are also significant to price action. If the price is above/below the trendlines, can expect an UP/DOWN with aggressive move.
Please NOTE: this levels are for intraday trading only.
Disclaimer - All information on this page is for educational purposes only,
we are not SEBI Registered, Please consult a SEBI registered financial advisor for your financial matters before investing And taking any decision. We are not responsible for any profit/loss you made.
Request your support and engagement by liking and commenting & follow to provide encouragement
HAPPY TRADING 👍

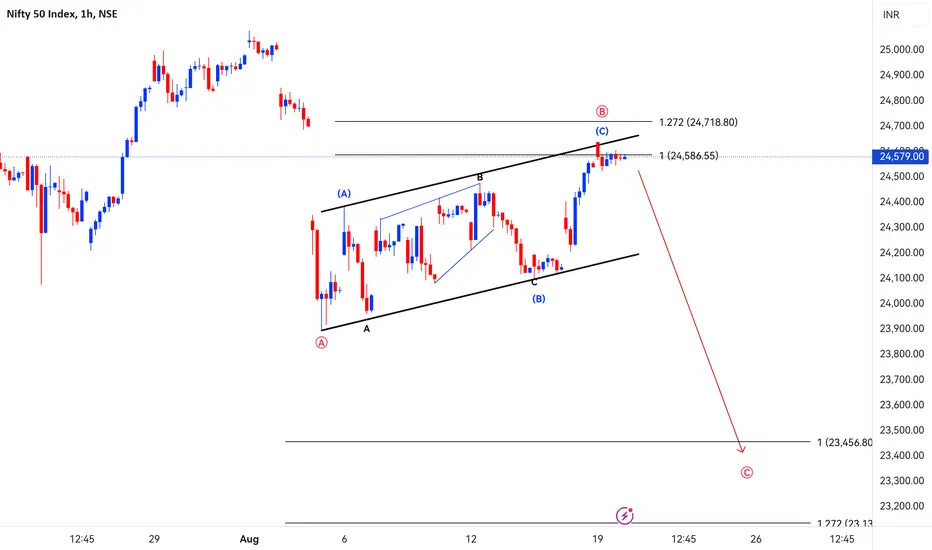
Nifty50 - Elliott Wave CountNifty50 - Elliott Wave Count
NSE:NIFTY NSEIX:NIFTY1! NSE:NIFTY1!
Nifty50 - Elliott Wave Count
NIFTY Podcast Strategy - 19Aug2024Missed the first trade, so took 2nd trade with credit spread and closed with minimal loss.

NIFTY INTRADAY LEVELS FOR 19 AUG 2024BUY ABOVE - 24590
SL - 24530
TARGETS - 24660,24710,24780
SELL BELOW - 24530
SL - 24590
TARGETS - 24460,24380,24320
NO TRADE ZONE - 24530 to 24590
Previous Day High - 24590
Previous Day Low - 24200
Based on price action major support & resistance's are here, the red lines acts as resistances, the green lines acts as supports. If the price breaks the support/resistance, it will move to the next support/resistance line. White lines indicates previous day high & low, high acts as a resistance & low acts as a support for next day.
Trendlines are also significant to price action. If the price is above/below the trendlines, can expect an UP/DOWN with aggressive move.
Please NOTE: this levels are for intraday trading only.
Disclaimer - All information on this page is for educational purposes only,
we are not SEBI Registered, Please consult a SEBI registered financial advisor for your financial matters before investing And taking any decision. We are not responsible for any profit/loss you made.
Request your support and engagement by liking and commenting & follow to provide encouragement
HAPPY TRADING 👍

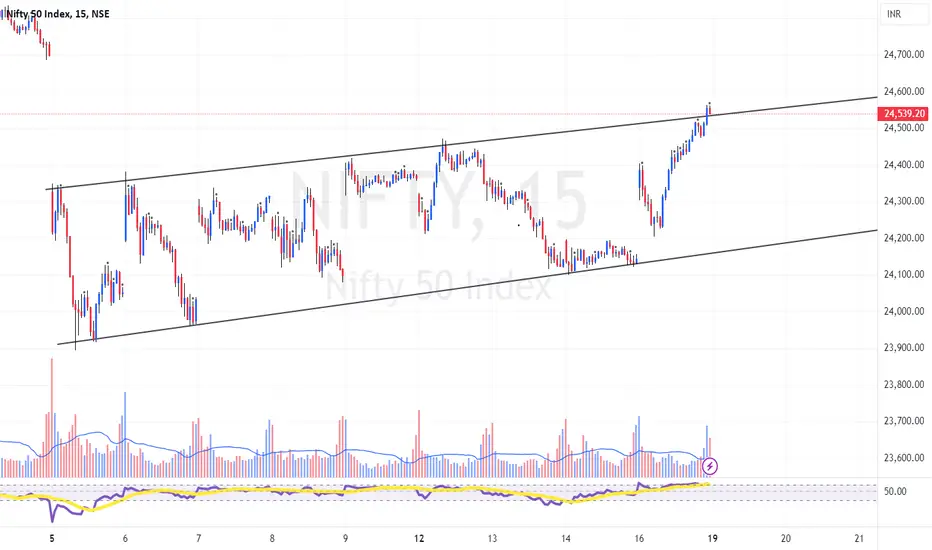
Rising wedge pattern at a (15 mins) lower time frameTechnical:
1) A rising wedge pattern was formed from 5th August until today.
2) At 3 pm today, a bullish candle crossed the upper trendline.
3) The following candle successfully sustained above the trendline.
4) Building on my previous Nifty idea on 06th Aug'24, the Nifty is still holding above the rising wedge trendline on a higher time frame
Please consider these points for educational purposes and let me know if anything can be added or modified technically.
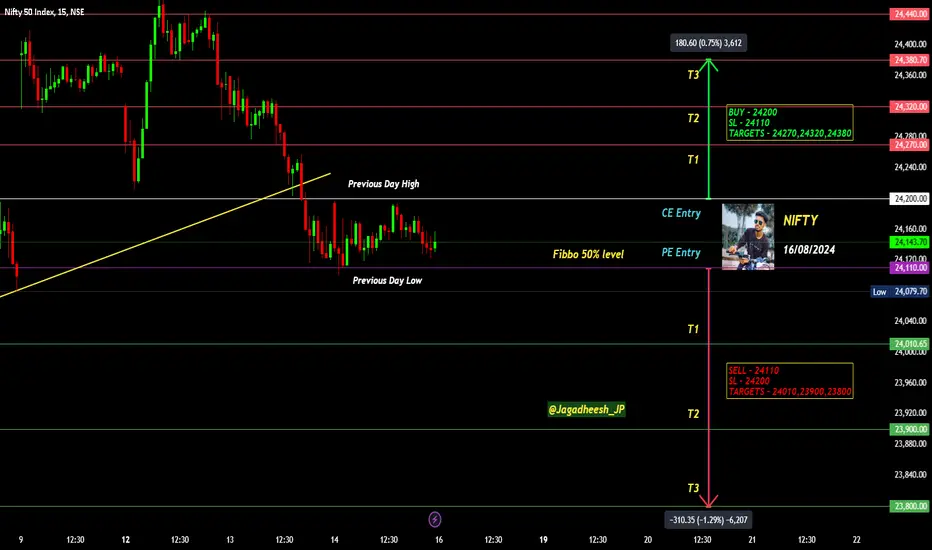
NIFTY INTRADAY LEVELS FOR 16/08/2024BUY ABOVE - 24200
SL - 24110
TARGETS - 24270,24320,24380
SELL BELOW - 24110
SL - 24200
TARGETS - 24010,23900,23800
NO TRADE ZONE - 24110 to 24200
Previous Day High - 24200
Previous Day Low - 24110
Based on price action major support & resistance's are here, the red lines acts as resistances, the green lines acts as supports. If the price breaks the support/resistance, it will move to the next support/resistance line. White lines indicates previous day high & low, high acts as a resistance & low acts as a support for next day.
Trendlines are also significant to price action. If the price is above/below the trendlines, can expect an UP/DOWN with aggressive move.
Please NOTE: this levels are for intraday trading only.
Disclaimer - All information on this page is for educational purposes only,
we are not SEBI Registered, Please consult a SEBI registered financial advisor for your financial matters before investing And taking any decision. We are not responsible for any profit/loss you made.
Request your support and engagement by liking and commenting & follow to provide encouragement
HAPPY TRADING 👍
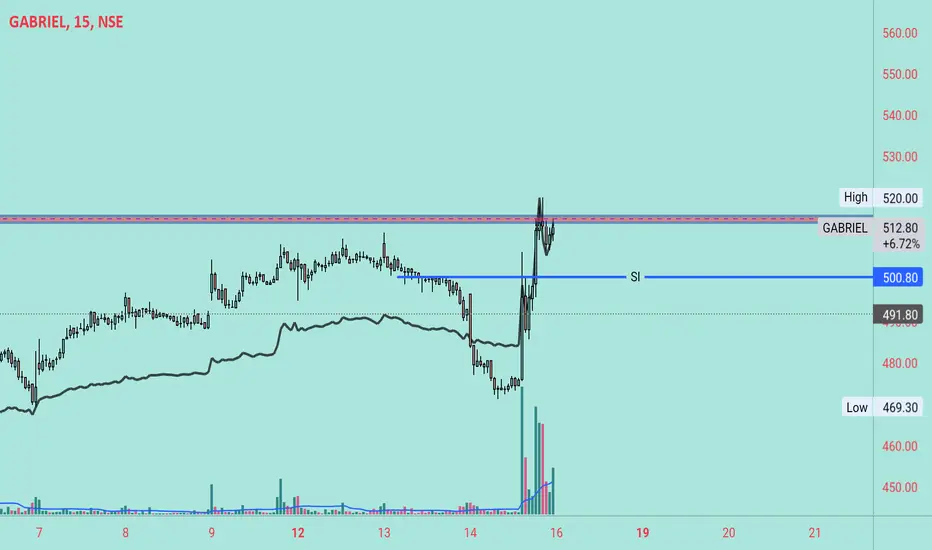
Gabrial movement swing stockLooking good volume build up,
My sl 2/3% max(500 below 15price sustain cut my position)
Entry 516 above 15min closed sustain entry
Target idk , just trailing, but expection 15/20%
NIFTY INTRADAY LEVELS FOR 14/08/2024BUY ABOVE - 24200
SL - 24110
TARGETS - 24270,24320,24380
SELL BELOW - 24110
SL - 24200
TARGETS - 24010,23900,23800
NO TRADE ZONE - 24110 to 24200
Previous Day High - 24380
Previous Day Low - 24110
Based on price action major support & resistance's are here, the red lines acts as resistances, the green lines acts as supports. If the price breaks the support/resistance, it will move to the next support/resistance line. White lines indicates previous day high & low, high acts as a resistance & low acts as a support for next day.
Trendlines are also significant to price action. If the price is above/below the trendlines, can expect an UP/DOWN with aggressive move.
Please NOTE: this levels are for intraday trading only.
Disclaimer - All information on this page is for educational purposes only,
we are not SEBI Registered, Please consult a SEBI registered financial advisor for your financial matters before investing And taking any decision. We are not responsible for any profit/loss you made.
Request your support and engagement by liking and commenting & follow to provide encouragement
HAPPY TRADING 👍

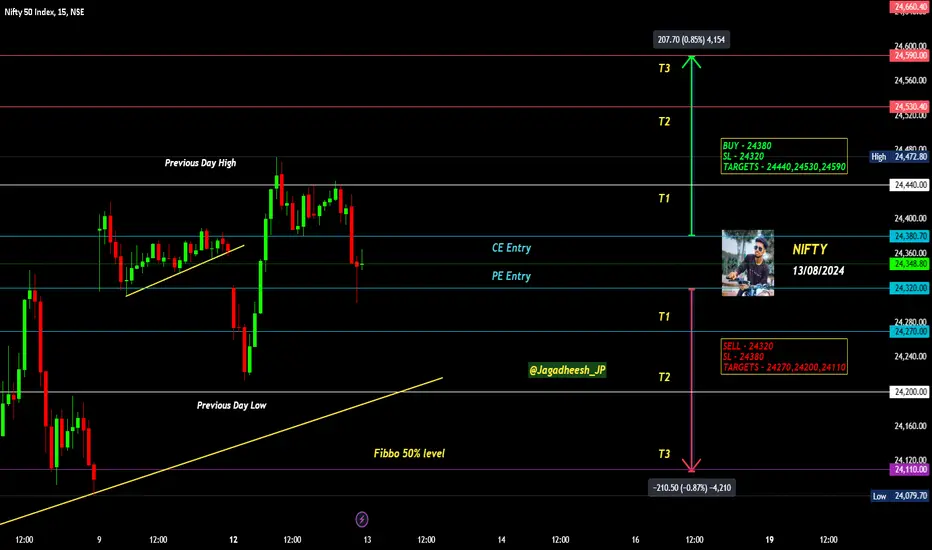
NIFTY INTRADAY LEVELS FOR 13 AUG 2024BUY ABOVE - 24380
SL - 24320
TARGETS - 24440,24530,24590
SELL BELOW - 24320
SL - 24380
TARGETS - 24270,24200,24110
NO TRADE ZONE - 24320 to 24380
Previous Day High - 24440
Previous Day Low - 24200
Based on price action major support & resistance's are here, the red lines acts as resistances, the green lines acts as supports. If the price breaks the support/resistance, it will move to the next support/resistance line. White lines indicates previous day high & low, high acts as a resistance & low acts as a support for next day.
Trendlines are also significant to price action. If the price is above/below the trendlines, can expect an UP/DOWN with aggressive move.
Please NOTE: this levels are for intraday trading only.
Disclaimer - All information on this page is for educational purposes only,
we are not SEBI Registered, Please consult a SEBI registered financial advisor for your financial matters before investing And taking any decision. We are not responsible for any profit/loss you made.
Request your support and engagement by liking and commenting & follow to provide encouragement
HAPPY TRADING 👍
Nifty Intraday Levels: 12-Aug-24 Nifty closed near Resistance Zone,
Wait for breakout or retest for long entry,
Bullish > 24470
Bearish< 24325
All important Zones Marked on zone for entry.

Nifty 50 analysis for coming week for 12th August to 16th AugustThis chart of the Nifty 50 Index on a 15 minute timeframe includes a Rising Wedge pattern and highlights several key levels and potential price movements. Here's the analysis:
Key Levels:
Immediate Resistance Levels:
24,516: A potential breakout point above which the index might move higher.
24,837: Another significant resistance level to watch if the price moves upward.
25,000: Key psychological and resistance levels that could be tested if the bullish momentum continues.
25,100: The upper target for a strong bullish move.
Support Levels:
24,385 (PW-VAH): Previous Week Value Area High, acting as a support zone.
24,265 - 24,228 (PM-POC): Previous Month Point of Control, an area where the price might find support.
24,140 (PM-VAL): Previous Month Value Area Low, a crucial support level.
24,000: A key psychological support level, also indicated on the chart.
23,920, 23,809, 23,681, and 23,595:
These are lower support levels, potentially in play if the price breaks below 24,000.
Chart Patterns:
Rising Wedge: A bearish pattern that suggests the price might break downwards after consolidating. It is currently testing the upper boundary of this pattern.
Predicted Movements:
Bullish Scenario:
If the price breaks above 24,516, it could move towards the 24,837 level. Further upward movement could target 25,000, 25,057, and possibly 25,100 if the bullish momentum is strong.
The green arrows indicate the possible upward targets.
Bearish Scenario:
If the price fails to break above 24,516 and starts to break down from the Rising Wedge, it could retest lower levels like 24,385, 24,265, and 24,228.
A significant break below 24,000 could lead to further downside, targeting 23,920, 23,809, 23,681, and 23,595.
The red arrows indicate the possible downward targets.
Conclusion:
Upside Potential: A breakout above 24,516 could lead to a test of higher levels up to 25,100.
Downside Risk: A break below 24,000 could initiate a stronger bearish move, targeting the lower support levels.
The movement will likely depend on how the price reacts around the 24,516 level and whether it breaks the Rising Wedge pattern upwards or downwards.

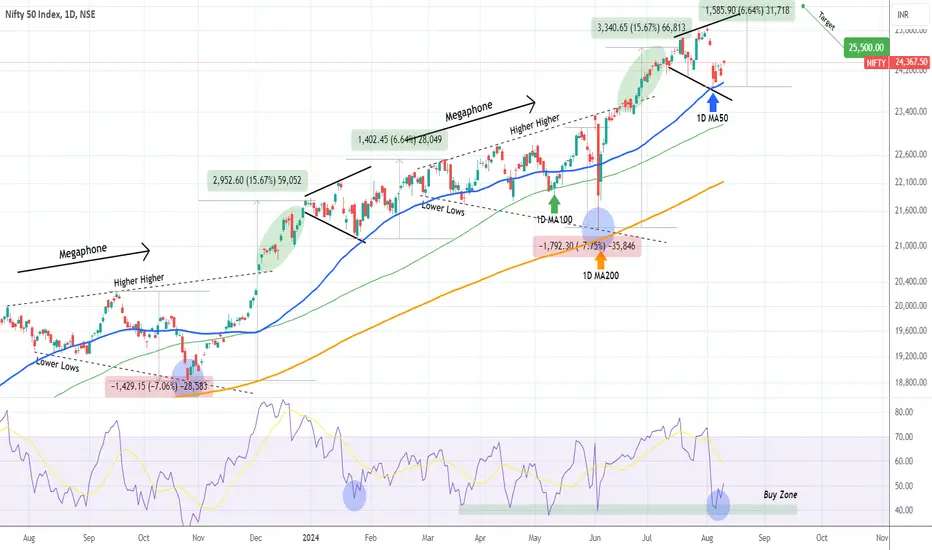
NIFTY Doing exactly what is expected from it.The Nifty 50 Index (NIFTY) continues to offer us some of the most effective trading opportunities as it continues to replicated the 2023 price action. Last time (June 13, see chart below), it broke as we expected above its Megaphone (imitating the December 04 2023 bullish break-out) and hit our 24650 Target, making a symmetrical +15.67% rise:
This time we are presented with another buy opportunity as following the recent drop, the index managed to find Support on the 1D MA50 (blue trend-line), exactly at the bottom of the short-term Megaphone. This is another remarkable symmetric structure with the January 24 Low. On top of that, the 1D RSI rebounded on its 5-month Support Zone.
That Jan 24 low initiated a slow rise that completed a +6.64% uptrend before the 1D MA50 broke. As a result, we consider this a strong medium-term buy opportunity, with a 25500 Target (+6.64%).
-------------------------------------------------------------------------------
** Please LIKE 👍, FOLLOW ✅, SHARE 🙌 and COMMENT ✍ if you enjoy this idea! Also share your ideas and charts in the comments section below! This is best way to keep it relevant, support us, keep the content here free and allow the idea to reach as many people as possible. **
-------------------------------------------------------------------------------
💸💸💸💸💸💸
👇 👇 👇 👇 👇 👇
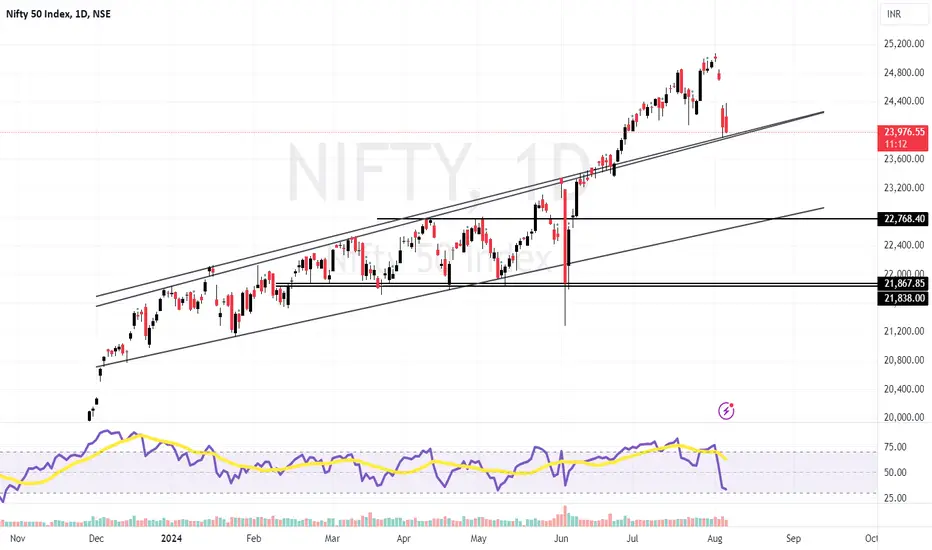
Nifty Consolidating? What's Next?After a turmoil in the US and Japanese market, the ripple effect led the Indian markets to fall on an average 4% on Monday.
This crash has led to correction of an overvalued market, as per analysts.
The market seems to be at a decent valuation and investors who have missed the opportunity, might enter and join the bandwagon of India's growth story.
Let us look at Nifty50's chart on Daily Timeframe:
Previous support: 23890
a level where price should stay and give a bullish sign: 24211

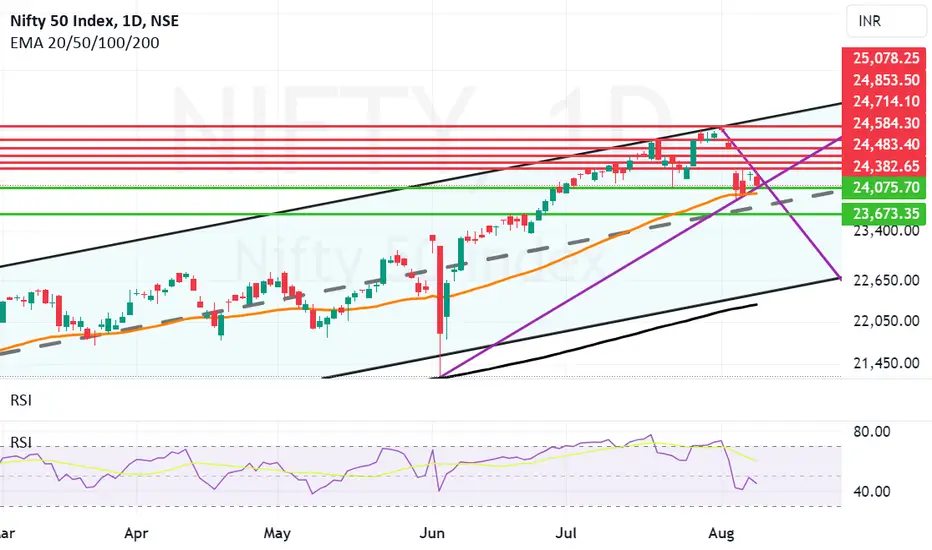
Mother line yet again supports and zone 24340 to 24382 resists.Mother line yet again comes to rescue of Nifty after the zone between 24340 and 24382 stops the growth of Nifty yet again. Once this zone is crossed only then Bulls can breath easily. Trend line resistance has also come into effect with absolutely no room for Nifty to go. So there should be a breakout in Nifty in either direction tomorrow. Shadows of the candles are green and positive due to the mother line support at 23983. So hopefully the breakout should be on the positive side. Resistance levels 24340, 24382, 24584 and 24714. The supports on the lower side are 24075, 23983 and 23673.
NIFTY INTRADAY LEVELS FOR 08/08/2024BUY ABOVE - 24360
SL - 24270
TARGETS - 24440,24530,24590
SELL BELOW - 24200
SL - 24270
TARGETS - 24130,24010,23900
NO TRADE ZONE - 24200 to 24360
Previous Day High - 24360
Previous Day Low - 24200
Based on price action major support & resistance's are here, the red lines acts as resistances, the green lines acts as supports. If the price breaks the support/resistance, it will move to the next support/resistance line. White lines indicates previous day high & low, high acts as a resistance & low acts as a support for next day.
Trendlines are also significant to price action. If the price is above/below the trendlines, can expect an UP/DOWN with aggressive move.
Please NOTE: this levels are for intraday trading only.
Disclaimer - All information on this page is for educational purposes only,
we are not SEBI Registered, Please consult a SEBI registered financial advisor for your financial matters before investing And taking any decision. We are not responsible for any profit/loss you made.
Request your support and engagement by liking and commenting & follow to provide encouragement
HAPPY TRADING 👍

Good bounce back by Nifty after Mother Line confirms support. Good bounce back by Nifty after Mother Line confirms support. But we are still not out of the woods as there is a resistance zone near high of the today that is 24337 and 24382. (This is the resistance created by the gap down opening on 5th August.
The starting and ending point of Such massive gaps always acts as a resistance zone while going up. The best way to cross this resistance will be a gap up opening. 24483 is another point which was the starting of this gap which will also act as a resistance on the way up.
Once that is crossed we can look forward to reaching the next resistance levels of 24584 and 24714. Supports on the lower side for Nifty are at 24183, 24075 and 23978 (Mother Line 50 day's EMA). Below this level only two supports remaining will be 23912 and 23673. We can again be in this unlikely zone as of now only if there is some major bad news overnight otherwise shadow of the candles is looking positive.
The above information is provided for educational purpose, analysis and paper trading only. Please don't treat this as a buy or sell recommendation for the stock. We do not guarantee any success in highly volatile market or otherwise. Stock market investment is subject to market risks which include global and regional risks. We will not be responsible for any Profit or loss that may occur due to any financial decision taken based on any data provided in this message.

NIFTY INTRADAY LEVELS FOR 07/08/2024BUY ABOVE - 24130
SL - 24010
TARGETS - 247220,24360,24440
SELL BELOW - 24010
SL - 24130
TARGETS - 23900,23800,23740
NO TRADE ZONE - 24010 to 24130
Previous Day High - 24360
Previous Day Low - 23900
Based on price action major support & resistance's are here, the red lines acts as resistances, the green lines acts as supports. If the price breaks the support/resistance, it will move to the next support/resistance line. White lines indicates previous day high & low, high acts as a resistance & low acts as a support for next day.
Trendlines are also significant to price action. If the price is above/below the trendlines, can expect an UP/DOWN with aggressive move.
Please NOTE: this levels are for intraday trading only.
Disclaimer - All information on this page is for educational purposes only,
we are not SEBI Registered, Please consult a SEBI registered financial advisor for your financial matters before investing And taking any decision. We are not responsible for any profit/loss you made.
Request your support and engagement by liking and commenting & follow to provide encouragement
HAPPY TRADING 👍

Mother line again came to rescue Nifty but can it hold?Mother line or 50 days EMA again comes to rescue of Nifty today. There was a huge selling pressure when the Nifty reached day's high that is 24382. Market has closed at 23992 and the 50 days EMA is at 23965. As of now 50 days EMA is respected but the mood seems to be sell on rise so the support is becoming weaker. If 50 days EMA or Mother line is broken on closing during the reminder of the week. There can be increased pressure on Bulls as Bears will try to explore further supports.
Supports for Nifty as of now seem to be at 23965 (Important Mother line support 50 day's EMA), 23673 and 23362. The zone between 22788 and 22259 is very important as of now. 22259 is 200 day's EMA or father line support, 22641 is the channel bottom support and 22788 is an important support of bottom of the big candle formed on 7th June. Resistance for Nifty remain at zone between 22214 and today's high of 22384.
If you want to know more about Mother father and small child story and how 50 and 200 day's EMA play the role of mother and father you need to read the book The Happy Candles Way to wealth creation written by me and available on Amazon in Kindle and Paperback version.
This will be a big resistance to cross as above it is gap formed by gap down opening of 5th August. If this gap is crossed the next resistance will be at 24714. Shadow of the candles is red still. RSI 40 and Mother line saved the day today let us see if these levels can hold. If these levels are held upside is possible.
The above information is provided for educational purpose, analysis and paper trading only. Please don't treat this as a buy or sell recommendation for the stock. We do not guarantee any success in highly volatile market or otherwise. Stock market investment is subject to market risks which include global and regional risks. We will not be responsible for any Profit or loss that may occur due to any financial decision taken based on any data provided in this message.

NIFTY FALL OR BOUNCETechnicals:
1) Nifty is just above the Rising Wedge pattern
2) May fall or bounce from the pattern lines
***Disclaimer: The above details are only for educational purposes.
Mother Line comes to rescue for the Nifty today but can it hold?Mother Line or the 50 days EMA comes to rescue for the Nifty today but can it hold? It looks little difficult due to the global Bear onslaught. In such situations we know from the Father, Mother and the small Child story that mostly Father line of 200 days EMA can provide proper support. However before we reach there and not necessarily we reach there as there are some important supports for Nifty. The other supports for Nifty from where it can potentially make a turnaround seem to be at: 23963 (Mother Line provides support again / Support confirmation), 23673 is the mid channel support, 22788 to 22641 is also a good support zone. Below 22641 we have Father line support at 22242. Final support for Nifty is 21879. Resistances on the upper side are now at 24214, 24342 and 24714. Shadow of the candles are still dark red.
To know more about the father, mother and small child story read my book The Happy Candles Way to wealth creation available on Amazon in Paperback and E-book version.
The above information is provided for educational purpose, analysis and paper trading only. Please don't treat this as a buy or sell recommendation for the stock. We do not guarantee any success in highly volatile market or otherwise. Stock market investment is subject to market risks which include global and regional risks. We will not be responsible for any Profit or loss that may occur due to any financial decision taken based on any data provided in this message.
