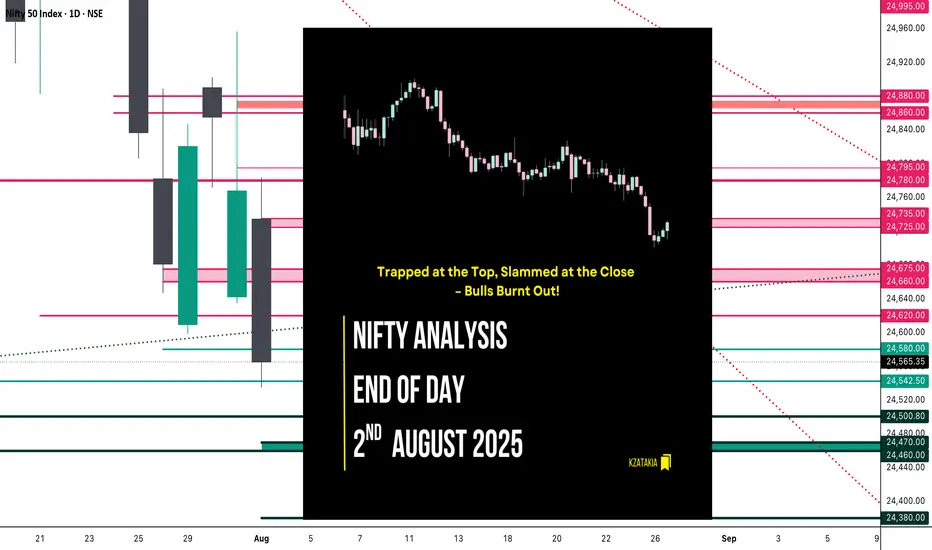
Nifty Analysis EOD – August 2, 2025 – Friday🟢 Nifty Analysis EOD – August 2, 2025 – Friday 🔴
Trapped at the Top, Slammed at the Close – Bulls Burnt Out!
🗓️ Nifty Summary
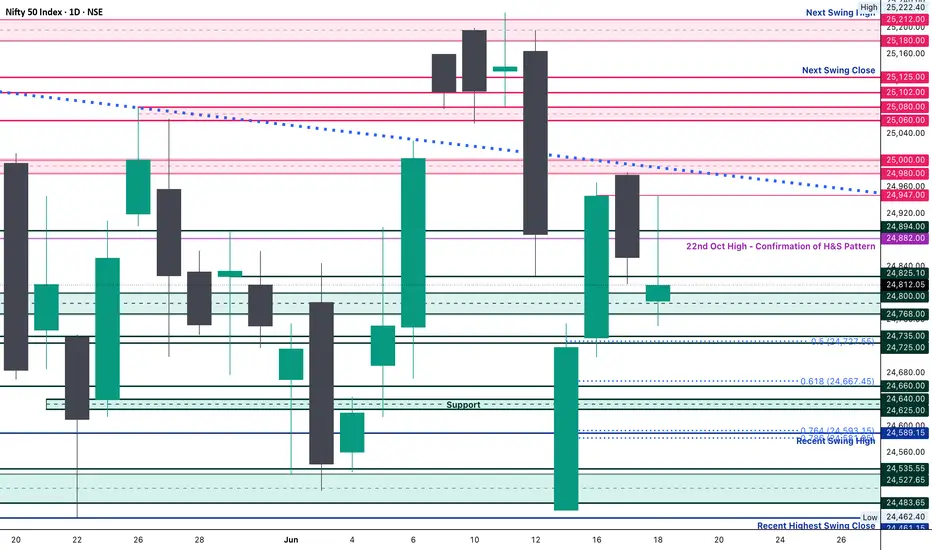
With the continuation of yesterday's hidden weakness, today's session gave early hope but ended with a bearish surprise. Nifty opened near the key support zone of 24,735 ~ 24,725, hovered indecisively, then suddenly rallied to 24,780, trapping bulls just under resistance.
But the trap was set.
A sharp reversal followed as Nifty broke not just the day’s low, but also the previous day’s support zone of 24,660 ~ 24,675, pulling the index lower into the 24,565.35 close — the second lowest close since May 12.
A fierce 2–3 hour tug-of-war between bulls and bears took place in a tight 40–50 point range until 2:50 PM, when bulls gave up—leading to a 100+ point fall in the last half-hour. shocked many traders, especially those fatigued from the earlier choppy action.
Much like yesterday, both sides of the trade were available today.
Did you catch them?
Zoom Out View :
Today’s close is just 23 points above the June 3 close, wiping out nearly 59 sessions (81 days) of gain.
Will the zone of 24460 ~ 24542 provide support again, or are we headed for a retest of the 24000 ~ 23800 and 23200 ~ 22800 (Pattern Target and Virgin) range?
Yes, you read correctly 23200 ~ 22800…!
Not so soon…but eventually…!
wish you tell me crazy and hope I am wrong…!
📈 5 Min Time Frame Chart with Intraday Levels
📉 Daily Time Frame Chart with Intraday Levels
🕯️ Daily Candle Breakdown
Open: 24,734.90
High: 24,784.15
Low: 24,535.05
Close: 24,565.35
Change: −203.00 (−0.82%)
Candle Structure
🔴 Large bearish body (169.55 pts)
☁️ Moderate upper wick (49.25 pts)
⬇️ Short lower wick (30.30 pts)
Interpretation
Opened lower, climbed early but failed at 24,780+.
Selling dominated the rest of the session, closing near lows.
Moderate upper wick shows early bullish attempt was rejected.
Candle Type
Bearish Marubozu-like – clear seller dominance.
Key Insight
Sellers defended 24,780–24,800 zone.
Closing near 24,560 keeps the short-term bias bearish.
Next support: 24,500, 24,470 ~ 24460
⚠️ Bulls must reclaim 24,735+ on closing basis to neutralize sentiment.
🛡 5 Min Intraday Chart
⚔️ Gladiator Strategy Update
ATR: 212.37
IB Range: 87.55 → Medium
Market Structure: Balanced
Trades Triggered
🕙 10:05 AM – Long Entry → 🎯 Target Hit (R:R – 1:1)
🕚 11:09 AM – Short Entry → 🎯 Target Hit (R:R – 1:2)
🔍 Trade Summary
Both sides were offered—clean hit on long and solid breakdown on short. A Gladiator’s delight.
📊 Support & Resistance Levels
🔼 Resistance Zones
24620
24660 ~ 24675
24725 ~ 24735
24780 ~ 24795
24860 ~ 24880
🔽 Support Zones
24,542 ~ 24,535
24,500
24,470 ~ 24,460
24,380
💬 Final Thoughts
"Traps are laid where confidence is highest. Stay alert, stay flexible."
A textbook day where patience paid off — those who didn’t force trades were rewarded with clean moves in both directions.
✏️ Disclaimer
This is just my personal viewpoint. Always consult your financial advisor before taking any action.
Nifty50analysis
Nifty Analysis EOD – July 29, 2025 – Tuesday🟢 Nifty Analysis EOD – July 29, 2025 – Tuesday 🔴
Bulls Strike Back After Trendline Trap & Break
Nifty started below the previous day's low, and after marking day low at 24,598.60, it rose to 24,725 where it faced the trendline and CPR zone. A sharp rejection from there quickly pushed Nifty back to the day's open level. A base-building process began, characterized by a low-range but high-volatility phase.
Gradually, Nifty crossed the VWAP and the trendline again, breaking the day's high and CPR zone, ultimately reaching R1 and closing near the highest point at 24,830.40.
In the first half, both long and short traders got trapped in fast swings—refer to the chart for visual cues.
🕯 5 Min Time Frame Chart with Intraday Levels
🔄 Trend & Zone Update
📈 Resistance Zone Shifted To: 25,110 ~ 25,090
📉 Support Zone Shifted To: 24,520 ~ 24,480
🕯 Daily Time Frame Chart with Intraday Levels
🕯 Daily Candle Breakdown
Open: 24,609.65
High: 24,847.15
Low: 24,598.60
Close: 24,821.10
Change: +140.20 (+0.57%)
🕯Candle Structure Breakdown:
Real Body: Green candle (Close > Open):
24,821.10 − 24,609.65 = 211.45 pts (large bullish body)
Upper Wick: 26.05 pts (small)
Lower Wick: 11.05 pts (very small)
🕯Interpretation:
Market opened lower but found strong buying support, rallying to nearly 24,850.
Closed near the day’s high—bulls dominated.
Tiny lower wick shows hardly any selling pressure after the open.
🕯Candle Type:
Bullish Marubozu-type — strong signal of reversal or continuation, indicating control by buyers.
🕯Key Insight:
Strong bounce from sub-24,600 back above 24,800 has improved short-term sentiment.
If 24,830–24,850 breaks in the next session, potential upside till 24,920–24,995.
Support now shifts to 24,700–24,720.
🛡 5 Min Intraday Chart
⚔️ Gladiator Strategy Update
ATR: 202.98
IB Range: 128.5 → Medium
Market Structure: Balanced
Trades Triggered:
🕒 11:10 AM – Long Entry → Target Hit 🎯 (1:3 Risk:Reward)
🧱 Support & Resistance Levels
Resistance Zones:
24,815 ~ 24,830
24,850
24,920
24,995
Support Zones:
24,725
24,693
24,660 ~ 24,650
🧠 Final Thoughts
“Volatility shakes the weak hands; structure empowers the patient.”
Today’s session was a textbook example of how the market tests conviction. After trapping early traders with sharp intraday swings, Nifty rewarded those who respected structure and waited for confirmation. The reclaim of the trendline, VWAP, and CPR zone reinforced the strength of bullish intent. If the momentum continues above 24,850, we may be entering a fresh leg of the uptrend—stay nimble, but don't lose sight of the bigger picture.
✏️ Disclaimer
This is just my personal viewpoint. Always consult your financial advisor before taking any action.

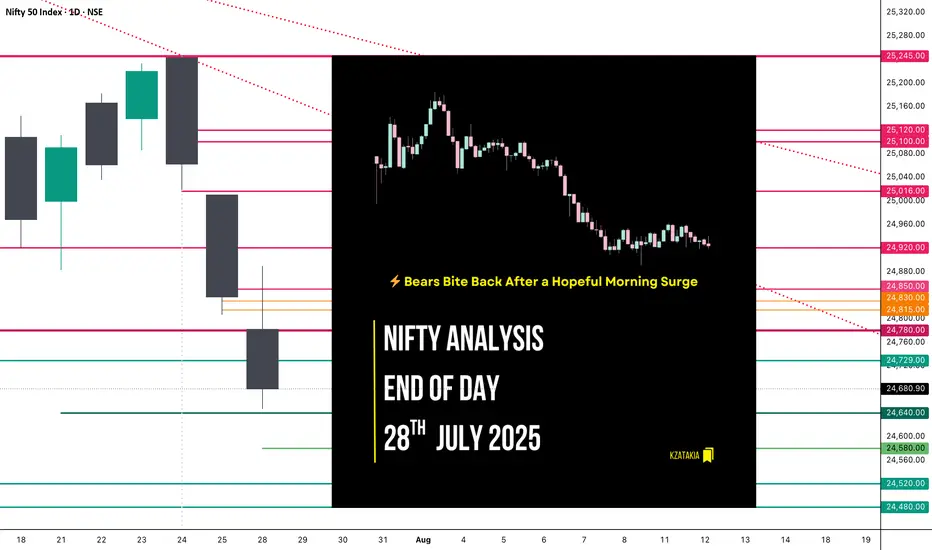
Nifty Analysis EOD – July 28, 2025 – Monday 🟢 Nifty Analysis EOD – July 28, 2025 – Monday 🔴
⚡️ Bears Bite Back After a Hopeful Morning Surge
📊 Nifty Summary
Nifty opened with a minor gap-down of 32 points and slipped an additional 67 points in the first 3 minutes, testing the critical support zone of 24,755 ~ 24,729. After marking a day low at 24,732.70, it witnessed a sharp recovery breaching key levels — CDO, Gap, PDC — and touched the CPR BC level. Rejection from there caused a retracement to the mean, followed by another successful attempt breaching CPR BC and IB High. However, it couldn’t sustain above, as profit booking and pressure from a higher time frame bearish trendline dragged the index below the CPR zone and even past the PDL.
Support at 24,780 offered brief relief, but a bearish triangle formed between the HTF trendline and that support and The breakdown at 12:40 led to a clean move, with the pattern target achieved.
🕯 5 Min Time Frame Chart with Intraday Levels
🔁 Trend & Zone Update
📍 Resistance Zone Shifted To: 25,100 ~ 25,120
📍 Support Zone Shifted To: 24,520 ~ 24,480
🧭 What If Plans – 29th July Outlook
🅰️ Plan A (Contra Long Setup)
If market opens inside the previous day range and finds support at 24,700 ~ 24,729,
→ Potential targets: 24,780, 24,815, 24,840
🅱️ Plan B (Trend is Friend – Short Continuation)
If market opens inside range and faces resistance around 24,830 ~ 24,815,
→ Aim for: 24,780, 24,720, 24,640, 24,580
🔄 On-the-Go Plan
If market Gaps Up/Down outside previous day’s range,
→ Wait for IB formation and act based on structure & S/R levels.
🕯 Daily Time Frame Chart with Intraday Levels
🕯 Daily Candle Breakdown
Open: 24,782.45
High: 24,889.20
Low: 24,646.60
Close: 24,680.90
Change: −156.10 (−0.63%)
🕯 Candle Structure Breakdown:
Real Body: 101.55 pts (Red candle, bearish)
Upper Wick: 106.75 pts (Long — rejection from highs)
Lower Wick: 34.30 pts (Defended slightly)
🕯 Interpretation:
Tried to rally above 24,880 but faced aggressive selling. Closed well below open, forming a bearish rejection candle resembling a shooting star. Bears clearly took control after the intraday bounce attempt.
🕯 Key Insight:
Selling pressure visible from 24,880–24,900 zone.
Close below 24,700 keeps bearish tone intact.
Next Support: 24,650–24,620.
Bulls' challenge: Reclaim and close above 24,850.
🛡 5 Min Intraday Chart
⚔️ Gladiator Strategy Update
ATR: 197.91
IB Range: 122 → Medium
Market Structure: Imbalanced
Trades Triggered:
09:27 – Long Entry → 🎯 Target Hit (1:1.5 R:R)
12:40 – Short Entry → 🎯 Target Hit (1:2.5 R:R)
🧱 Support & Resistance Levels
Resistance Zones:
📍 24,729
📍 24,780
📍 24,815 ~ 24,830
📍 24,850
📍 24,920
Support Zones:
📍 24,640
📍 24,580
📍 24,520 ~ 24,480
💭 Final Thoughts
🧠 “Every breakout starts with hesitation — but not every hesitation leads to a breakout.”
Today’s structure showed strong indecision, but sellers used it to dominate.
Monday’s triangle breakdown proved that structure plus patience = power. Keep your bias flexible and trust your levels.
✏️ Disclaimer
This is just my personal viewpoint. Always consult your financial advisor before taking any action.
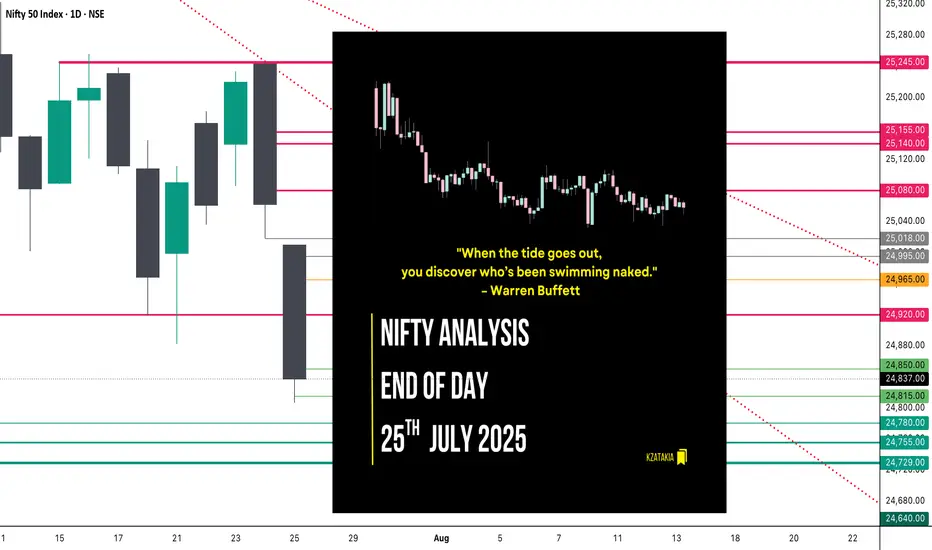
Nifty Analysis EOD – July 25, 2025 – Friday🟢 Nifty Analysis EOD – July 25, 2025 – Friday 🔴
"When the tide goes out, you discover who’s been swimming naked." – Warren Buffett
Nifty GapDowns Below Key Support and Slips Further
The market opened with a sharp GapDown, breaching the previous day's low and instantly shedding 150 points within the first hour. Nifty attempted to find footing near the crucial 21st July low zone of 24,850–24,880, but the support gave way, slipping an additional 50 points.
The day mostly drifted around these lower levels with bearish dominance. Though bulls made an effort to recover late in the session, it lacked strength. The index finally settled at 24,837, decisively closing below the 21st July low — signalling a deeper structural breakdown.
📉 Trend & Zone Update
Resistance Zone Shifted To: 25,144 ~ 25,155
Support Zone Shifted To: 24,729 ~ 24,755
📊 What If Plans – 28th July Outlook
🅰️ Plan A (Contra Long Setup)
If market opens inside the previous day range and finds support at 24,815 ~ 24,850
Then potential targets are 24,920, 24,965, and 25,020
🅱️ Plan B (Trend is Friend – Short Continuation)
If market opens inside range and faces resistance around 24,965 ~ 24,995
Then aim for 24,850, 24,815, 24,780, and 24,730
⏸️ On-the-Go Plan
If market Gaps Up/Down outside previous day’s range
Then wait for the Initial Balance (IB) to form and act based on structure and S/R levels.
🕯 Daily Time Frame Chart with Intraday Levels
🕯 Daily Candle Breakdown
Open: 25,010.35
High: 25,010.35
Low: 24,806.35
Close: 24,837.00
Candle Structure
Body: Strong red candle (−173.35 pts)
Upper Wick: None (open = high)
Lower Wick: 30.65 pts
Interpretation:
A textbook bearish Marubozu — shows sellers had control throughout.
Bears stepped in immediately from open, preventing any bullish response.
Minimal lower wick implies limited buyer defense even at the session low.
Key Insight:
Bears are in command; bulls must reclaim 25,000+ quickly to prevent further downside.
If 24,800–24,820 breaks, eyes shift to 24,700–24,750 zone next.
🛡 5 Min Intraday Chart
⚔️ Gladiator Strategy Update
ATR: 192.95
IB Range: 87.4 → Medium
Market Structure: Imbalanced
Trades Triggered:
🕙 10:10 AM – Short Entry → 🎯 Target Hit (1:2.4 R:R)
🧭 Support & Resistance Levels
Resistance Zones
24,920
24,965
24,995 ~ 25,018
25,080
25,140 ~ 25,155
Support Zones
24,780
24,755 ~ 24,729
24,640
📌 Final Thoughts
When strong candles appear back-to-back with no meaningful recovery in between, it’s not just a correction — it’s a statement. In this market phase, reacting to price structure rather than assumptions will keep you on the right side. Stay nimble, stay prepared.
✏️ Disclaimer
This is just my personal viewpoint. Always consult your financial advisor before taking any action.
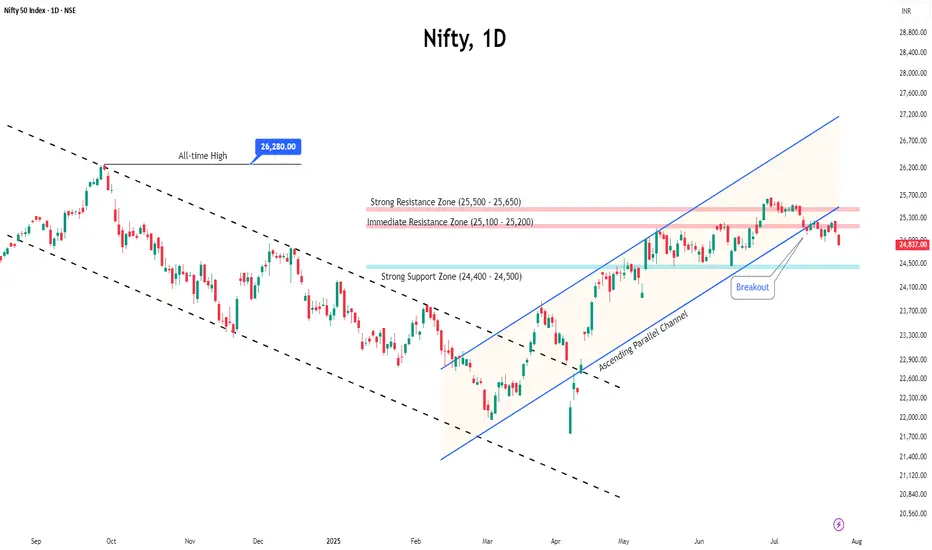
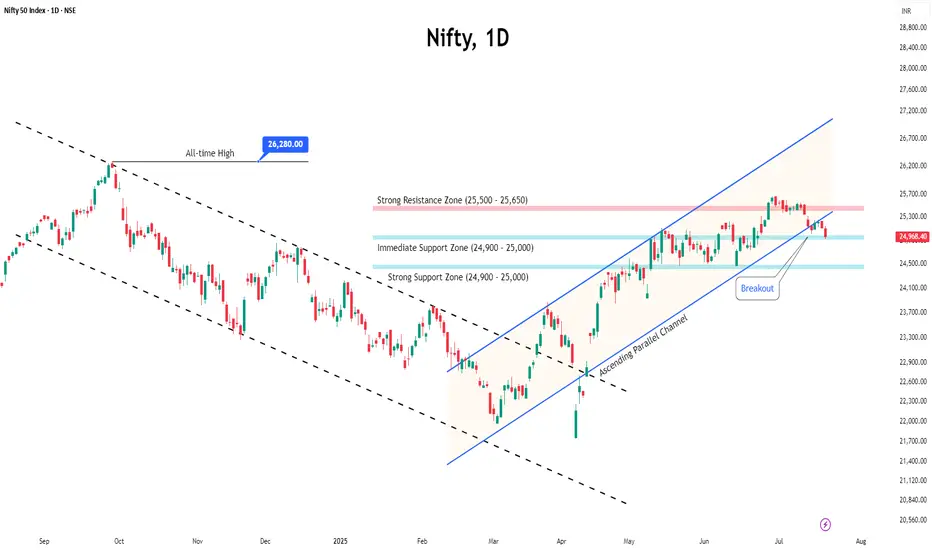
Pressure Builds on Nifty Before ExpiryThe Nifty traded in a tight range for most of the week but eventually slipped below the 25,000 mark, ending on a weak note.
With the monthly expiry approaching, the index is likely to remain under pressure, and volatility may pick up in the coming sessions.
Key resistance levels are seen at 25,200 and 25,500. A decisive move above 25,500 could trigger an upside breakout. On the downside, support is expected around 24,500 and 24,400.
Given the current structure, traders are advised to stay cautious, focus on selective opportunities, and avoid aggressive positions until a clearer trend emerges.
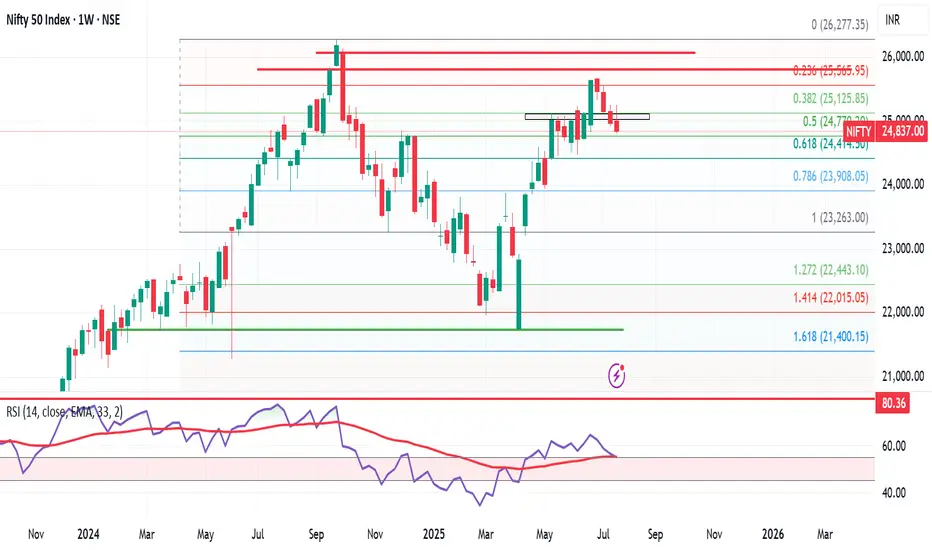
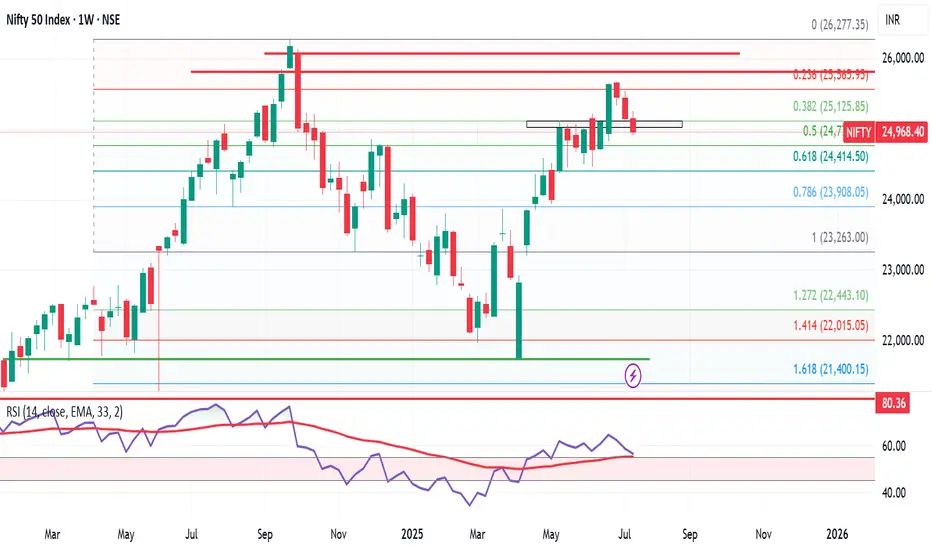
Nifty Weekly Market Update – Brace for Bearish Momentum? Nifty ended the week at 24,837, down 131 points from last week’s close. It made a high of 25,246 and a low of 24,806, staying perfectly within my projected range of 25,400–24,500.
As highlighted earlier, Nifty has now formed an inverted hammer on the weekly chart — a classic bearish reversal candlestick. 🔍
📅 Flashback: On 6th July, I mentioned giving bulls 10–15 days of playtime. That phase seems to be ending. The monthly time frame remains bearish, and now the weekly chart is aligning, indicating a stronger downside risk.
🔮 What’s Next?
👉 Expect Nifty to trade between 25,300–24,400 in the coming week.
👉 A break below 24,400 could open doors to 23,900.
👉 If 24,400 holds, bulls may still have a chance to regroup.
🧠 Pro Tip: Only Nifty Pharma is showing resilience. Those looking for long trades should focus on strong pharma stocks — the rest of the sectors are showing bearish signs.
Meanwhile in the US:
S&P 500 hits another all-time high, closing at 6,388, up 90 points from last week. My long-standing target of 6,568 now looks well within reach.
But here’s the catch — despite US strength, it’s not supporting Indian markets. If US markets correct, expect intensified selling pressure in India.
🎯 Strategy for Indian investors:
Let the bears rule till 7–8 August. Stay alert, and be ready to grab high-quality stocks at bargain prices. This is not the time to panic, but to prepare smartly.
Nifty Analysis EOD – July 24, 2025 – Thursday 🟢 Nifty Analysis EOD – July 24, 2025 – Thursday 🔴
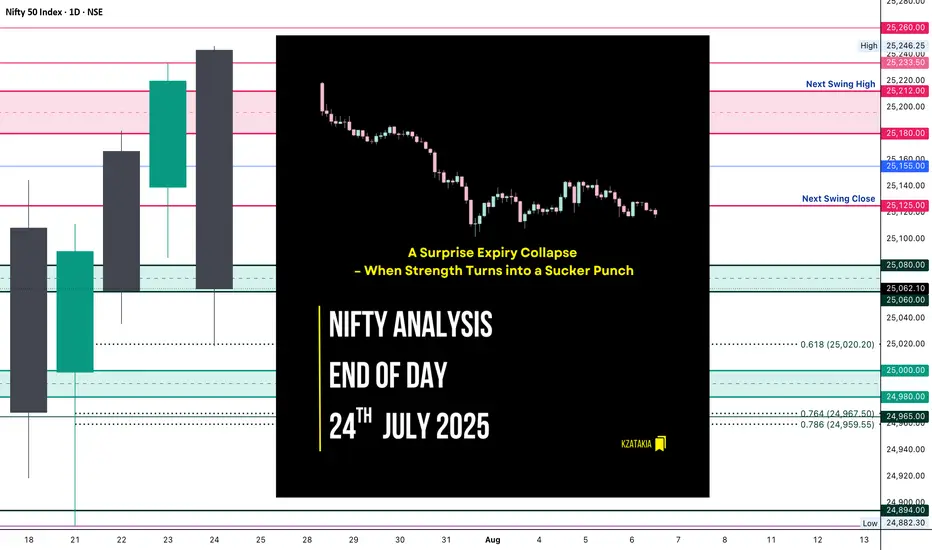
📉 A Surprise Expiry Collapse – When Strength Turns into a Sucker Punch
Today’s session was an unexpected twist.
Nifty opened above the previous day’s high, giving early hope to the bulls—but within the first hour, it slipped to 25,155 and formed its IB. What followed was a sharp 136-point fall, breaking not just yesterday’s low, but also the July 22nd low. This sudden bearish momentum was completely news-driven, and expiry-day long unwinding only added fuel to the fire.
Despite a strong close yesterday, today’s fall erased all of July 23rd’s gains and brought us right back to July 22nd’s close—neutralizing the recent upward effort.
The day closed at 25,062, marginally above key support. Technically, today’s low respected the 0.618 Fib retracement level drawn from July 21st’s low to July 23rd’s high—so a dead cat bounce is possible if no further bad news hits. But if we open below 25,050 tomorrow, expect more downside pressure toward 24,960–24,890 zones.
🕯 5 Min Time Frame Chart with Intraday Levels
🕯 Daily Time Frame Chart with Intraday Levels
🕯 Daily Candle Breakdown
Open: 25,243.30
High: 25,246.25
Low: 25,018.70
Close: 25,062.10
Change: −157.80 (−0.63%)
Candle Structure Analysis:
🔴 Body: Large red body (181.2 pts) shows strong intraday selling.
☁️ Upper Wick: Tiny (2.95 pts) → sellers dominated from the start.
🌊 Lower Wick: Moderate (43.4 pts) → small recovery near close.
Candle Type:
Almost a bearish Marubozu — clear domination by sellers with barely any upper shadow, signaling intense sell pressure.
Key Insight:
Bulls lost control after open.
Bears took charge below 25,155.
Close near support, but bias cautious.
Bulls must reclaim 25,150+ for recovery, else 25,000 may give way.
🛡 5 Min Intraday Chart
⚔️ Gladiator Strategy Update
ATR: 185.97
IB Range: 83.55 → Medium
Market Structure: Balanced
Trades Triggered:
⏰ 10:05 AM – Short Entry → SL Hit
⏰ 11:10 AM – Short Entry → Target Hit (1:3.6 Risk:Reward)
📊 Support & Resistance Levels
Resistance Zones:
25,125
25,155
25,180 ~ 25,212
25,233
Support Zones:
25,080 ~ 25,060
25,020
25,000 ~ 24,980
24,967 ~ 24,959
24,882
🔮 What’s Next?
A gap-up or stable open may trigger a dead cat bounce toward 25,150–25,180.
A gap-down below 25,050 confirms bearish continuation → next targets: 24,960 / 24,890.
Watch price action around the 25,020–25,060 zone closely.
🧠 Final Thoughts
“Markets are never wrong – opinions often are.”
— Jesse Livermore
Today was a reminder of how expiry day surprises and news flows can flip the narrative. Stay flexible, and keep a bias—but not a blind one.
✏️ Disclaimer
This is just my personal viewpoint. Always consult your financial advisor before taking any action.
Nifty Analysis EOD – July 23, 2025 – Wednesday 🟢 Nifty Analysis EOD – July 23, 2025 – Wednesday 🔴
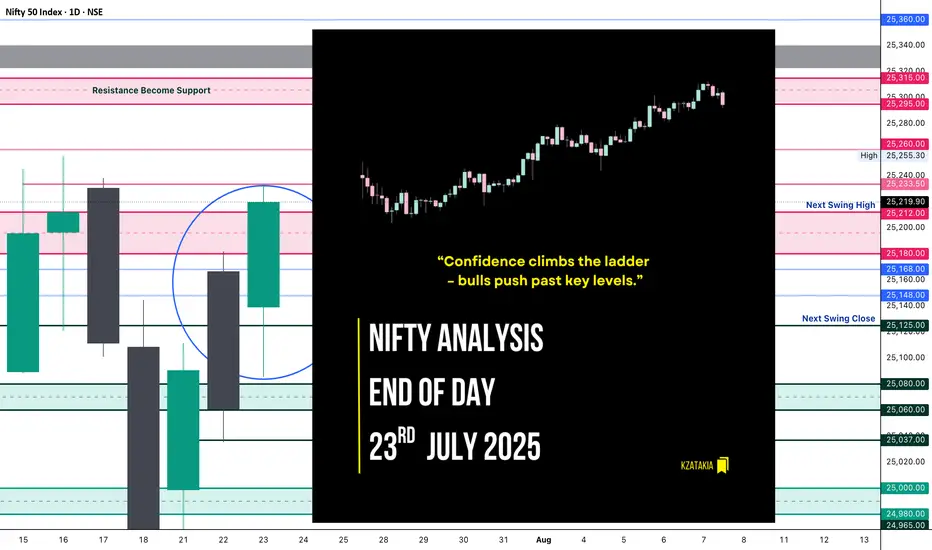
“Confidence climbs the ladder – bulls push past key levels.”
Nifty opened with a Gap Up of 78 points and initially retraced 54 points, finding solid footing around the CPR Zone. Once reclaimed VWAP, the index climbed in a methodical, low-volatility uptrend, breaking one resistance after another: CDH, R1, 25150, PDH, and the key zone 25200~25212 — finally touching the anticipated resistance at 25333, and closing just below that at 25219.90, close to the day’s high.
📌 Flashback from Yesterday's Note:
“If this is truly a retracement, 25K must hold in upcoming sessions, and bulls will need to reclaim 25,200 to regain their grip.”
👉 This expectation played out to perfection today — gradual yet confident bullish strength led Nifty to reclaim 25200 and close above it.
🔍 Today’s close of 25220 is higher than the last 7 sessions, suggesting a bullish shift in structure. However, bulls now face the real test — breaching the 25300 ~ 25350 resistance zone.
🕯 5 Min Time Frame Chart with Intraday Levels
🕯 Daily Time Frame Chart with Intraday Levels
🕯️ Daily Candle Breakdown
Open: 25,139.35
High: 25,233.50
Low: 25,085.50
Close: 25,219.90
Change: +159.00 (+0.63%)
Candle structure analysis:
Real body: Green body = 80.55 pts → strong bullish body
Upper wick: 13.60 pts → very small
Lower wick: 53.85 pts → moderate
Candle Interpretation:
The session opened stable, dipped to 25,085, but strong buyers showed up, helping price climb throughout the day and close near high. A firm green candle, signaling buyers in control.
Candle Type:
A Bullish Marubozu–like candle, not perfectly clean but represents strong continuation momentum.
Key Insight:
Close above 25200 confirms a bullish grip
If price holds above 25220–25250, next push could be towards 25280–25330
Immediate support now moves to 25,120–25,140
🛡 5 Min Intraday Chart
⚔️ Gladiator Strategy Update
ATR: 181.35
IB Range: 64.35 → Medium
Market Structure: Balanced
Trades Triggered:
⏱️ 10:45 AM – Long Entry → Trailing SL Hit (1:2.65 RR)
🔁 Support & Resistance Levels
Resistance Zones:
25,180 ~ 25,212
25,233
25,260
25,295 ~ 25,315
25,340 ~ 25,322 (Gap Zone)
Support Zones:
25,168
25,125
25,080 ~ 25,060
25,037
🧠 Final Thoughts
“Momentum is not magic—it’s built one level at a time.”
Bulls showed strength with control and consistency today. With 25200 reclaimed, they now hold the ball — next challenge lies at the gates of 25300–25350. Will they break through or pause for breath? Tomorrow holds the answer.
✏️ Disclaimer:
This is just my personal viewpoint. Always consult your financial advisor before taking any action.
Wkly Market Wrap: Nifty Under Pressure, S&P 500 Hits Record HighThe Nifty 50 closed the week at 24,968, down 180 points from the previous week's close. It traded within a tight range, posting a high of 25,255 and a low of 24,918—perfectly aligning with the range I’ve been tracking between 25,600 and 24,700.
As I’ve been highlighting over the past few weeks, the monthly chart continues to show weakness, and now even the weekly chart is starting to reflect bearish signals. This growing weakness is a notable concern.
What to Watch for Next Week:
If Nifty sustains above 25,100, we could see a potential rebound toward the 25,400–25,450 resistance zone.
However, a breakdown below this week's low of 24,918 opens the door to a retest of key support near 24,500.
What’s interesting is that, despite Nifty’s indecision, the number of bullish stocks on the monthly time frame has increased significantly. Last week, there were 18 such stocks on my radar; now that number has jumped to 26, even after excluding about 10 others that showed bullish patterns but had high volatility.
This divergence—index showing weakness while quality stocks turn bullish—could indicate a possible bear trap being set by institutional players. If true, we might see a sharp short-covering rally after a final shakeout.
Nifty Outlook:
For the upcoming week, I expect Nifty to remain range-bound between 25,400 and 24,500. A decisive breakout or breakdown from this range could lead to sharp directional movement, so traders should stay alert.
Global Markets: S&P 500 Soars to New Highs
The S&P 500 closed at a record high of 6,296, with a weekly high of 6,315 and low of 6,201. The index remains in strong uptrend mode.
A breakout above 6,315 could see it testing 6,376, 6,454, and potentially 6,500 in the coming sessions.
My next major Fibonacci target is 6,568.
As long as 6,149 holds on a weekly closing basis, I continue to view every dip as a buying opportunity.
Final Thoughts:
The Indian markets are sending mixed signals, with the broader index showing caution while individual stock strength is quietly building. This divergence warrants a tactical approach—stay nimble, respect levels, and be ready for sharp reversals or breakouts.
Next week could be crucial. Stay focused, stay disciplined.
Nifty Closes Below 25,000 — What Lies Ahead?The Indian market's recent uptrend appears to be losing momentum, as the benchmark Nifty index extended its decline for the third consecutive week, ending just below the important 25,000 mark.
This pullback has been largely driven by weakness in the Financial and IT sectors, with major players like NSE:TCS , NSE:HCLTECH , and NSE:AXISBANK posting disappointing earnings.
From a technical perspective, the index is now approaching a key support zone near 24,900. A decisive break below this level could open the door for a further slide towards 24,500.
Open Interest (OI) data reinforces this view, with the 25,000–24,900 zone seeing the highest put writing, marking it as an immediate support area. On the upside, strong call writing at 25,100 and 25,200 on Friday suggests these levels will act as immediate resistance.
Given the current structure, the outlook for the coming week remains neutral to bearish.
Traders are advised to stay cautious, manage risk effectively, and keep a close watch on these crucial levels.
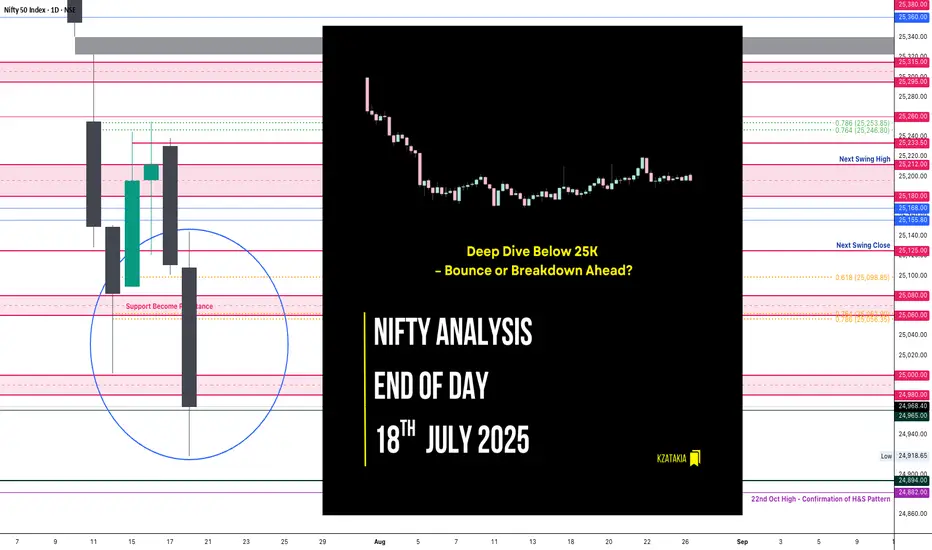
Nifty Analysis EOD – July 18, 2025 – Friday🟢 Nifty Analysis EOD – July 18, 2025 – Friday 🔴
“Deep Dive Below 25K – Bounce or Breakdown Ahead?”
As we discussed yesterday, a big move was on the cards — and Nifty delivered.
The index started flat to negative, and from the opening tick, sellers took firm control. It sharply broke through multiple key supports: PDC, PDL, S1, the important 25,080–25,060 support zone, swing low, 25,000–24,980, and even 24,965.
Buyers finally showed up near 24,920, a crucial level, and pulled off a modest 86-point recovery. The session ended at 24,968.40, still below the psychological 25,000 mark and the fractal swing low of July 14.
🕯 5 Min Time Frame Chart with Intraday Levels
🔍 Mixed Signals:
✅ Positive: Today’s low aligns with the 0.618 Fib retracement from the June 13 low to June 30 high — potential support zone.
✅ Positive: RSI(3 of 3) shows bullish divergence — early reversal sign?
❌ Negative: Closed below July 14 swing low — weak structural signal.
❌ Negative: Below 25,000 — psychological breakdown.
❓Now the big question: Will this bearish move continue, or is it a fakeout before reversal?
You're still bullish on the overall daily trend, but tactically bearish for intraday until a close above 25,125 confirms strength.
🕯 Daily Time Frame Chart For Additional View
🕯 Daily Time Frame Chart with Intraday Levels
🕯 Daily Candle Breakdown
Open: 25,108.55
High: 25,144.60
Low: 24,918.65
Close: 24,968.40
Change: −143.05 (−0.57%)
📊 Candle Structure Breakdown
Real Body: 140.15 pts → Large red bearish body
Upper Wick: 36.05 pts → rejection near early highs
Lower Wick: 49.75 pts → dip buying near 24,920
🔍 Interpretation
Mildly negative open with early strength attempt near 25,140
Sharp decline through major support zones
Buyers stepped in at 24,920, but recovery lacked follow-through
Close below 25K and key swing low confirms steady intraday selling pressure
🕯 Candle Type
Strong Bearish Candle with both wicks — sellers dominated, but not without some resistance from buyers at the lows.
📌 Key Insight
Short-term bearish momentum confirmed
24,920–24,890 is next critical support; breakdown may extend to 24,882–24,825
Bulls need to close above 25,125+ to reclaim control
🛡 5 Min Intraday Chart
⚔️ Gladiator Strategy Update
ATR: 181.56
IB Range: 126.45 → Medium IB
Market Structure: 🔴 Imbalanced
🟢 Trades Triggered:
09:42 AM – Short Trade → ✅ Trailed SL Hit Profit (R:R = 1 : 3.87)
📌 Support & Resistance Levels
Resistance Levels:
24,980 ~ 25,000
25,080 ~ 25,060
25,125
25,168
25,180 ~ 25,212
Support Levels:
24,965
24,894 ~ 24,882
24,825
24,800 ~ 24,768
💭 Final Thoughts
“Sometimes markets fall not to reverse, but to recharge.”
Today’s drop pierced major support zones, but the bounce from 0.618 Fib hints at possible resilience.
Structure needs clarity — Monday’s session will reveal whether this was a trap or fuel for bears.
✏️ Disclaimer
This is just my personal viewpoint. Always consult your financial advisor before taking any action.
Nifty Analysis EOD – July 17, 2025 – Thursday🟢 Nifty Analysis EOD – July 17, 2025 – Thursday 🔴
📉 Sellers Grip Expiry Day — Big Move Loading?
Nifty started again with an OH (Open = High) formation and slipped down 94 points before 10:30 AM, marking the day’s low at 25,144. During this fall, it broke the support zone of 25,212 ~ 25,180. Although a retracement followed, it couldn’t sustain above the mean and eventually broke below the previous day’s low (PDL), closing at 25,111.45.
The weekly expiry was wild and volatile — especially from 12:30 to 2:30 PM. Interestingly, if we consider the total range of the last three sessions, it is just 166 points — well below average. This suggests a phase of consolidation. A significant move may emerge once Nifty decisively breaks the broader zone of 25,000 to 25,255.
🕯 5 Min Time Frame Chart with Intraday Levels
🕯 Daily Time Frame Chart with Intraday Levels
📊 Daily Candle Breakdown
Open: 25,230.75
High: 25,238.35
Low: 25,101.00
Close: 25,111.45
Change: −100.60 (−0.40%)
Candle structure breakdown:
Real body:
Red candle (Close < Open): 25,230.75 − 25,111.45 = 119.30 points → Decent-sized bearish body
Upper wick:
25,238.35 − 25,230.75 = 7.60 points → Very small
Lower wick:
25,111.45 − 25,101.00 = 10.45 points → Small
Interpretation:
Nifty opened slightly lower, made a weak attempt upward, then saw consistent selling throughout the day, closing near the session’s low. The negligible wicks indicate that sellers were in full control, and buyers had little room to fight back.
Candle Type:
A strong bearish candle (almost Marubozu) with very small wicks → Clear dominance by sellers.
Key Insight:
The test of the 25,100 zone again shows weakening bullish strength.
If the next session breaks below 25,100, the fall may extend toward 25,000–25,050.
For bulls to regain short-term momentum, a close above 25,200–25,220 is necessary.
🛡 5 Min Intraday Chart
⚔️ Gladiator Strategy Update
ATR: 176.62
IB Range: 60.85 → Medium IB
Market Structure: Balanced
Trades Triggered:
🕒 10:53 AM – Long Trade → Trailed SL Hit Profit (R:R = 1:0.42)
🧭 What’s Next? / Bias Direction
The market is coiling within a narrow range across multiple sessions, hinting at a potential breakout move.
📌 Watch Zone: 25,000 to 25,255
🔻 A break below 25,000 may open 24,950–24,900
🔺 A close above 25,260 could drive price toward 25,350+
Bias remains neutral-to-bearish unless bulls reclaim 25,220 decisively.
🧱 Support & Resistance Levels
Resistance Levels
25,168
25,180 ~ 25,212
25,260
25,295 ~ 25,315
Support Levels
25,125
25,080 ~ 25,060
25,000 ~ 24,980
24,965
🧠 Final Thoughts
"Structure is key. When levels work, respect them. When they break, adapt."
Three sessions of compression hint at expansion soon — stay alert and trade level-to-level with discipline.
✏️ Disclaimer
This is just my personal viewpoint. Always consult your financial advisor before taking any action.

Nifty Analysis EOD – July 16, 2025 – Wednesday🟢 Nifty Analysis EOD – July 16, 2025 – Wednesday 🔴
"Bounce Back with Caution: Bulls Show Up, But Still Not in Full Control"
Nifty started the day on a flat note, but the opening candle turned out to be the day’s high, and from there, it quickly lost 91 points, marking the day’s low at 25,121 within the first hour. The early pressure gave a bearish opening tone, but bulls gradually stepped in.
Around 11:45 AM, Nifty broke above the VWAP–Day Low range, crossed the CPR zone, and then pushed toward PDH. It did make one attempt to break PDH, but failed, resulting in a slow drift downward toward VWAP and CPR into the close. The day ended at 25,212.05, nearly at CPR — a zone of indecision.
📉 The structure shows sharp reversal from the lows, but also clear hesitation near resistance zones. The session was volatile, forming a typical pre-expiry pattern with mixed sentiment. Bulls must take charge tomorrow by crossing the 25,250–25,260 zone to regain strength.
🕯 5 Min Time Frame Chart with Intraday Levels
🕯 Daily Time Frame Chart with Intraday Levels
🕯 Daily Candle Breakdown
Open: 25,196.60
High: 25,255.30
Low: 25,121.05
Close: 25,212.05
Change: +16.25 (+0.06%)
📊 Candle Structure Breakdown
Real Body: 15.45 points → small green body
Upper Wick: 43.25 points
Lower Wick: 75.55 points → significant downside recovery
🔍 Interpretation
Market opened flat, dropped quickly to test 25,120 zone
Strong buying emerged after initial fall
Buyers lifted the index above CPR, but failed to hold breakout above PDH
Candle closes with long lower wick → buyers defended dip, but lacked closing dominance
🕯 Candle TypeSpinning Top with Long Lower Wick — often a neutral to mildly bullish candle, suggesting buying interest at lower levels, but with uncertain momentum.
📌 Key Insight
Bulls clearly defended the 25,120–25,125 support zone
Momentum will only resume above 25,250–25,260, leading to targets around 25,300–25,315
Failure to hold 25,120 could reopen downside toward 25,000–25,050
🛡 5 Min Intraday Chart
⚔️ Gladiator Strategy Update
ATR: 180.99
IB Range: 91.20 → Medium IB
Market Structure: 🟡 Balanced
Trades Triggered
11:34 AM – Long Trade → ✅ Target Achieved, Trailed SL Hit (R:R 1:2.42)
📌 Support & Resistance Zones
Resistance Levels
25,168
25,180 ~ 25,212
25,260
25,295 ~ 25,315
Support Levels
25,125
25,080 ~ 25,060
25,000 ~ 24,980
24,965
💭 Final Thoughts
“Structure is forming — but conviction is lacking. Let expiry day bring clarity. Above 25,260 we fly, below 25,120 we fall.”
✏️ Disclaimer
This is just my personal viewpoint. Always consult your financial advisor before taking any action.

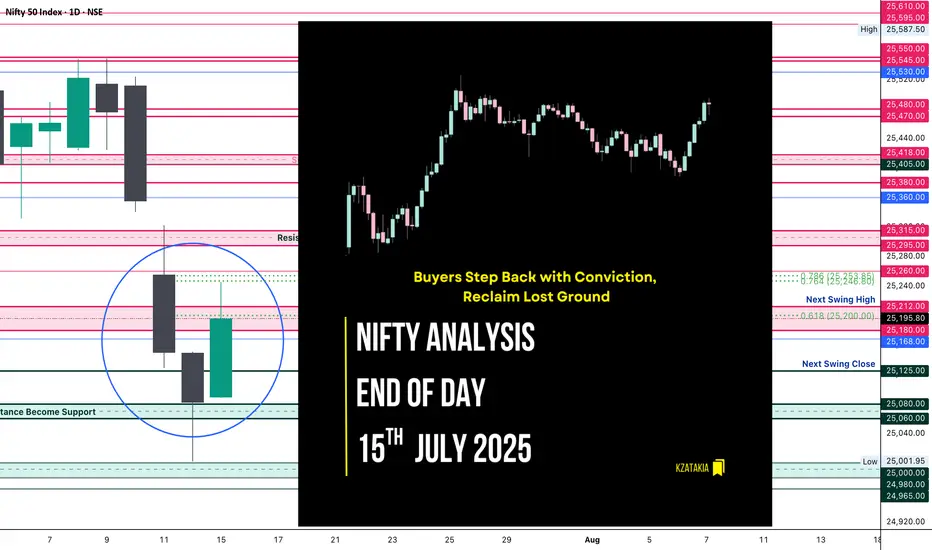
Nifty Analysis EOD – July 15, 2025 – Tuesday🟢 Nifty Analysis EOD – July 15, 2025 – Tuesday 🔴
"Buyers Step Back with Conviction, Reclaim Lost Ground"
Nifty began the session with a flat-to-positive tone, and the first 5-minute candle confidently added 60 points, pushing the index toward 25,150 – aligning with the Previous Day High (PDH). However, the level couldn't hold on the first attempt and Nifty slipped back to the day's open. After a brief consolidation, bulls made a strong comeback.
The second push broke through the PDH, Day High, and the resistance zone of 25,180–25,212, and extended the move up to mark the day’s high at 25,245.20. Post that, the index hovered above the breakout zone and closed solidly at 25,195.80, showing strength and follow-through.
📈 The day’s structure was clean and directional — a healthy bounce and hold above critical levels, reinforcing the idea that buyers are regaining control after last week’s consolidation and weakness.
🕯 5 Min Time Frame Chart with Intraday Levels
🕯 Daily Time Frame Chart with Intraday Levels
🕯 Daily Candle Breakdown
Open: 25,089.50
High: 25,245.20
Low: 25,088.45
Close: 25,195.80
Change: +113.50 (+0.45%)
📊 Candle Structure Breakdown
Real Body: 106.30 points – strong green bullish body
Upper Wick: 49.40 points – profit-taking or resistance at highs
Lower Wick: 1.05 points – negligible dip from open
🔍 Interpretation
Opened flat and quickly built momentum.
Temporary pullback in first 15 minutes was bought into strongly.
Closed with a clean green body, showing clear intraday bullish intent.
Holding above the 25,180–25,212 zone is a big win for bulls.
🕯 Candle Type
Bullish Marubozu-like (strong green body with minimal lower wick) — shows conviction and potential start of a new upswing post recent chop.
📌 Key Insight
25,080–25,100 is now a key base and must be protected.
If Nifty can break and hold above 25,240–25,250, a move toward 25,295–25,315 looks likely.
Failure to hold above 25,180 would be first sign of hesitation.
🛡 5 Min Intraday Chart
⚔️ Gladiator Strategy Update
ATR: 186.18
IB Range: 67.35 → Medium IB
Market Structure: 🟢 Balanced
Trades Triggered
10:30 AM – Long Trade → ✅ Target Achieved, Trailed SL (R:R 1:2.48)
📌 Support & Resistance Zones
Resistance Levels
25,168
25,180 ~ 25,212
25,260
25,295 ~ 25,315
Support Levels
25,125
25,080 ~ 25,060
25,000 ~ 24,980
24,965
💭 Final Thoughts
"Trend is nothing without follow-through — today buyers showed up, but tomorrow they must push past 25,250 to prove it wasn't just a bounce."
✏️ Disclaimer
This is just my personal viewpoint. Always consult your financial advisor before taking any action.
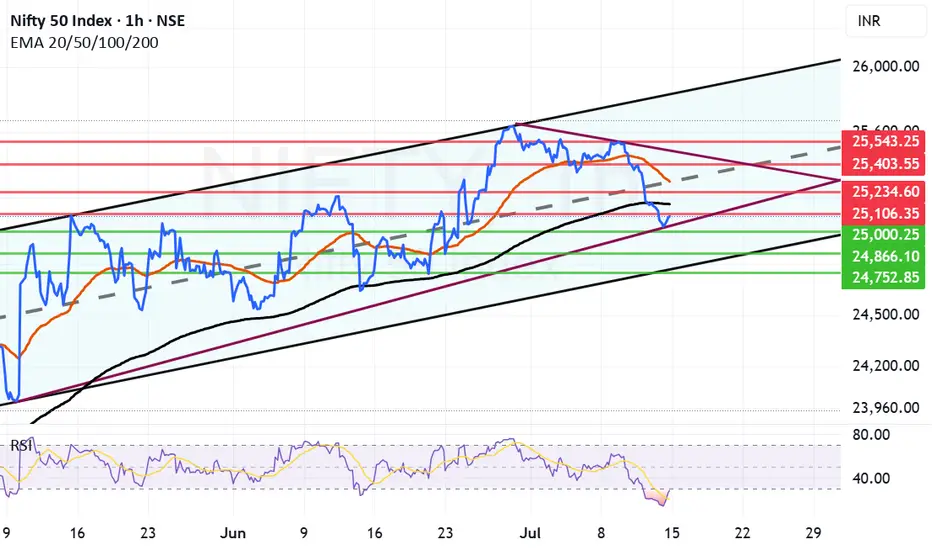
Nifty has taken support at 25K but can the support hold?Nifty today took a meaningful support at 25001 and bounced close to 25082. However ending the was in the negative by 67.55 points. RSI today went as low as 13.52 indication of oversold market. IT was a major drag after result that market did not like.
Now the resistances in front of Nifty are at 25106, Father Line Resistance at 25106, 25234, Mother Line Resistance at 25297, 25403 and finally 25543. Supports for Nifty remain at 25K, 24866 Chanel Bottom support and finally 24752. Below 24752 Bears can totally take control of the market if we reach there.
Things are in balance right now with Mid-cap, Small-cap starting to see some buying. If IT can hold the levels we will see growth from here. If IT index further caves in and other indices do not support we can see a down side. Shadow of the candle right now is neutral to negative.
Disclaimer: The above information is provided for educational purpose, analysis and paper trading only. Please don't treat this as a buy or sell recommendation for the stock or index. The Techno-Funda analysis is based on data that is more than 3 months old. Supports and Resistances are determined by historic past peaks and Valley in the chart. Many other indicators and patterns like EMA, RSI, MACD, Volumes, Fibonacci, parallel channel etc. use historic data which is 3 months or older cyclical points. There is no guarantee they will work in future as markets are highly volatile and swings in prices are also due to macro and micro factors based on actions taken by the company as well as region and global events. Equity investment is subject to risks. I or my clients or family members might have positions in the stocks that we mention in our educational posts. We will not be responsible for any Profit or loss that may occur due to any financial decision taken based on any data provided in this message. Do consult your investment advisor before taking any financial decisions. Stop losses should be an important part of any investment in equity.
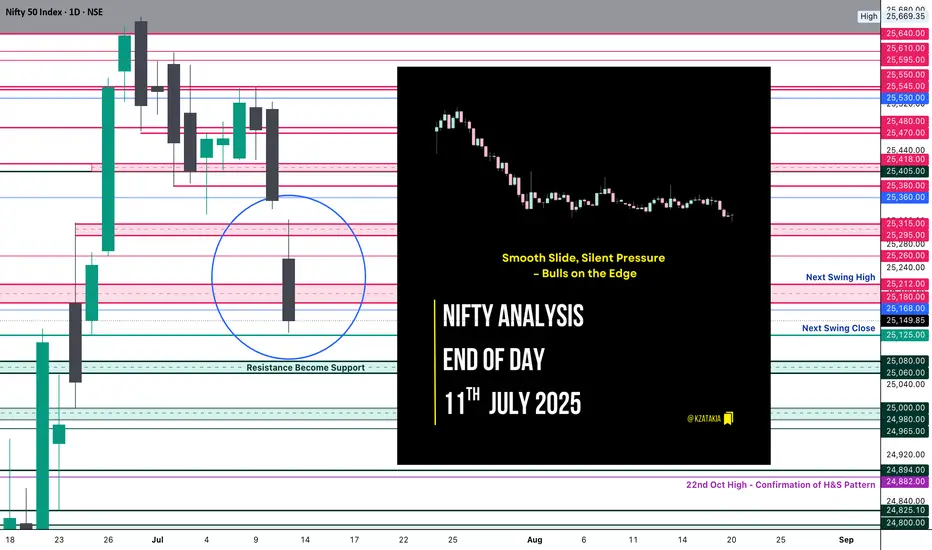
Nifty Analysis EOD – July 11, 2025 – Friday🟢 Nifty Analysis EOD – July 11, 2025 – Friday 🔴
"Smooth Slide, Silent Pressure – Bulls on the Edge"
Nifty opened with a 60-point gap-down, and despite an initial attempt to fill the gap with a 40-point bounce, the index couldn’t sustain. What followed was classic, smooth selling pressure — a slow bleed marked by 16 consecutive 5-minute candles that never broke the previous candle’s high.
There was no panic, just a persistent drift downward. The day’s structure was a silent yet firm rejection from higher levels, with 25,150 acting as an anchor for most of the session, eventually closing near 25,140.
📉 This session marks a revisit to the breakout zone of June 26–27.
Is this a false breakout or a healthy retest?
Only time — and a bounce or breakdown from 25,080–25,060 — will tell.
⚠️ If we close below 25,000, the entire bullish move from late June might be invalidated.
But a sharp bounce from the 25080–25060 zone could spark a hopeful reversal setup.
🕯 5 Min Time Frame Chart with Intraday Levels
🕯 Daily Time Frame Chart with Intraday Levels
🕯 Daily Candle Breakdown
Open: 25,255.50
High: 25,322.45
Low: 25,129.00
Close: 25,149.85
Change: −205.40 (−0.81%)
📊 Candle Structure Breakdown
Real Body: 105.65 points – clean bearish body
Upper Wick: 66.95 points – buyers rejected
Lower Wick: 20.85 points – weak defense at bottom
🔍 Interpretation
Price opened weak and stayed weak.
An intraday push to 25,320 was sharply sold into.
Closing near the day’s low shows full bear control.
Minimal bounce from day low indicates lack of bullish confidence.
🕯 Candle Type
A Bearish Rejection Candle – resembles an inverted hammer in a downtrend; suggests sellers still strong and bulls hesitant
📌 Key Insight
The zone of 25,320–25,350 has turned into firm intraday resistance.
25,100–25,130 is the immediate make-or-break support — below that lies 25,000–25,050.
For bulls to breathe again, we need a bounce and hold above 25,250–25,300.
🛡 5 Min Intraday Chart
⚔️ Gladiator Strategy Update
ATR: 193.17
IB Range: 78.45 → Medium IB
Market Structure: 🔴 Imbalanced
Trades Triggered
10:21 AM – Short Trade → 🎯 Trailing SL Hit (R:R 1:2.41)
📌 Support & Resistance Zones
Resistance Levels
25,168
25,180 ~ 25,212
25,260
25,295 ~ 25,315
Support Levels
25,125
25,080 ~ 25,060
25,000 ~ 24,980
24,965
💭 Final Thoughts
"It wasn’t a crash, it was a quiet rejection — and that makes it more dangerous. If bulls don’t show up now, bears might get bolder from here."
✏️ Disclaimer
This is just my personal viewpoint. Always consult your financial advisor before taking any action.
Nifty Dips, Suggests Range-Bound Movement AheadIndian markets ended the week with a decline of nearly one percent, driven by lingering concerns over global tariffs and a weak start to the earnings season.
The 25,500 level has now turned into a strong resistance zone, marked by heavy call writing, while 25,000 continues to act as a solid support level backed by significant put writing.
Given these dynamics, the index is likely to enter a consolidation phase, with upcoming earnings announcements expected to keep sectoral volatility elevated.

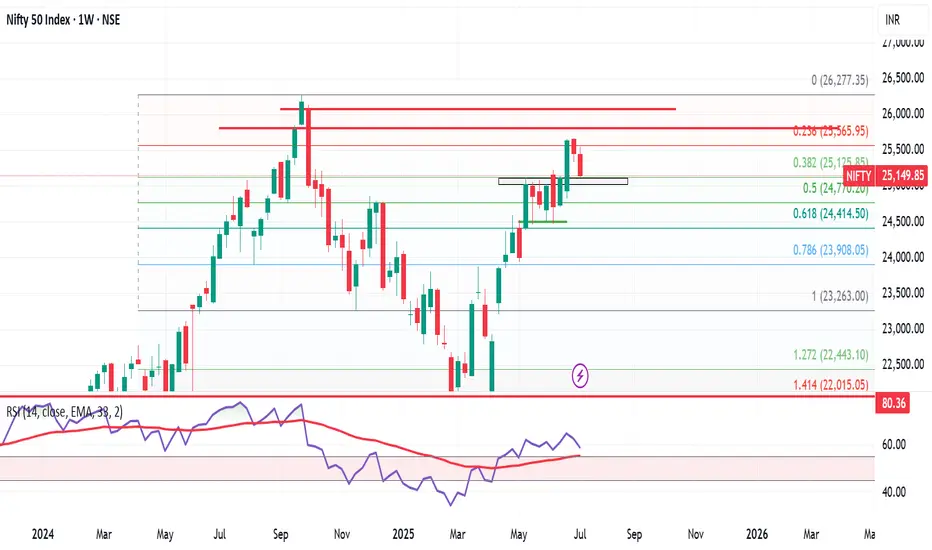
Nifty at Make-or-Break Zone: What to Expect Next Week Markets eMarkets ended the week under pressure, with the Nifty 50 closing at 25,149, down 312 points from the previous week. The index traded within a tight band, hitting a high of 25,548 and a low of 25,129 — perfectly respecting the 25,900–25,000 range mentioned in last week’s analysis.
Now, Nifty finds itself at a crucial support level near 25,000. A rebound from this zone could trigger a short-term rally towards 25,500–25,600, which will act as immediate resistance. However, traders should proceed with caution, as the monthly chart remains neutral to bearish, indicating that this could just be a temporary bounce rather than a sustained uptrend.
Looking ahead, expect Nifty to trade within a range of 24,700 to 25,600. A breakdown below 24,700 could open the gates for deeper cuts, while a breakout above 25,600 needs to be backed by strong volume and participation to confirm a trend reversal.
Sector Watch: Reliance Shines Amidst Caution
Among the large caps, Reliance Industries stands out as the only stock showing strength on the monthly chart, while other heavyweights and key sectors continue to lack momentum. This narrow leadership is a red flag for broader market sustainability.
Global Markets: S&P 500 at a Crossroads
Globally, the S&P 500 closed at 6,259, down slightly from last week. What’s more important is the formation of a Doji candle — a classic sign of indecision. A move above 6,300 could lead to upside targets of 6,376 / 6,454 / 6,500, which would likely boost sentiment in global and Indian equities.
However, if the index slips below 6,150, it would mark a failed breakout, potentially triggering a global correction — a risk that Indian markets can't ignore.
Final Word
We’re at a critical juncture. While technicals suggest a potential bounce in Nifty from 25,000, the lack of confirmation on higher timeframes and uncertain global cues call for prudence over aggression.
👉 I’ll be staying out of the market this week. The setup doesn’t offer a favorable risk-reward, and in trading, patience is often the best position.
Let the charts speak. We’ll act accordingly.
RenderWithMe | Nifty 50-Forecast Upcoming Week July 7–11,2025
~~NIFTY 50 Analysis for Next Week (July 7–11, 2025)Current Market ContextRecent ~~
Performance: As of July 4, 2025, the NIFTY 50 closed at 25,461, Up 55 points from the previous session, The index has been trading within an ascending channel, with a weekly decline of -0.45% but a monthly gain of 3.67% and a yearly increase of 4.48%.
# Global Cues: Mixed signals from global markets are influencing sentiment. U.S. markets are hitting record highs, while Asian markets like Japan’s Nikkei 225 (+600 points) and Hong Kong’s Hang Seng (-0.42%) show varied trends. Rising oil prices and geopolitical concerns, along with expectations of new U.S. tariff announcements under the Trump policy roadmap, are creating caution.
# Domestic Factors: Strong institutional buying from Domestic Institutional Investors (DIIs) (net buyers of ₹3,036 crore) contrasts with Foreign Institutional Investors (FIIs) being net sellers (₹1,561 crore). This dynamic suggests domestic support but potential headwinds from foreign outflows.
~~ Technical Analysis ~~
Key Levels:Support: Immediate support lies at 25,000–25,150. A break below 25,000 could signal short-term weakness, with further support at 24,982 and 24,622.
Resistance: Resistance is seen at 25,650–25,750, with a strong barrier at 25,690–25,760. A breakout above 25,750 with volume confirmation could push the index toward 26,000 or higher (potentially 28,435).
Trend: The NIFTY is in a positive trend but showing signs of consolidation. Technical indicators like the Relative Strength Index (RSI) at 67.3 suggest upward momentum but caution as it nears overbought territory.
Chart Patterns: A "Cup and Handle" pattern is forming on the daily timeframe, indicating a bullish continuation if the index breaks above 25,655. However, a failure to sustain above 25,400 could lead to a pullback toward 25,320–25,000.
Moving Averages: The index remains above key moving averages (5 DMA: 24,908.6, 10 DMA: 24,934.2, 20 DMA: 24,862.07), reinforcing a bullish bias as long as it holds above 25,338 (daily closing stop-loss).
Sectoral OutlookPositive Sectors: Nifty Metal (+0.23%) and Nifty Pharma (+0.30%) showed gains, suggesting resilience. Banking remains strong, with Bank Nifty hitting a new high of 57,614.50 despite recent profit booking.
Weak Sectors: Nifty IT (-0.01%) and Nifty Financial Services (-0.47%) faced selling pressure, with key constituents like Kotak Bank (-1.96%) and Bajaj Finance (-1.39%) dragging performance.
Focus Areas: Watch banking and pharma for potential leadership, while IT and financials may remain subdued unless buying interest returns.
Key Factors to WatchGlobal Markets: U.S. and Asian market trends, particularly U.S. tariff policies and Federal Reserve rate cut expectations, will influence sentiment.
Macroeconomic Data: Domestic indicators like inflation, GDP revisions, or RBI policy updates could sway the market.
FII/DII Activity: Continued DII buying could offset FII selling, but a reversal in FII flows will be critical for sustained upside.
Geopolitical Risks: Rising oil prices and U.S.–India trade developments may create volatility.
Technical Breakouts: Monitor for a breakout above 25,750 or a breakdown below 25,000 to confirm the next directional move.
Trading StrategyBullish Case: If NIFTY sustains above 25,650, consider buying call options or index futures targeting 25,760–26,000. Use a stop-loss at 25,000.
Bearish Case: If NIFTY falls below 25,000, short positions or put options could target 24,982–24,622, with a stop-loss at 25,450.
Range-Bound: If the index trades between 25,450–25,750, adopt a neutral strategy like selling iron condors to capitalize on low volatility.
Risk Management: Use strict stop-losses and avoid over-leveraging, as volatility is expected due to global and domestic triggers.
Forecast for the WeekExpected Range: 25,000–25,750, with potential for a breakout toward 26,000 if resistance is cleared.
Bias: Sideways to moderately bullish, with risks of profit booking or volatility mid-week.
Probability:Bullish breakout (above 25,750): 40%
Consolidation (25,000–25,750): 50%
Bearish pullback (below 25,000): 10%
Long-Term Outlook (July 2025)Predictions suggest NIFTY could reach 26,055–26,484 by August, with a gradual climb to 28,400 by November 2025, driven by economic growth and sectoral strength. However, these are speculative and depend on sustained bullish momentum.
Disclaimer --
This analysis is based on recent technical data and market sentiment from web sources. It is for informational purposes only and not financial advice. Trading involves high risks, and past performance does not guarantee future results. Always conduct your own research or consult a SEBI-registered advisor before trading.
#Boost and comment will be highly appreciated

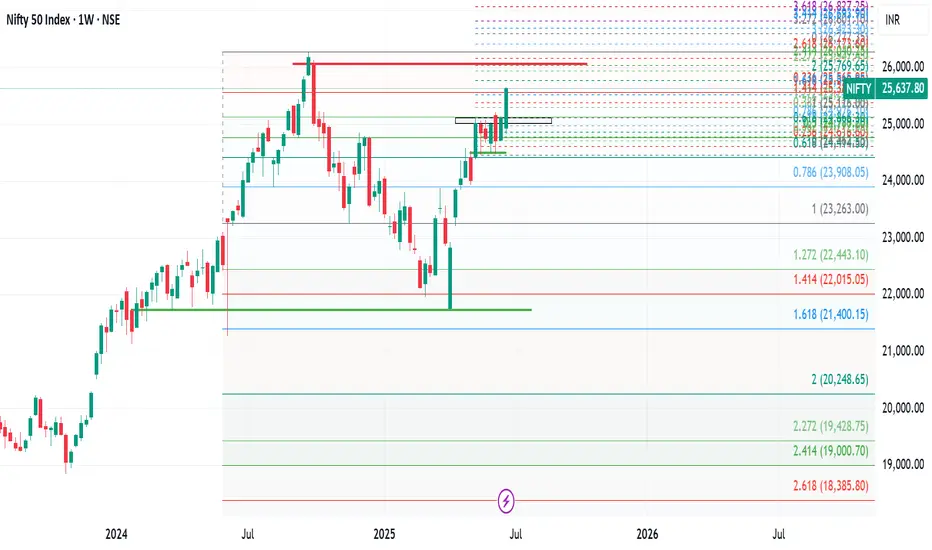
Market Recap: Nifty Breaks Out After 5 Weeks of Consolidation!The Indian stock market saw a strong bullish move this week, with Nifty 50 closing at 25,637, marking a significant gain of 525 points from the previous week's close. The index made a high of 25,654 and a low of 24,824, finally breaking out of the key resistance zone of 25,000–25,100 after five weeks of sideways consolidation.
This breakout is a critical technical development, signaling renewed strength in the broader market. However, to sustain this momentum and target the all-time high zone of 26,134–26,277, Nifty may need to either:
Consolidate within the previous week's range of 25,650–24,800, or
Retest the breakout level near 25,200 for confirmation.
Failing to do so could make this breakout a false one.
Weekly Outlook for Nifty:
For the coming week, the expected trading range is between 25,200 and 26,150. Price action around these levels will be key to watch.
On a broader sectoral view, out of 14 NSE indices, only Nifty Financial Services is showing relative strength on the monthly chart—a potential red flag for sustained bullish sentiment. When just one sector leads while others lag, it's often a sign to remain cautious.
Strategy Suggestion:
Consider booking partial profits and trailing stop losses on the remaining positions. Until the monthly time frame turns decisively bullish, it's wise to stay alert and manage risk actively.
Global Markets: S&P 500 Breaks Out!
In the U.S., the S&P 500 surged to close at 6,173, successfully breaking above its key resistance level at 6,013. This breakout, if sustained above 6,150 next week, opens up the path toward higher targets: 6,225 / 6,376 / 6,454 / 6,500.
However, traders should remain flexible. If the breakout fails, we could see a pullback to support zones near 6,013 or even 5,899.
Pro Tip:
Be ready to switch trading positions quickly if the breakout doesn’t hold—volatility is still very much in play in both Indian and U.S. markets.
Nifty Analysis EOD – June 23, 2025 – Monday🟢 Nifty Analysis EOD – June 23, 2025 – Monday 🔴
👊 Tug of War Between Optimism and Pessimism
Nifty opened with a sharp 140-point gap-down, weighed by geopolitical tensions and negative news cues. The mood was clearly pessimistic — yet, from the deep low of 24,824.85, bulls made a bold comeback.
What followed was a classic textbook reversal:Price clawed back up, cutting through multiple key resistances — S1, VWAP, CDH, CPR BC, and Central CPR — before kissing the CPR TC, where it marked the day high at 25,057. This level acted as a supply zone and pushed Nifty back down toward the CPR BC, where it managed to close above the open — a quiet victory for the bulls, even in a red session overall.
The level 24,825 has now proven itself once again — the market’s respect for this support zone grows stronger with every bounce.
Today’s candle was a spinning top-style doji and also formed an inside bar, with all movement inside Friday’s wide-range candle (352 pts). Despite a smaller 232-point range today, this still requires caution — inside bars after large-range candles often result in false breakouts, especially amid macro noise.
📌 When the world looks bearish, and the chart looks bullish — trust your system.And that’s exactly what I did today — sticking to the Gladiator Strategy, a simple, disciplined intraday price action-based option buying framework.
🕯 5 Min Time Frame Chart with Intraday Levels
🕯 Daily Time Frame Chart with Intraday Levels
🕯 Daily Candle Breakdown
Open: 24,939.75
High: 25,057.00
Low: 24,824.85
Close: 24,971.90
Change: −140.50 (−0.56%)
📊 Candle Structure Breakdown
Real Body: 32.15 pts (small green body)
Upper Wick: 85.10 pts
Lower Wick: 114.90 pts
🔍 Interpretation
Despite a lower close than Friday, it was a green-bodied candle (close > open).
Long lower wick shows strong buying near 24,825.
Long upper wick signals resistance near 25,050–25,060.
🕯 Candle Type
📍 Spinning Top with Long Wicks — Sign of indecision, but slight bullish bias due to buying off the lows.
📌 Key Insight
Support at 24,825 holds strong.
Upper rejection near 25,050 indicates tight overhead pressure.
Watch closely:
Break above 25,060 → May trigger bullish continuation.
Break below 24,820 → Could open downside to 24,735–24,660 zone.
🛡 5 Min Intraday Chart
⚔️ Gladiator Strategy Update
ATR: 254.95
IB Range: 163.25 → Medium IB
Market Structure: ⚖️ Balanced
Trades Triggered:
🟢 10:14 AM – Long Trade → ✅ Target Achieved (Trailing Exit, R:R 1:4.51)
🔴 2:16 PM – Short Signal → ❌ Discarded (RR not favorable)
📌 Support & Resistance Zones
Resistance Levels
24,980 ~ 25,000
25,060 ~ 25,080
25,125 ~ 25,150
25,180 ~ 25,212
25,285
Support Levels
24,965
24,894 ~ 24,882
24,825
24,800 ~ 24,768
24,735 ~ 24,725
💭 Final Thoughts
Markets are currently walking a tightrope — with bearish headlines on one side and bullish price action on the other.The Gladiator approach today helped sidestep the noise and focus on what matters: price structure and clean levels.
📌 Trade the chart, not the news. And when in doubt — zoom out.
🧠 “Uncertainty is the playground of the disciplined.”
✏️ Disclaimer
This is just my personal viewpoint. Always consult your financial advisor before taking any action.
Nifty Analysis EOD – June 20, 2025 – Friday🟢 Nifty Analysis EOD – June 20, 2025 – Friday 🔴
🚀 Bull Run Out of the Blue 🚀 – A Masterclass in Price Action
Nifty kicked off the session with a +56-point gap-up — surprising many, especially since Gift Nifty hinted flat to negative and yesterday’s close was weak. The real jolt came when, in the very first minute, price broke above the Previous Day High (PDH) and opened directly above the CPR zone — a rare occurrence when geopolitical tensions are peaking.
As I often say:
📌 “Market rarely follows the obvious. It thrives in the unexpected.”
Today was a textbook example of that.
Luckily, we were prepped. In yesterday’s note, I mentioned the bullish trigger above 24,862 — and right from the open, Nifty respected every level, offering "hope-on" and "hope-off" trades. What seemed like a 25K test turned into a blast to 25,136, with 100 points added in the last 30 minutes, leaving even seasoned traders awestruck.
The intraday close at 25,079.75 and the adjusted close at 25,112.40 — both above the 15th May closing levels — give a bullish vibe heading into the weekend. 🤞
💬 Personal Note:
Today was special — I sat with my elder daughter, helping her understand real-time market behavior. And what a day it was! From trend reversals, cup & handle, head & shoulders, wedges, shallow pullbacks, to aggressive one-way rallies — everything aligned perfectly to make this a live-action lesson in intraday trading.
🕯 5 Min Time Frame Chart with Levels
🕯 Daily Time Frame Chart
🕯 Daily Candle Breakdown
Open: 24,787.65
High: 25,136.20
Low: 24,783.65
Close: 25,112.40
Change: +319.15 (+1.29%)
📊 Candle Structure Breakdown
Real Body: 324.75 pts → ✅ Strong Green Candle
Upper Wick: 23.80 pts
Lower Wick: 4.00 pts
🔍 Interpretation
Opened flat and never looked back.
Minimal wicks = clear directional strength.
Buyers in full control from open to close.
🕯 Candle Type
📈 Bullish Marubozu-like — One of the strongest bullish signals. A powerful sign of trend continuation or breakout momentum.
📌 Key Insight
Today’s candle reinforces bullish strength.
Holding above 25,100 is key going forward.
A move above 25,136 could invite fresh upside targets — possibly 25,180+ and beyond.
🛡 5 Min Intraday Chart
⚔️ Gladiator Strategy Update
ATR: 251.32
IB Range: 116.6 → Medium IB
Market Structure: 📈 ImBalanced
Trades Triggered:
🔹 9:41 AM – Long Trade → Target Achieved (Trailing Exit, R:R 1:4.79)
🔹 12:18 PM – Short Contra Trade → Target Achieved (R:R 1:2)
🔹 1:07 PM – Long Trade → Target Achieved (Trailing Exit, R:R 1:2.62)
📌 Support & Resistance Zones
Resistance Levels
25,125 ~ 25,150
25,180 ~ 25,212
25,285
Support Levels
25,080 ~ 25,060
25,000 ~ 24,980
24,965
24,894 ~ 24,882
💭 Final Thoughts
The market surprised today — not just in movement but in clarity.The clean break, follow-through strength, and intraday structure hint at momentum continuation — but weekends can bring surprise news.
📌 Watch 25,100 as line in the sand on Monday.
🧠 “Markets are teachers. Today’s lesson? Expect the unexpected, but prepare like it’s already here.”
✏️ Disclaimer
This is just my personal viewpoint. Always consult your financial advisor before taking any action.

Nifty Analysis EOD – June 18, 2025 – Wednesday🟢 Nifty Analysis EOD – June 18, 2025 – Wednesday 🔴
⚖️ Dhamakedar Start, But Indecisive Close – Weekly Expiry Caution Ahead
Nifty opened with a 65-point gap-down at 24,788.35, but what followed was a power-packed bullish start — within just 25 minutes, it surged over 150 points, hitting a day high of 24,947.55.
However, the euphoria didn’t last.
As the session progressed, the index gradually gave up all its gains, slipped below the previous day’s low, and finally found support at 24,750, a critical level. By the end of the day, Nifty settled around the opening zone at 24,812.05, just +23 points above open, while net change remained −41.35 points from the previous close.
The day showcased both strength and weakness — a typical "everyone-expected-fall-but-it-didn't-fall-enough" kind of day. The long upper wick reflects failed attempts by bulls, while the lack of breakdown keeps the bears in check.
Tomorrow is weekly expiry — caution is advised.
🕯 5 Min Time Frame Chart with Levels
🕯 Daily Time Frame Chart
🕯 Daily Candle Breakdown
Open: 24,788.35
High: 24,947.55
Low: 24,750.45
Close: 24,812.05
Change: −41.35 (−0.17%)
📊 Candle Structure Breakdown
Real Body: 23.70 pts → ✅ Green Candle (tiny body)
Upper Wick: 135.50 pts
Lower Wick: 37.90 pts
🔍 Interpretation
Strong bullish momentum early on, but buyers failed to hold above 24,900.
Long upper wick signals supply or profit-booking at higher levels.
Price closed near open despite wide range → indecision between bulls and bears.
🕯 Candle Type
🟨 Spinning Top – A textbook indecisive candle, often seen at turning points or during pauses in trend.
📌 Key Insight
Buyers couldn’t reclaim or close above 24,950 — resistance strengthened.
Support held at 24,750 — but barely.
Watch 24,950 on upside and 24,750 on downside — a breakout from either may decide expiry-day trend.
🛡 5 Min Intraday Chart
⚔️ Gladiator Strategy Update
ATR: 252.34
IB Range: 170.65 → Medium IB
Market Structure: ⚖️ Balanced
Trades:🚫 Short Trigger at 12:45 : Trapped - SL Hit
📌 Support & Resistance Zones
Resistance Levels
24,894 ~ 24,882
24,972 ~ 25,000
25,060 ~ 25,080
25,102 ~ 25,125
Support Levels
24,825 ~ 24,847
24,725 ~ 24,735
24,660
24,590
💭 Final Thoughts
When price travels 200 points but closes flat, it tells you something: Smart money is waiting.Weekly expiry ahead could bring unexpected moves.✅ Stay nimble. Stay alert.
🧠 “When in doubt, let the market shout — not whisper. Listen for the breakout.”
✏️ Disclaimer
This is just my personal viewpoint. Always consult your financial advisor before taking any action.