Nifty Analysis EOD – September 5, 2025 – Friday🟢 Nifty Analysis EOD – September 5, 2025 – Friday 🔴
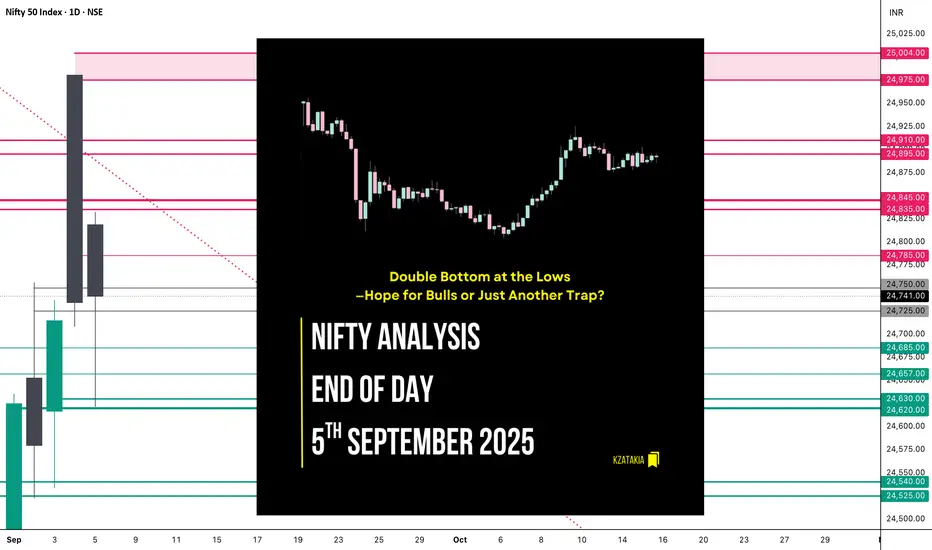
Double Bottom at the Lows—Hope for Bulls or Just Another Trap?
🗞 Nifty Summary
Nifty opened with a 98-point gap-up at 24,825 but showed hesitation, spending the first 45 minutes stuck in the CPR zone within a narrow 60-point band. By 10 AM, the index slipped sharply—breaking both IB Low and BC level, and within minutes also pierced PDL, tumbling nearly 143 points. Support emerged at S1 (24,635), where the fall finally halted.
The index then spent over two hours base-building between PDL and S1, forming a double bottom (Adam–Eve) pattern. Once this base broke out above PDL, the index rallied quickly, meeting its upside target.
Structurally, the session shaped into a triple distribution day:
Early selling phase,
Midday consolidation,
Late recovery rally.
Intraday option traders found strong opportunities with fast 2x expansion off a small IB, but swing traders likely struggled with whipsaws.
Closing nearly flat at 24,741 (+6.7 pts) keeps the directional dilemma alive. Yesterday’s rejection repeated today—but the 125-point recovery off lows and close above PDL gives bulls a glimmer of hope.
🛡 5 Min Intraday Chart with Levels
📉 Daily Time Frame Chart with Intraday Levels
🕯 Daily Candle Breakdown
Open: 24,818.85
High: 24,832.35
Low: 24,621.60
Close: 24,741.00
Change: +6.70 (+0.03%)
🏗️ Structure Breakdown
Red candle (Close < Open), but still slightly positive vs. previous day.
Body: 77.85 pts → small bearish body.
Upper wick: 13.50 pts → negligible.
Lower wick: 119.40 pts → long tail.
🕯Candle Type
Hammer / Pin Bar → indicates potential reversal with bullish undertone.
📚 Interpretation
Market slipped nearly 200 pts intraday but bounced back strongly.
Long downside tail reflects demand defense at 24,620–24,635 zone.
Despite red body, price action leans neutral-to-bullish.
🔍 Short-Term View – September 8, 2025
Support: 24,620 (defended low).
Resistance: 24,830–24,980 (recent rejection zone).
👉 Bias Direction:
> If 24,620 breaks, weakness could extend to 24,450.
> If 24,830 sustains, bulls may regain the upper hand.
🛡 5 Min Intraday Chart
⚔️ Gladiator Strategy Update
ATR: 211.61
IB Range: 59.7 → Small
Market Structure: Balanced
Trade Highlights:
1) 10:00 AM – Short Trigger → Target Hit (R:R = 1:3.64)
📌 Support & Resistance Levels
Resistance Zones:
24,785
24,835 ~ 24,845
24,895 ~ 24,910
24,975 ~ 25,004
Support Zones:
24,685
24,657
24,630 ~ 24,620
24,540 ~ 24,525
💡 Final Thoughts
Today’s Hammer at the lows signals that buyers are quietly absorbing supply. But conviction remains missing—two back-to-back sessions show indecision at higher levels. Until either 24,620 breaks or 24,830 is sustained, expect choppy action favoring intraday trades over positional setups.
📖 “Reversals don’t start with noise—they begin with defense at key levels.”
✏️ Disclaimer
This is just my personal viewpoint. Always consult your financial advisor before taking any action.
Nifty50level
Nifty Analysis EOD – September 2, 2025 – Tuesday🟢 Nifty Analysis EOD – September 2, 2025 – Tuesday 🔴
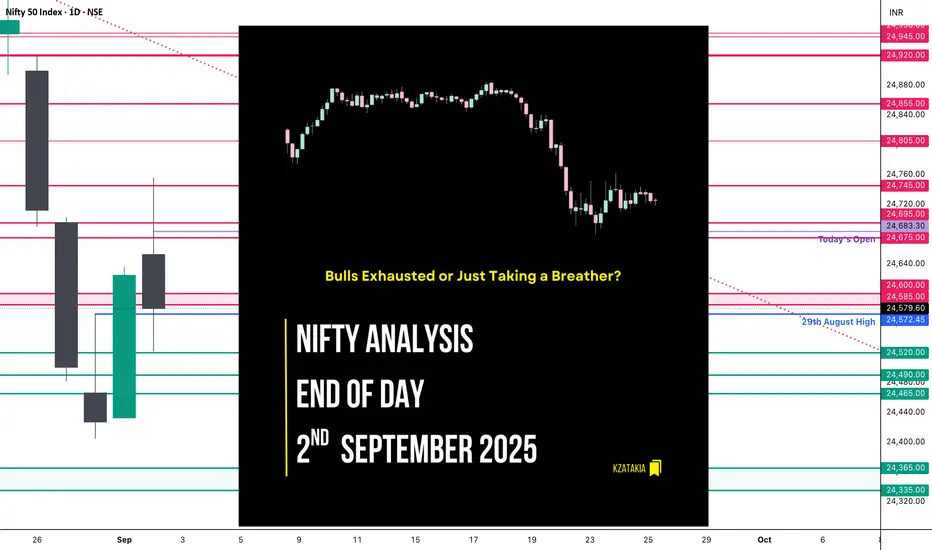
Bulls Exhausted or Just Taking a Breather?
🗞 Nifty Summary
Nifty opened with a 62-point gap-up above the previous day’s high, but the excitement didn’t last long. The index quickly rushed to fill the gap, pulled back, and initially tried to extend the bullish sentiment from yesterday. However, the 24,750 hurdle proved too strong.
After multiple failed attempts to break above it, Nifty slipped below key supports — mean, CDL, PDH, PDC, and the 24,600–24,585 support zone — finally taking a pause around 24,520.
The big question: Was this just a weekly expiry adjustment or early signs of bullish momentum exhaustion?
For the upcoming sessions, the critical range is 24,750 ~ 24,500.
🛡 5 Min Intraday Chart with Levels
📉 Daily Time Frame Chart with Intraday Levels
🕯️ Daily Candle Breakdown
Open: 24,653.00
High: 24,756.10
Low: 24,522.35
Close: 24,579.60
Change: −45.45 (−0.18%)
🏗️ Structure Breakdown
Red candle (Close < Open).
Body: 73.40 points → moderate.
Upper wick: 103.10 points (strong rejection near high).
Lower wick: 57.25 points (buyers attempted defense).
This created a long upper wick → intraday bullish attempt got rejected.
🕯Candle Type
Shooting Star–like red candle → reflects bullish exhaustion and supply pressure.
📚 Interpretation
Gap-up open above previous close (24,625 → 24,653).
Bulls attempted to break 24,750, but failed multiple times.
Sellers dominated late, dragging the index red.
Strong rejection shows supply pressure near 24,750.
📉 Short-Term View
Resistance: 24,750 (rejection zone).
Support: 24,520 (today’s low).
Context: Yesterday’s bullish Marubozu was negated by today’s failure.
👉 If bulls reclaim 24,750+, momentum revives.
👉 If 24,520 breaks, sellers may gain the upper hand.
In short: Market is in a tug-of-war zone between 24,750 and 24,520.
🛡 5 Min Intraday Chart
⚔️ Gladiator Strategy Update
ATR: 205.07
IB Range: 98.85 → Medium
Market Structure: Balanced
Trade Highlight:
13:50 Short Trigger → Target Hit (R:R = 1:1.5)
📌 Support & Resistance Levels
Resistance Zones:
24,675 ~ 24,695
24,745
24,805
24,855
Support Zones:
24,575
24,520
24,490 ~ 24,465
💭 Final Thoughts
The index showed signs of exhaustion near 24,750. Whether this is just expiry-related or a genuine pause in momentum, tomorrow’s action will confirm.
"Markets don’t lie, they whisper. Today’s rejection was one such whisper — respect it."
✏️ Disclaimer
This is just my personal viewpoint. Always consult your financial advisor before taking any action.
Nifty Analysis EOD – August 22, 2025 – Friday🟢 Nifty Analysis EOD – August 22, 2025 – Friday 🔴
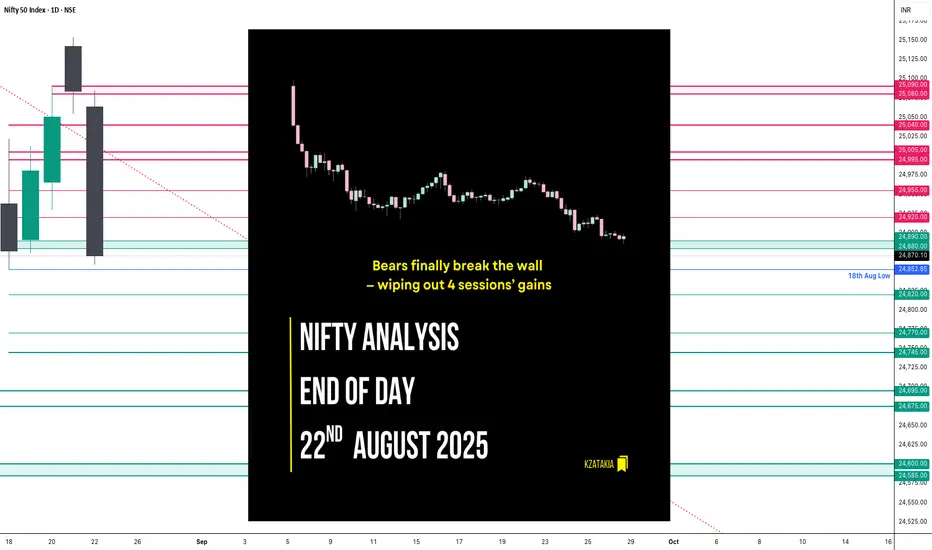
Bears finally break the wall — wiping out 4 sessions’ gains
🗞 Nifty Summary
Yesterday, we noted:
“Though the close is higher by +33 points vs the previous day, it left behind a red daily candle (close < open). This indicates fading bullish momentum, even though HH-HL structure is still intact. The range was narrow (≈98 points), categorising the day as range-bound, not sideways. The previous weekly expiry was also narrow yet sideways.”
That caution proved valid today. Right from the opening candle, Nifty broke the PDL + S1 zone, invalidating the HH-HL structure and giving bears a clean entry. The past two sessions’ range contraction added fuel to the breakdown, resulting in a 225-point fall.
The attempted defense at 24,995, 24,955, 24,920, and 24,890 provided only temporary halts, but the downside momentum was too strong. The day ended at 24,869.45, erasing gains of the last 4 sessions.
On the weekly chart, the index now resembles a bearish pin bar / inverted hammer, a sign of exhaustion at the top.
📌 For Monday:
If Nifty fails to hold 24,850–24,820, then 24,745 and 24,650 come into play.
Bulls must reclaim and close above 24,955 to hold their fort.
🛡 5 Min Intraday Chart with Levels
📌 Intraday Walk
Opened at 25,064.15 with mild optimism.
First 1-min candle → broke PDL + S1 decisively → bears in control.
Gradual fall → temporary fights at 24,995 → 24,955 → 24,920 → 24,890, but all failed.
Closing print at 24,870.10, almost at the day’s low.
📉 Daily Time Frame Chart with Intraday Levels
🕯 Daily Candle Breakdown
Open: 25,064.15
High: 25,084.85
Low: 24,859.15
Close: 24,870.10
Change: −213.65 (−0.85%)
🏗️ Structure Breakdown
Strong red candle (Close < Open)
Body: 194.05 points
Upper wick: 20.70 points
Lower wick: 10.95 points
Full-body bearish bar → strong downside momentum
📚 Interpretation
Sellers seized control after three days of stalling at 25,150–25,180.
Break below 25,000 confirms supply dominance.
Closing near day’s low = no recovery attempt → decisive distribution.
🕯️Candle Type
Bearish Marubozu-style → clear trend shift to sellers.
🛡 5 Min Intraday Chart
⚔️ Gladiator Strategy Update
ATR: 198.19
IB Range: 134.25 → Medium
Market Structure: ImBalanced
Trade Highlight:
9:20 → Short Trigger → Target Achieved (R:R = 1:2).
🕵️Range & Bias
Support zone: 24,850–24,820
Resistance zone: 25,000–25,080
Bias: Bearish momentum → “Sell on rise” until 25k is reclaimed.
📌 Support & Resistance Levels
🎚️ Resistance Zones
24,920
24,955
24,995 ~ 25,005
25,080 ~ 25,090
🎚️ Support Zones
24,850 ~ 24,820
24,770
24,745
24,695 ~ 24,675
💡 Final Thoughts
The market has shifted gears from cautious bullish to outright bearish, with 25,000 now acting as a supply zone. Unless bulls reclaim lost ground above 24,955–25,000, the slide toward 24,745–24,650 seems inevitable.
“Markets climb the stairs but take the elevator down — today, the elevator arrived.”
✏️ Disclaimer
This is my personal analysis — not investment advice. Please consult your financial advisor before trading.