Nifty Analysis EOD – August 1, 2025 – Thursday🟢 Nifty Analysis EOD – August 1, 2025 – Thursday 🔴
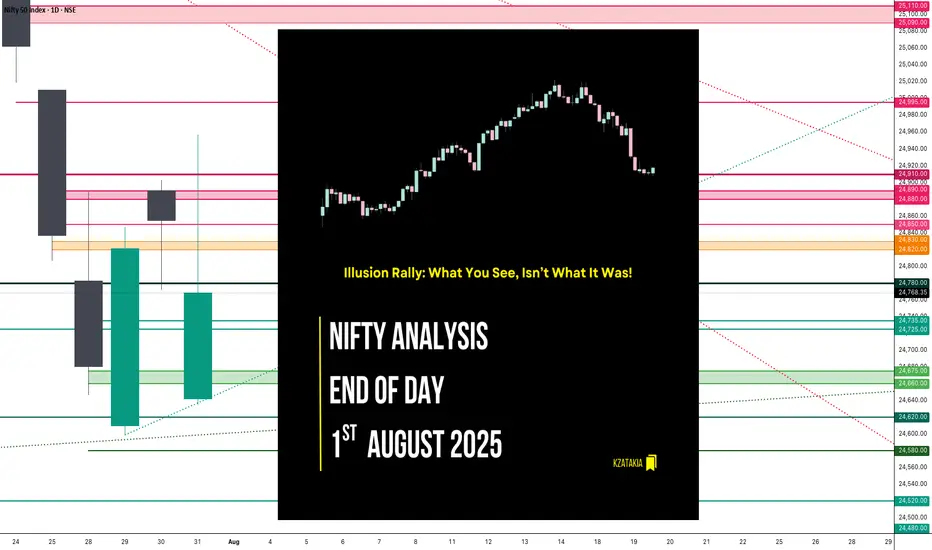
🎢 Illusion Rally: What You See, Isn’t What It Was!
🧾 Nifty Summary
As we all expected, a negative gap-down opening occurred due to external news. Nifty opened 183 points lower, tested the 24,660–24,675 support zone, then rebounded sharply after a symmetrical triangle + VWAP breakout. The rally pierced through all key levels like a hot knife through butter, topping at 24,950, only to reverse with equal intensity. Closed at 24,765.
📌 Despite the technical structure, today’s move had no clear technical reasoning — more likely triggered by a mix of tariff news, confidence in Modi, weekly + monthly expiry, and manipulation.
📌 in spite of a bullish candle, strong upper rejection from 24,950 hints weakness. Candle appears bullish on colour, but bears dominated intraday close — forming a bearish Moboroshi Candle (illusion of strength).
📌 Bearish Moboroshi Candle Structure : close > open and close < Previous Close
🔍 Intraday Walk
📉 Gap down of 183 pts
🟢 Support held at 24,660–24,675
🔺 Symmetrical triangle + VWAP breakout
🚀 Sharp upmove to 24,950 zone
🔁 Reversal with same intensity
📉 Closed at 24,765 — below prior close
🖼 5 Min Time Frame Chart with Intraday Levels
📉 Daily Time Frame Chart with Intraday Levels
🕯 Daily Candle Breakdown
Open: 24,642.25
High: 24,956.50
Low: 24,635.00
Close: 24,768.35
Change: −86.70 (−0.35%)
Candle Structure:
✅ Green Candle (Close > Open) → +126.10 pts real body
⬆️ Upper Wick → 188.15 pts (Very Long)
⬇️ Lower Wick → 7.25 pts (Tiny)
Interpretation:
Opened near yesterday's low
Intraday sharp rally towards 24,950+
Faced strong selling at highs
Closed above open, but way below high — signals clear rejection
Candle Type:
📌 Bearish Moboroshi Candle — Appears bullish but hides weakness
🧠 Buyers strong initially, but sellers took control at the top
Key Insight:
Bulls need decisive close above 24,880–24,910
Else, expect drift back toward 24,660–24,675
🛡 5 Min Intraday Chart
⚔️ Gladiator Strategy Update
ATR: 208.29
IB Range: 93.95 → Medium
Market Structure: Unbalanced
Trades Triggered:
✅ 10:40 AM – Long Entry → Trailing Target Hit (R:R – 1:6.25)
📌 Trade Summary: Big R:R win today on breakout with trailing logic execution!
🧱 Support & Resistance Levels
🔺 Resistance Zones:
24,820 ~ 24,830
24,850
24,880 ~ 24,890
24,910
🔻 Support Zones:
24,780
24,725 ~ 24,715
24,660 ~ 24,650
24,620 ~ 24,600
💭 Final Thoughts
"When the move can’t be explained, the best position is caution."
Today's market behavior reinforces the idea that not all moves are technical. Keep your tools sharp, but don’t ignore contextual chaos.
✏️ Disclaimer
This is just my personal viewpoint. Always consult your financial advisor before taking any action.
Nifty50levels
Nifty Analysis EOD – July 30, 2025 – Wednesday🟢 Nifty Analysis EOD – July 30, 2025 – Wednesday 🔴
Trapped in Illusion – A Day of Decoy Moves
Nifty moved 130 points today, falling short of the 2-week average range of 196 points. It formed its IB by 11:40 AM, marking the day's high and low early. For the rest of the session, it hovered between the IB high and the previous day high, eventually closing near the mean.
Despite a close below the open, Nifty managed a green close vs. the previous day—making it a classic "moboroshi candle" day, where visuals deceive sentiment.
📉 Intraday 5 Min Time Frame Chart
🪜 Intraday Walk
IB formed by 11:40 AM
False breakout on both sides trapped traders badly
Nifty stayed stuck between IB high and PDH
Closed slightly above the previous close, but below open
Eyes on breakout of 24,910 for targets of 24,995 and 25,090–25,110
🔄 Trend & Zone Update
📈 Resistance Zone Shifted To: 25,110 ~ 25,090
📉 Support Zone Shifted To: 24,520 ~ 24,480
🕯 Daily Time Frame Chart with Intraday Levels
🕯️ Daily Candle Breakdown
Candle Type: Small Red Hammer‑Like Candle (Decoy / Moboroshi)
Today’s OHLC:
🟢 Open: 24,890.40
🔺 High: 24,902.30
🔻 Low: 24,771.95
🔴 Close: 24,855.05
📈 Change: +33.95 (+0.14%)
📌 Candle Structure:
Real Body: 35.35 pts (Small bearish body)
Upper Wick: 11.90 pts (Very small)
Lower Wick: 83.10 pts (Long)
📌 Key Observations:
Buyers stepped in near 24,770 zone
Closed near open but slightly lower → mild net selling
Long lower wick indicates dip buying support
📌 Implication:
Buyers defended 24,770–24,780 zone
A reclaim of 24,900–24,920 may resume bullish move
A close below 24,770 weakens support
🛡 5 Min Intraday Chart
🛡️ Gladiator Strategy Update
ATR: 195.72
IB Range: 78.15 → Medium
Market Structure: Balanced
💥 Trades Triggered:
🕙 10:25 AM – Short Entry → SL Hit
📌 Trade Summary:
False IB breakouts on both sides led to a stop loss hit—typical trap in a tight consolidation phase.
📌 Support & Resistance Levels
📈 Resistance Zones:
24,880 ~ 24,890
24,910
24,995
25,090 ~ 25,110
📉 Support Zones:
24,830 ~ 24,820
24,780
24,725 ~ 24,715
24,660 ~ 24,650
🔮 What’s Next? / Bias Direction
Awaiting breakout above 24,910 for potential targets of 24,995 and 25,090–25,110. Consolidation may reward patient breakout players in upcoming sessions.
🧠 Final Thoughts
“Structure is key. When levels work, respect them. When they break, adapt.”
Today's range was narrow, but traps show signs of buildup. Be ready when the market unwinds.
✏️ Disclaimer
This is just my personal viewpoint. Always consult your financial advisor before taking any action.

Nifty Analysis EOD – July 29, 2025 – Tuesday🟢 Nifty Analysis EOD – July 29, 2025 – Tuesday 🔴
Bulls Strike Back After Trendline Trap & Break
Nifty started below the previous day's low, and after marking day low at 24,598.60, it rose to 24,725 where it faced the trendline and CPR zone. A sharp rejection from there quickly pushed Nifty back to the day's open level. A base-building process began, characterized by a low-range but high-volatility phase.
Gradually, Nifty crossed the VWAP and the trendline again, breaking the day's high and CPR zone, ultimately reaching R1 and closing near the highest point at 24,830.40.
In the first half, both long and short traders got trapped in fast swings—refer to the chart for visual cues.
🕯 5 Min Time Frame Chart with Intraday Levels
🔄 Trend & Zone Update
📈 Resistance Zone Shifted To: 25,110 ~ 25,090
📉 Support Zone Shifted To: 24,520 ~ 24,480
🕯 Daily Time Frame Chart with Intraday Levels
🕯 Daily Candle Breakdown
Open: 24,609.65
High: 24,847.15
Low: 24,598.60
Close: 24,821.10
Change: +140.20 (+0.57%)
🕯Candle Structure Breakdown:
Real Body: Green candle (Close > Open):
24,821.10 − 24,609.65 = 211.45 pts (large bullish body)
Upper Wick: 26.05 pts (small)
Lower Wick: 11.05 pts (very small)
🕯Interpretation:
Market opened lower but found strong buying support, rallying to nearly 24,850.
Closed near the day’s high—bulls dominated.
Tiny lower wick shows hardly any selling pressure after the open.
🕯Candle Type:
Bullish Marubozu-type — strong signal of reversal or continuation, indicating control by buyers.
🕯Key Insight:
Strong bounce from sub-24,600 back above 24,800 has improved short-term sentiment.
If 24,830–24,850 breaks in the next session, potential upside till 24,920–24,995.
Support now shifts to 24,700–24,720.
🛡 5 Min Intraday Chart
⚔️ Gladiator Strategy Update
ATR: 202.98
IB Range: 128.5 → Medium
Market Structure: Balanced
Trades Triggered:
🕒 11:10 AM – Long Entry → Target Hit 🎯 (1:3 Risk:Reward)
🧱 Support & Resistance Levels
Resistance Zones:
24,815 ~ 24,830
24,850
24,920
24,995
Support Zones:
24,725
24,693
24,660 ~ 24,650
🧠 Final Thoughts
“Volatility shakes the weak hands; structure empowers the patient.”
Today’s session was a textbook example of how the market tests conviction. After trapping early traders with sharp intraday swings, Nifty rewarded those who respected structure and waited for confirmation. The reclaim of the trendline, VWAP, and CPR zone reinforced the strength of bullish intent. If the momentum continues above 24,850, we may be entering a fresh leg of the uptrend—stay nimble, but don't lose sight of the bigger picture.
✏️ Disclaimer
This is just my personal viewpoint. Always consult your financial advisor before taking any action.

Nifty Analysis EOD – July 28, 2025 – Monday 🟢 Nifty Analysis EOD – July 28, 2025 – Monday 🔴
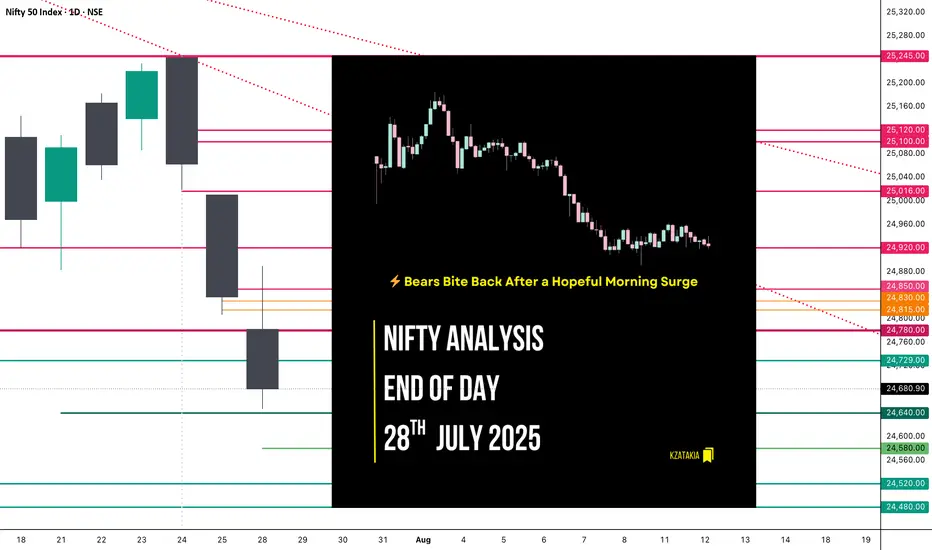
⚡️ Bears Bite Back After a Hopeful Morning Surge
📊 Nifty Summary
Nifty opened with a minor gap-down of 32 points and slipped an additional 67 points in the first 3 minutes, testing the critical support zone of 24,755 ~ 24,729. After marking a day low at 24,732.70, it witnessed a sharp recovery breaching key levels — CDO, Gap, PDC — and touched the CPR BC level. Rejection from there caused a retracement to the mean, followed by another successful attempt breaching CPR BC and IB High. However, it couldn’t sustain above, as profit booking and pressure from a higher time frame bearish trendline dragged the index below the CPR zone and even past the PDL.
Support at 24,780 offered brief relief, but a bearish triangle formed between the HTF trendline and that support and The breakdown at 12:40 led to a clean move, with the pattern target achieved.
🕯 5 Min Time Frame Chart with Intraday Levels
🔁 Trend & Zone Update
📍 Resistance Zone Shifted To: 25,100 ~ 25,120
📍 Support Zone Shifted To: 24,520 ~ 24,480
🧭 What If Plans – 29th July Outlook
🅰️ Plan A (Contra Long Setup)
If market opens inside the previous day range and finds support at 24,700 ~ 24,729,
→ Potential targets: 24,780, 24,815, 24,840
🅱️ Plan B (Trend is Friend – Short Continuation)
If market opens inside range and faces resistance around 24,830 ~ 24,815,
→ Aim for: 24,780, 24,720, 24,640, 24,580
🔄 On-the-Go Plan
If market Gaps Up/Down outside previous day’s range,
→ Wait for IB formation and act based on structure & S/R levels.
🕯 Daily Time Frame Chart with Intraday Levels
🕯 Daily Candle Breakdown
Open: 24,782.45
High: 24,889.20
Low: 24,646.60
Close: 24,680.90
Change: −156.10 (−0.63%)
🕯 Candle Structure Breakdown:
Real Body: 101.55 pts (Red candle, bearish)
Upper Wick: 106.75 pts (Long — rejection from highs)
Lower Wick: 34.30 pts (Defended slightly)
🕯 Interpretation:
Tried to rally above 24,880 but faced aggressive selling. Closed well below open, forming a bearish rejection candle resembling a shooting star. Bears clearly took control after the intraday bounce attempt.
🕯 Key Insight:
Selling pressure visible from 24,880–24,900 zone.
Close below 24,700 keeps bearish tone intact.
Next Support: 24,650–24,620.
Bulls' challenge: Reclaim and close above 24,850.
🛡 5 Min Intraday Chart
⚔️ Gladiator Strategy Update
ATR: 197.91
IB Range: 122 → Medium
Market Structure: Imbalanced
Trades Triggered:
09:27 – Long Entry → 🎯 Target Hit (1:1.5 R:R)
12:40 – Short Entry → 🎯 Target Hit (1:2.5 R:R)
🧱 Support & Resistance Levels
Resistance Zones:
📍 24,729
📍 24,780
📍 24,815 ~ 24,830
📍 24,850
📍 24,920
Support Zones:
📍 24,640
📍 24,580
📍 24,520 ~ 24,480
💭 Final Thoughts
🧠 “Every breakout starts with hesitation — but not every hesitation leads to a breakout.”
Today’s structure showed strong indecision, but sellers used it to dominate.
Monday’s triangle breakdown proved that structure plus patience = power. Keep your bias flexible and trust your levels.
✏️ Disclaimer
This is just my personal viewpoint. Always consult your financial advisor before taking any action.
Nifty Analysis EOD – July 25, 2025 – Friday🟢 Nifty Analysis EOD – July 25, 2025 – Friday 🔴
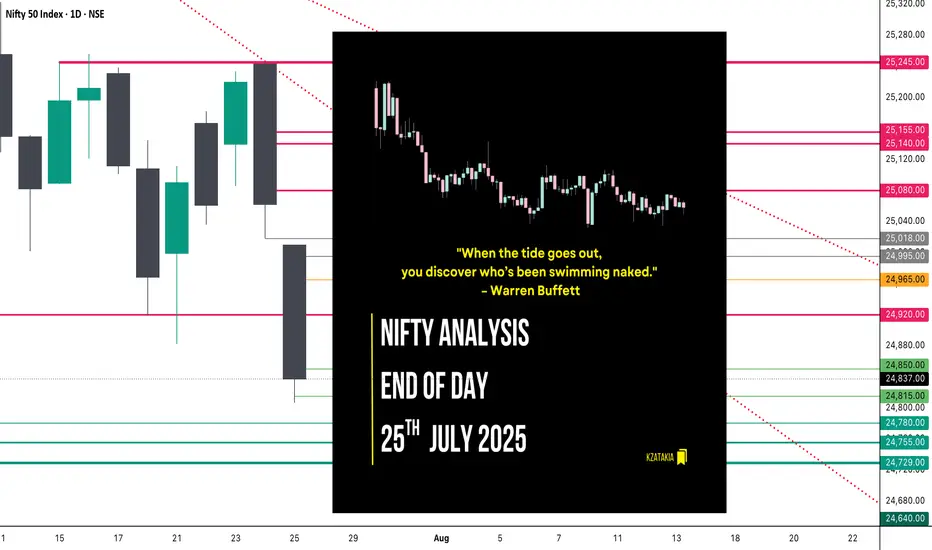
"When the tide goes out, you discover who’s been swimming naked." – Warren Buffett
Nifty GapDowns Below Key Support and Slips Further
The market opened with a sharp GapDown, breaching the previous day's low and instantly shedding 150 points within the first hour. Nifty attempted to find footing near the crucial 21st July low zone of 24,850–24,880, but the support gave way, slipping an additional 50 points.
The day mostly drifted around these lower levels with bearish dominance. Though bulls made an effort to recover late in the session, it lacked strength. The index finally settled at 24,837, decisively closing below the 21st July low — signalling a deeper structural breakdown.
📉 Trend & Zone Update
Resistance Zone Shifted To: 25,144 ~ 25,155
Support Zone Shifted To: 24,729 ~ 24,755
📊 What If Plans – 28th July Outlook
🅰️ Plan A (Contra Long Setup)
If market opens inside the previous day range and finds support at 24,815 ~ 24,850
Then potential targets are 24,920, 24,965, and 25,020
🅱️ Plan B (Trend is Friend – Short Continuation)
If market opens inside range and faces resistance around 24,965 ~ 24,995
Then aim for 24,850, 24,815, 24,780, and 24,730
⏸️ On-the-Go Plan
If market Gaps Up/Down outside previous day’s range
Then wait for the Initial Balance (IB) to form and act based on structure and S/R levels.
🕯 Daily Time Frame Chart with Intraday Levels
🕯 Daily Candle Breakdown
Open: 25,010.35
High: 25,010.35
Low: 24,806.35
Close: 24,837.00
Candle Structure
Body: Strong red candle (−173.35 pts)
Upper Wick: None (open = high)
Lower Wick: 30.65 pts
Interpretation:
A textbook bearish Marubozu — shows sellers had control throughout.
Bears stepped in immediately from open, preventing any bullish response.
Minimal lower wick implies limited buyer defense even at the session low.
Key Insight:
Bears are in command; bulls must reclaim 25,000+ quickly to prevent further downside.
If 24,800–24,820 breaks, eyes shift to 24,700–24,750 zone next.
🛡 5 Min Intraday Chart
⚔️ Gladiator Strategy Update
ATR: 192.95
IB Range: 87.4 → Medium
Market Structure: Imbalanced
Trades Triggered:
🕙 10:10 AM – Short Entry → 🎯 Target Hit (1:2.4 R:R)
🧭 Support & Resistance Levels
Resistance Zones
24,920
24,965
24,995 ~ 25,018
25,080
25,140 ~ 25,155
Support Zones
24,780
24,755 ~ 24,729
24,640
📌 Final Thoughts
When strong candles appear back-to-back with no meaningful recovery in between, it’s not just a correction — it’s a statement. In this market phase, reacting to price structure rather than assumptions will keep you on the right side. Stay nimble, stay prepared.
✏️ Disclaimer
This is just my personal viewpoint. Always consult your financial advisor before taking any action.
Nifty Analysis EOD – July 24, 2025 – Thursday 🟢 Nifty Analysis EOD – July 24, 2025 – Thursday 🔴
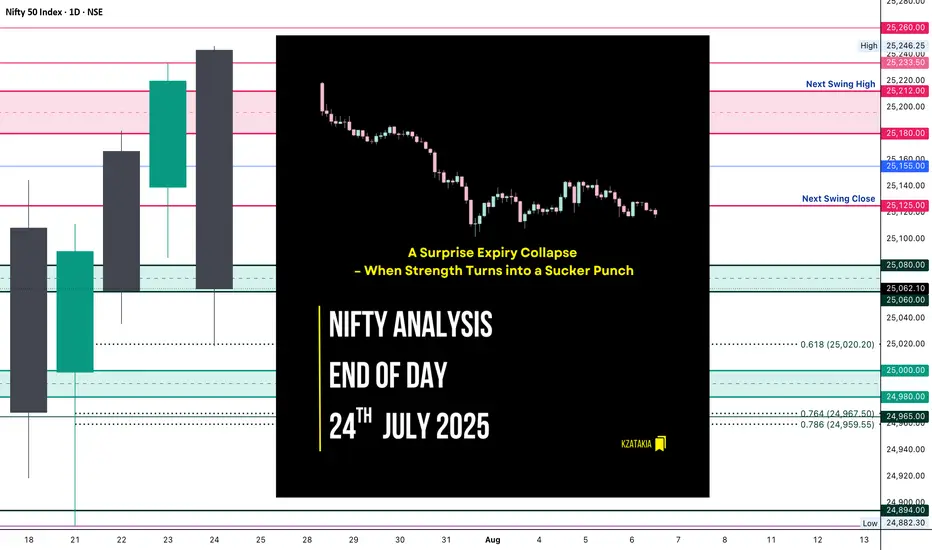
📉 A Surprise Expiry Collapse – When Strength Turns into a Sucker Punch
Today’s session was an unexpected twist.
Nifty opened above the previous day’s high, giving early hope to the bulls—but within the first hour, it slipped to 25,155 and formed its IB. What followed was a sharp 136-point fall, breaking not just yesterday’s low, but also the July 22nd low. This sudden bearish momentum was completely news-driven, and expiry-day long unwinding only added fuel to the fire.
Despite a strong close yesterday, today’s fall erased all of July 23rd’s gains and brought us right back to July 22nd’s close—neutralizing the recent upward effort.
The day closed at 25,062, marginally above key support. Technically, today’s low respected the 0.618 Fib retracement level drawn from July 21st’s low to July 23rd’s high—so a dead cat bounce is possible if no further bad news hits. But if we open below 25,050 tomorrow, expect more downside pressure toward 24,960–24,890 zones.
🕯 5 Min Time Frame Chart with Intraday Levels
🕯 Daily Time Frame Chart with Intraday Levels
🕯 Daily Candle Breakdown
Open: 25,243.30
High: 25,246.25
Low: 25,018.70
Close: 25,062.10
Change: −157.80 (−0.63%)
Candle Structure Analysis:
🔴 Body: Large red body (181.2 pts) shows strong intraday selling.
☁️ Upper Wick: Tiny (2.95 pts) → sellers dominated from the start.
🌊 Lower Wick: Moderate (43.4 pts) → small recovery near close.
Candle Type:
Almost a bearish Marubozu — clear domination by sellers with barely any upper shadow, signaling intense sell pressure.
Key Insight:
Bulls lost control after open.
Bears took charge below 25,155.
Close near support, but bias cautious.
Bulls must reclaim 25,150+ for recovery, else 25,000 may give way.
🛡 5 Min Intraday Chart
⚔️ Gladiator Strategy Update
ATR: 185.97
IB Range: 83.55 → Medium
Market Structure: Balanced
Trades Triggered:
⏰ 10:05 AM – Short Entry → SL Hit
⏰ 11:10 AM – Short Entry → Target Hit (1:3.6 Risk:Reward)
📊 Support & Resistance Levels
Resistance Zones:
25,125
25,155
25,180 ~ 25,212
25,233
Support Zones:
25,080 ~ 25,060
25,020
25,000 ~ 24,980
24,967 ~ 24,959
24,882
🔮 What’s Next?
A gap-up or stable open may trigger a dead cat bounce toward 25,150–25,180.
A gap-down below 25,050 confirms bearish continuation → next targets: 24,960 / 24,890.
Watch price action around the 25,020–25,060 zone closely.
🧠 Final Thoughts
“Markets are never wrong – opinions often are.”
— Jesse Livermore
Today was a reminder of how expiry day surprises and news flows can flip the narrative. Stay flexible, and keep a bias—but not a blind one.
✏️ Disclaimer
This is just my personal viewpoint. Always consult your financial advisor before taking any action.
Nifty Analysis EOD – July 23, 2025 – Wednesday 🟢 Nifty Analysis EOD – July 23, 2025 – Wednesday 🔴
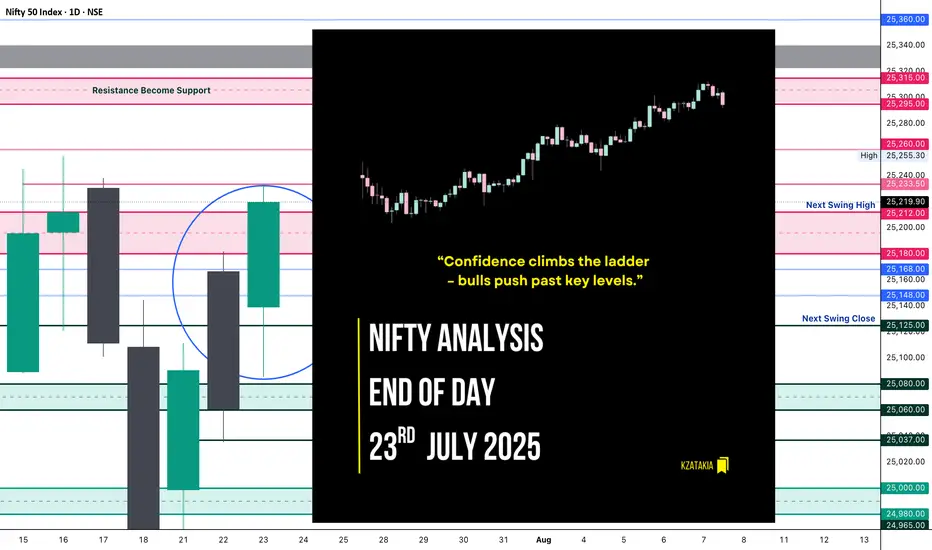
“Confidence climbs the ladder – bulls push past key levels.”
Nifty opened with a Gap Up of 78 points and initially retraced 54 points, finding solid footing around the CPR Zone. Once reclaimed VWAP, the index climbed in a methodical, low-volatility uptrend, breaking one resistance after another: CDH, R1, 25150, PDH, and the key zone 25200~25212 — finally touching the anticipated resistance at 25333, and closing just below that at 25219.90, close to the day’s high.
📌 Flashback from Yesterday's Note:
“If this is truly a retracement, 25K must hold in upcoming sessions, and bulls will need to reclaim 25,200 to regain their grip.”
👉 This expectation played out to perfection today — gradual yet confident bullish strength led Nifty to reclaim 25200 and close above it.
🔍 Today’s close of 25220 is higher than the last 7 sessions, suggesting a bullish shift in structure. However, bulls now face the real test — breaching the 25300 ~ 25350 resistance zone.
🕯 5 Min Time Frame Chart with Intraday Levels
🕯 Daily Time Frame Chart with Intraday Levels
🕯️ Daily Candle Breakdown
Open: 25,139.35
High: 25,233.50
Low: 25,085.50
Close: 25,219.90
Change: +159.00 (+0.63%)
Candle structure analysis:
Real body: Green body = 80.55 pts → strong bullish body
Upper wick: 13.60 pts → very small
Lower wick: 53.85 pts → moderate
Candle Interpretation:
The session opened stable, dipped to 25,085, but strong buyers showed up, helping price climb throughout the day and close near high. A firm green candle, signaling buyers in control.
Candle Type:
A Bullish Marubozu–like candle, not perfectly clean but represents strong continuation momentum.
Key Insight:
Close above 25200 confirms a bullish grip
If price holds above 25220–25250, next push could be towards 25280–25330
Immediate support now moves to 25,120–25,140
🛡 5 Min Intraday Chart
⚔️ Gladiator Strategy Update
ATR: 181.35
IB Range: 64.35 → Medium
Market Structure: Balanced
Trades Triggered:
⏱️ 10:45 AM – Long Entry → Trailing SL Hit (1:2.65 RR)
🔁 Support & Resistance Levels
Resistance Zones:
25,180 ~ 25,212
25,233
25,260
25,295 ~ 25,315
25,340 ~ 25,322 (Gap Zone)
Support Zones:
25,168
25,125
25,080 ~ 25,060
25,037
🧠 Final Thoughts
“Momentum is not magic—it’s built one level at a time.”
Bulls showed strength with control and consistency today. With 25200 reclaimed, they now hold the ball — next challenge lies at the gates of 25300–25350. Will they break through or pause for breath? Tomorrow holds the answer.
✏️ Disclaimer:
This is just my personal viewpoint. Always consult your financial advisor before taking any action.
Nifty Analysis EOD – July 22, 2025 – Tuesday🟢 Nifty Analysis EOD – July 22, 2025 – Tuesday 🔴
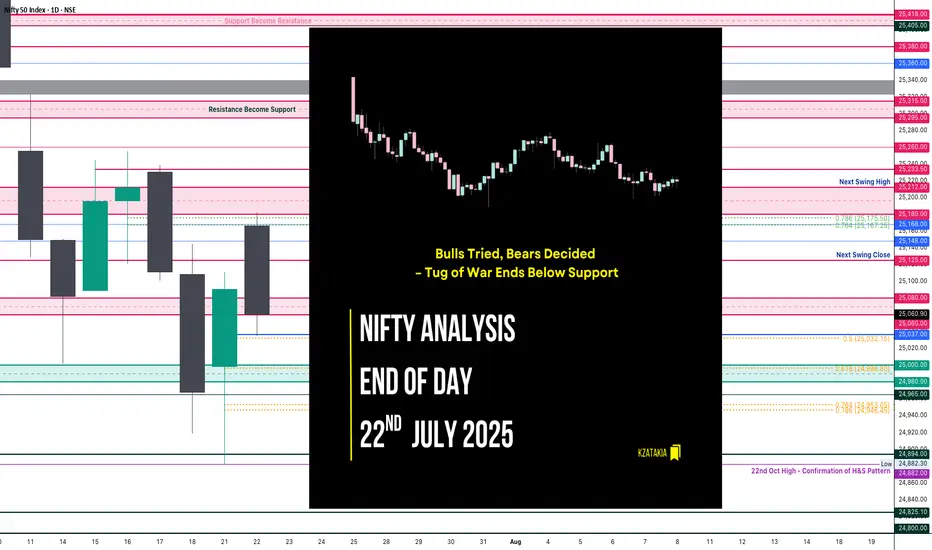
"Bulls Tried, Bears Decided – Tug of War Ends Below Support"
Nifty opened with an 88-point gap-up, continuing the bullish sentiment, right at the resistance zone of 25,180 ~ 25,212. However, the market opened at the high (OH) and quickly slipped around 100 points to form the Initial Balance (IB). After a brief bounce back to the mean, it faced resistance, leading to a breakdown of IB and further losses of 77 points.
A supportive bounce emerged near 25,060 ~ 25,080, but the price was pushed down again by PDH + VWAP + R1. The day closed below PDC and under the support zone at 25,065, showing bearish dominance despite a volatile tug-of-war between bulls and bears.
Today’s low tested the 0.5 Fibonacci retracement level (from yesterday’s low to today’s high). If this is truly a retracement, 25K must hold in upcoming sessions, and bulls will need to reclaim 25,200 to regain their grip.
🕯 5 Min Time Frame Chart with Intraday Levels
🕯 Daily Time Frame Chart with Intraday Levels
📊 Daily Candle Breakdown
Open: 25,166.65
High: 25,182.00
Low: 25,035.55
Close: 25,060.90
Change: −29.80 (−0.12%)
Candle Structure:
Real Body: Red (−105.75 pts) → Decent bearish body
Upper Wick: 15.35 pts → Small
Lower Wick: 25.35 pts → Moderate
Interpretation:
Price opened strong but faced selling near 25,180, leading to a steady drop throughout the session. The lower wick shows some buying attempt near 25,035, but the close below open signals bears dominated.
Candle Type:
Bearish candle with moderate lower wick – resembles a Bearish Engulfing setup after a green candle, suggesting profit-booking or fresh selling.
Key Insight:
Sellers defending 25,180–25,200 firmly
Holding above 25,030–25,050 is critical; breaking this could retest 24,950–25,000
Bulls must reclaim 25,120–25,150 for momentum revival
🛡 5 Min Intraday Chart
⚔️ Gladiator Strategy Update
ATR: 182.32
IB Range: 92.6 → Medium
Market Structure: Balanced
Trades Triggered:
10:45 AM – Short Trade → Trailing SL Hit (1:0.8)
12:45 PM – Long Trade → SL Hit
📌 Support & Resistance Levels
Resistance:
25,080 ~ 25,060
25,125
25,168
25,180 ~ 25,212
Support:
25,037
25,000 ~ 24,980
24,965
24,894 ~ 24,882
24,825
24,800 ~ 24,768
🧠 Final Thoughts:
"Markets often dance between zones of power — where bulls flex and bears press. It's not chaos, it's the choreography of sentiment."
The 25,000–25,212 zone continues to be the battlefield. Let’s see who seizes the upper hand tomorrow.
✏️ Disclaimer:
This is just my personal viewpoint. Always consult your financial advisor before taking any action.
Nifty Analysis EOD – July 21, 2025 – Monday 🟢 Nifty Analysis EOD – July 21, 2025 – Monday 🔴
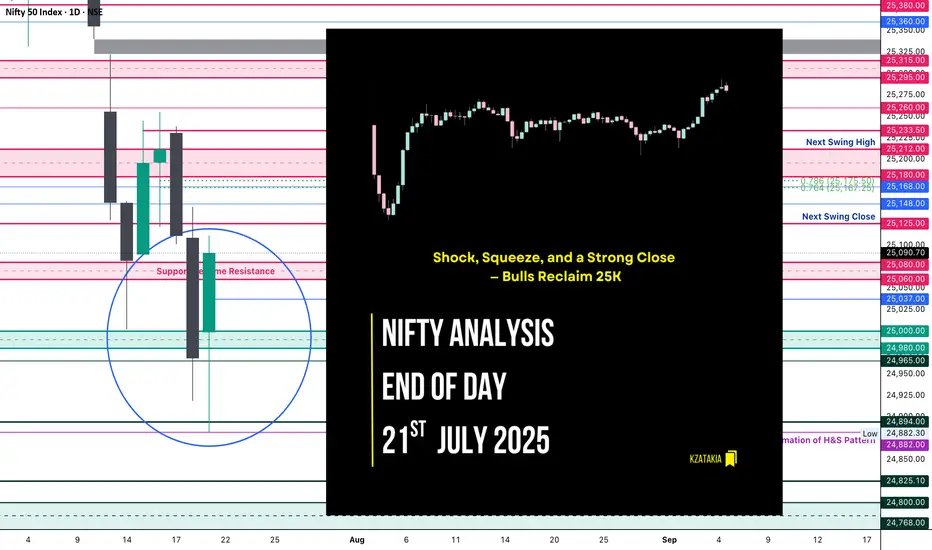
“Shock, Squeeze, and a Strong Close — Bulls Reclaim 25K”
Today’s move was nothing short of shocking. In the first 45 minutes, Nifty plunged more than 150 points, breaking through key levels and touching 24,882. But what followed was a V-shaped recovery that caught both Friday’s shorts and those who shorted below PDC/PDL completely off guard.
The index powered up to mark a day high of 25,080, and sustained above CPR and VWAP throughout most of the session. A final push came around 2:55 PM, breaking the intraday trendline and CDH, registering a fresh high before closing near the top at 25,090.70.
✅ Bulls not only held 25K — they dominated the battlefield all day, recovering almost everything lost during Friday’s drop.
🕯 5 Min Time Frame Chart with Intraday Levels
🕯 Daily Time Frame Chart with Intraday Levels
🕯 Daily Candle Breakdown
Open: 24,999.00
High: 25,111.40
Low: 24,882.30
Close: 25,090.70
Change: +122.30 (+0.49%)
📊 Candle Structure Breakdown
Real Body: 91.70 points → strong bullish body
Upper Wick: 20.70 points → slight hesitation near highs
Lower Wick: 116.70 points → deep intraday buying from the lows
🔍 Interpretation
Mildly negative open, followed by a sharp 150-point fall
Buyers stepped in strongly near 24,880, triggering a sharp reversal
V-shape recovery sustained above CPR & VWAP, closing near high
Close is not just above open — it’s above Friday’s close and 25K mark
🕯 Candle Type
Hammer-like Bullish Reversal Candle — Long lower wick with green body, signaling strong dip buying and possible short-term trend reversal
📌 Key Insight
Strong defense at 24,880–24,900 created the base for reversal
Close above 25,090 shifts near-term bias in favor of bulls
25,110–25,140 is the next resistance to watch
As long as we stay above 24,900, buyers hold the edge
🛡 5 Min Intraday Chart
⚔️ Gladiator Strategy Update
ATR: 186.31
IB Range: 166.8 → Wide IB
Market Structure: 🟡 Balanced
📉 Trades Triggered:
10:09 AM – Long Trade → ❌ SL Hit
📌 Support & Resistance Levels
Resistance Levels:
25,080 ~ 25,060
25,125
25,168
25,180 ~ 25,212
Support Levels:
25,037
25,000 ~ 24,980
24,965
24,894 ~ 24,882
24,825
24,800 ~ 24,768
💭 Final Thoughts
🧠 “Volatility doesn’t confuse the market — it reveals who’s in control.”Today’s V-shaped reversal erased all doubts from Friday’s fall. Buyers didn’t just defend — they counterattacked and reclaimed 25K with authority.Follow-through above 25,125 on Monday could confirm trend resumption.
✏️ Disclaimer
This is just my personal viewpoint. Always consult your financial advisor before taking any action.
Nifty Analysis EOD – July 18, 2025 – Friday🟢 Nifty Analysis EOD – July 18, 2025 – Friday 🔴
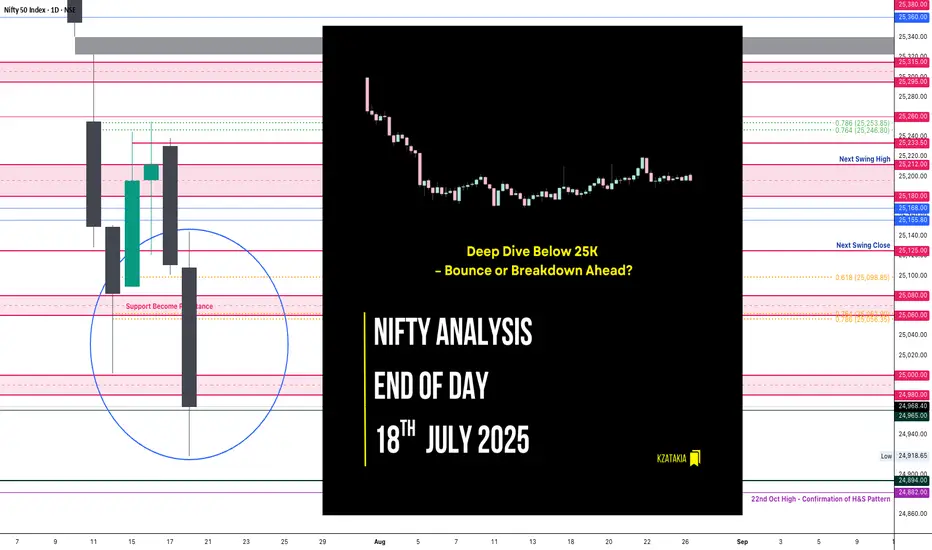
“Deep Dive Below 25K – Bounce or Breakdown Ahead?”
As we discussed yesterday, a big move was on the cards — and Nifty delivered.
The index started flat to negative, and from the opening tick, sellers took firm control. It sharply broke through multiple key supports: PDC, PDL, S1, the important 25,080–25,060 support zone, swing low, 25,000–24,980, and even 24,965.
Buyers finally showed up near 24,920, a crucial level, and pulled off a modest 86-point recovery. The session ended at 24,968.40, still below the psychological 25,000 mark and the fractal swing low of July 14.
🕯 5 Min Time Frame Chart with Intraday Levels
🔍 Mixed Signals:
✅ Positive: Today’s low aligns with the 0.618 Fib retracement from the June 13 low to June 30 high — potential support zone.
✅ Positive: RSI(3 of 3) shows bullish divergence — early reversal sign?
❌ Negative: Closed below July 14 swing low — weak structural signal.
❌ Negative: Below 25,000 — psychological breakdown.
❓Now the big question: Will this bearish move continue, or is it a fakeout before reversal?
You're still bullish on the overall daily trend, but tactically bearish for intraday until a close above 25,125 confirms strength.
🕯 Daily Time Frame Chart For Additional View
🕯 Daily Time Frame Chart with Intraday Levels
🕯 Daily Candle Breakdown
Open: 25,108.55
High: 25,144.60
Low: 24,918.65
Close: 24,968.40
Change: −143.05 (−0.57%)
📊 Candle Structure Breakdown
Real Body: 140.15 pts → Large red bearish body
Upper Wick: 36.05 pts → rejection near early highs
Lower Wick: 49.75 pts → dip buying near 24,920
🔍 Interpretation
Mildly negative open with early strength attempt near 25,140
Sharp decline through major support zones
Buyers stepped in at 24,920, but recovery lacked follow-through
Close below 25K and key swing low confirms steady intraday selling pressure
🕯 Candle Type
Strong Bearish Candle with both wicks — sellers dominated, but not without some resistance from buyers at the lows.
📌 Key Insight
Short-term bearish momentum confirmed
24,920–24,890 is next critical support; breakdown may extend to 24,882–24,825
Bulls need to close above 25,125+ to reclaim control
🛡 5 Min Intraday Chart
⚔️ Gladiator Strategy Update
ATR: 181.56
IB Range: 126.45 → Medium IB
Market Structure: 🔴 Imbalanced
🟢 Trades Triggered:
09:42 AM – Short Trade → ✅ Trailed SL Hit Profit (R:R = 1 : 3.87)
📌 Support & Resistance Levels
Resistance Levels:
24,980 ~ 25,000
25,080 ~ 25,060
25,125
25,168
25,180 ~ 25,212
Support Levels:
24,965
24,894 ~ 24,882
24,825
24,800 ~ 24,768
💭 Final Thoughts
“Sometimes markets fall not to reverse, but to recharge.”
Today’s drop pierced major support zones, but the bounce from 0.618 Fib hints at possible resilience.
Structure needs clarity — Monday’s session will reveal whether this was a trap or fuel for bears.
✏️ Disclaimer
This is just my personal viewpoint. Always consult your financial advisor before taking any action.
Nifty Analysis EOD – July 17, 2025 – Thursday🟢 Nifty Analysis EOD – July 17, 2025 – Thursday 🔴
📉 Sellers Grip Expiry Day — Big Move Loading?
Nifty started again with an OH (Open = High) formation and slipped down 94 points before 10:30 AM, marking the day’s low at 25,144. During this fall, it broke the support zone of 25,212 ~ 25,180. Although a retracement followed, it couldn’t sustain above the mean and eventually broke below the previous day’s low (PDL), closing at 25,111.45.
The weekly expiry was wild and volatile — especially from 12:30 to 2:30 PM. Interestingly, if we consider the total range of the last three sessions, it is just 166 points — well below average. This suggests a phase of consolidation. A significant move may emerge once Nifty decisively breaks the broader zone of 25,000 to 25,255.
🕯 5 Min Time Frame Chart with Intraday Levels
🕯 Daily Time Frame Chart with Intraday Levels
📊 Daily Candle Breakdown
Open: 25,230.75
High: 25,238.35
Low: 25,101.00
Close: 25,111.45
Change: −100.60 (−0.40%)
Candle structure breakdown:
Real body:
Red candle (Close < Open): 25,230.75 − 25,111.45 = 119.30 points → Decent-sized bearish body
Upper wick:
25,238.35 − 25,230.75 = 7.60 points → Very small
Lower wick:
25,111.45 − 25,101.00 = 10.45 points → Small
Interpretation:
Nifty opened slightly lower, made a weak attempt upward, then saw consistent selling throughout the day, closing near the session’s low. The negligible wicks indicate that sellers were in full control, and buyers had little room to fight back.
Candle Type:
A strong bearish candle (almost Marubozu) with very small wicks → Clear dominance by sellers.
Key Insight:
The test of the 25,100 zone again shows weakening bullish strength.
If the next session breaks below 25,100, the fall may extend toward 25,000–25,050.
For bulls to regain short-term momentum, a close above 25,200–25,220 is necessary.
🛡 5 Min Intraday Chart
⚔️ Gladiator Strategy Update
ATR: 176.62
IB Range: 60.85 → Medium IB
Market Structure: Balanced
Trades Triggered:
🕒 10:53 AM – Long Trade → Trailed SL Hit Profit (R:R = 1:0.42)
🧭 What’s Next? / Bias Direction
The market is coiling within a narrow range across multiple sessions, hinting at a potential breakout move.
📌 Watch Zone: 25,000 to 25,255
🔻 A break below 25,000 may open 24,950–24,900
🔺 A close above 25,260 could drive price toward 25,350+
Bias remains neutral-to-bearish unless bulls reclaim 25,220 decisively.
🧱 Support & Resistance Levels
Resistance Levels
25,168
25,180 ~ 25,212
25,260
25,295 ~ 25,315
Support Levels
25,125
25,080 ~ 25,060
25,000 ~ 24,980
24,965
🧠 Final Thoughts
"Structure is key. When levels work, respect them. When they break, adapt."
Three sessions of compression hint at expansion soon — stay alert and trade level-to-level with discipline.
✏️ Disclaimer
This is just my personal viewpoint. Always consult your financial advisor before taking any action.

Nifty Analysis EOD – July 16, 2025 – Wednesday🟢 Nifty Analysis EOD – July 16, 2025 – Wednesday 🔴
"Bounce Back with Caution: Bulls Show Up, But Still Not in Full Control"
Nifty started the day on a flat note, but the opening candle turned out to be the day’s high, and from there, it quickly lost 91 points, marking the day’s low at 25,121 within the first hour. The early pressure gave a bearish opening tone, but bulls gradually stepped in.
Around 11:45 AM, Nifty broke above the VWAP–Day Low range, crossed the CPR zone, and then pushed toward PDH. It did make one attempt to break PDH, but failed, resulting in a slow drift downward toward VWAP and CPR into the close. The day ended at 25,212.05, nearly at CPR — a zone of indecision.
📉 The structure shows sharp reversal from the lows, but also clear hesitation near resistance zones. The session was volatile, forming a typical pre-expiry pattern with mixed sentiment. Bulls must take charge tomorrow by crossing the 25,250–25,260 zone to regain strength.
🕯 5 Min Time Frame Chart with Intraday Levels
🕯 Daily Time Frame Chart with Intraday Levels
🕯 Daily Candle Breakdown
Open: 25,196.60
High: 25,255.30
Low: 25,121.05
Close: 25,212.05
Change: +16.25 (+0.06%)
📊 Candle Structure Breakdown
Real Body: 15.45 points → small green body
Upper Wick: 43.25 points
Lower Wick: 75.55 points → significant downside recovery
🔍 Interpretation
Market opened flat, dropped quickly to test 25,120 zone
Strong buying emerged after initial fall
Buyers lifted the index above CPR, but failed to hold breakout above PDH
Candle closes with long lower wick → buyers defended dip, but lacked closing dominance
🕯 Candle TypeSpinning Top with Long Lower Wick — often a neutral to mildly bullish candle, suggesting buying interest at lower levels, but with uncertain momentum.
📌 Key Insight
Bulls clearly defended the 25,120–25,125 support zone
Momentum will only resume above 25,250–25,260, leading to targets around 25,300–25,315
Failure to hold 25,120 could reopen downside toward 25,000–25,050
🛡 5 Min Intraday Chart
⚔️ Gladiator Strategy Update
ATR: 180.99
IB Range: 91.20 → Medium IB
Market Structure: 🟡 Balanced
Trades Triggered
11:34 AM – Long Trade → ✅ Target Achieved, Trailed SL Hit (R:R 1:2.42)
📌 Support & Resistance Zones
Resistance Levels
25,168
25,180 ~ 25,212
25,260
25,295 ~ 25,315
Support Levels
25,125
25,080 ~ 25,060
25,000 ~ 24,980
24,965
💭 Final Thoughts
“Structure is forming — but conviction is lacking. Let expiry day bring clarity. Above 25,260 we fly, below 25,120 we fall.”
✏️ Disclaimer
This is just my personal viewpoint. Always consult your financial advisor before taking any action.

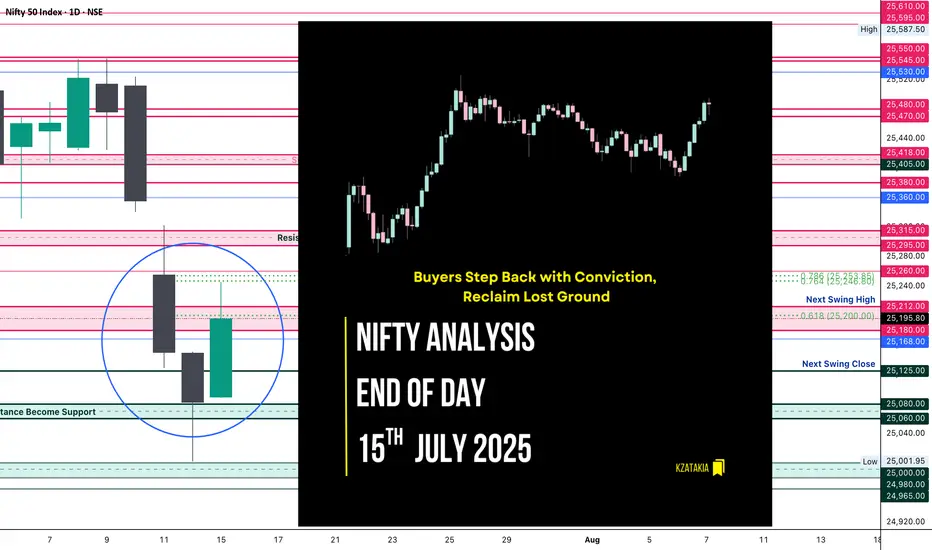
Nifty Analysis EOD – July 15, 2025 – Tuesday🟢 Nifty Analysis EOD – July 15, 2025 – Tuesday 🔴
"Buyers Step Back with Conviction, Reclaim Lost Ground"
Nifty began the session with a flat-to-positive tone, and the first 5-minute candle confidently added 60 points, pushing the index toward 25,150 – aligning with the Previous Day High (PDH). However, the level couldn't hold on the first attempt and Nifty slipped back to the day's open. After a brief consolidation, bulls made a strong comeback.
The second push broke through the PDH, Day High, and the resistance zone of 25,180–25,212, and extended the move up to mark the day’s high at 25,245.20. Post that, the index hovered above the breakout zone and closed solidly at 25,195.80, showing strength and follow-through.
📈 The day’s structure was clean and directional — a healthy bounce and hold above critical levels, reinforcing the idea that buyers are regaining control after last week’s consolidation and weakness.
🕯 5 Min Time Frame Chart with Intraday Levels
🕯 Daily Time Frame Chart with Intraday Levels
🕯 Daily Candle Breakdown
Open: 25,089.50
High: 25,245.20
Low: 25,088.45
Close: 25,195.80
Change: +113.50 (+0.45%)
📊 Candle Structure Breakdown
Real Body: 106.30 points – strong green bullish body
Upper Wick: 49.40 points – profit-taking or resistance at highs
Lower Wick: 1.05 points – negligible dip from open
🔍 Interpretation
Opened flat and quickly built momentum.
Temporary pullback in first 15 minutes was bought into strongly.
Closed with a clean green body, showing clear intraday bullish intent.
Holding above the 25,180–25,212 zone is a big win for bulls.
🕯 Candle Type
Bullish Marubozu-like (strong green body with minimal lower wick) — shows conviction and potential start of a new upswing post recent chop.
📌 Key Insight
25,080–25,100 is now a key base and must be protected.
If Nifty can break and hold above 25,240–25,250, a move toward 25,295–25,315 looks likely.
Failure to hold above 25,180 would be first sign of hesitation.
🛡 5 Min Intraday Chart
⚔️ Gladiator Strategy Update
ATR: 186.18
IB Range: 67.35 → Medium IB
Market Structure: 🟢 Balanced
Trades Triggered
10:30 AM – Long Trade → ✅ Target Achieved, Trailed SL (R:R 1:2.48)
📌 Support & Resistance Zones
Resistance Levels
25,168
25,180 ~ 25,212
25,260
25,295 ~ 25,315
Support Levels
25,125
25,080 ~ 25,060
25,000 ~ 24,980
24,965
💭 Final Thoughts
"Trend is nothing without follow-through — today buyers showed up, but tomorrow they must push past 25,250 to prove it wasn't just a bounce."
✏️ Disclaimer
This is just my personal viewpoint. Always consult your financial advisor before taking any action.
Nifty Analysis EOD – July 14, 2025 – Monday🟢 Nifty Analysis EOD – July 14, 2025 – Monday 🔴
"Broken Support, Fought Resistance – Tug of War in Play"
Nifty began the day with a classic Open = High (OH) setup, instantly rejecting any bullish intent. The crucial support zone of 25,080–25,060 was taken out early, and the market went on to mark the day's low at 25,001.95, a level that quickly turned into a decisive battleground.
After a bounce from the low, 25,125 emerged as a stiff resistance that pushed the index back below the broken support zone. For most of the session, the same support zone turned into resistance — a textbook polarity flip. However, in the final hour, Nifty showed resilience and finally closed back above 25,080, ending the session at 25,082.30.
🔄 The structure was full of failed intraday breakouts, signaling confusion and conflict — likely fueled by a wider CPR, imbalanced market structure, and medium IB of 109 pts. It was a low-volatility session, but packed with psychological tests.
🕯 5 Min Time Frame Chart with Intraday Levels
🕯 Daily Time Frame Chart with Intraday Levels
🕯 Daily Candle Breakdown
Open: 25,149.50
High: 25,151.10
Low: 25,001.95
Close: 25,082.30
Change: −67.55 (−0.27%)
📊 Candle Structure Breakdown
Real Body: 67.20 points – small to moderate bearish body
Upper Wick: 1.60 points – negligible upside attempt
Lower Wick: 80.35 points – strong defense from day’s low
🔍 Interpretation
Opened higher but got instantly rejected (OH formation).
Sellers took charge early but failed to hold momentum all the way.
The long lower wick reflects buyer presence at key 25,000 zone.
The close below open but above reclaimed support suggests tug of war — with bulls slightly redeeming themselves by EOD.
🕯 Candle Type
Hammer-like red candle — while bearish on close, the long lower shadow indicates potential exhaustion of selling and hints at reversal if follow-through buying emerges next session.
📌 Key Insight
25,000–25,020 has emerged as crucial near-term support.
A strong open or close above 25,150–25,180 may confirm a bullish reversal setup.
Breakdown below 25,000 opens the door for a fall toward 24,950 or lower.
🛡 5 Min Intraday Chart
⚔️ Gladiator Strategy Update
ATR: 188.77
IB Range: 109.20 → Medium IB
Market Structure: 🔴 Imbalanced
Trades Triggered
09:50 AM – Long Trade → ❌ SL Hit
01:05 PM – Short Trade → ❌ SL Hit
📉 Tough day for directional trades — false breakouts dominated.
📌 Support & Resistance Zones
Resistance Levels
25,125
25,168
25,180 ~ 25,212
25,260
25,295 ~ 25,315
Support Levels
25,080 ~ 25,060
25,000 ~ 24,980
24,965
💭 Final Thoughts
“Reclaimed ground doesn’t mean victory – yet. Watch the next move. Rejection below 25,000 ends the bulls' narrative; a strong move above 25,180 rewrites it.”
✏️ Disclaimer
This is just my personal viewpoint. Always consult your financial advisor before taking any action.

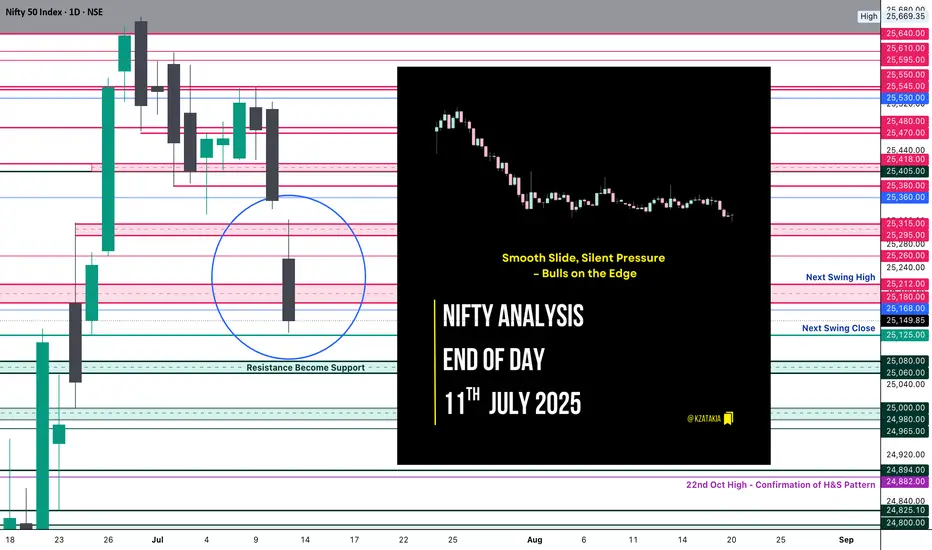
Nifty Analysis EOD – July 11, 2025 – Friday🟢 Nifty Analysis EOD – July 11, 2025 – Friday 🔴
"Smooth Slide, Silent Pressure – Bulls on the Edge"
Nifty opened with a 60-point gap-down, and despite an initial attempt to fill the gap with a 40-point bounce, the index couldn’t sustain. What followed was classic, smooth selling pressure — a slow bleed marked by 16 consecutive 5-minute candles that never broke the previous candle’s high.
There was no panic, just a persistent drift downward. The day’s structure was a silent yet firm rejection from higher levels, with 25,150 acting as an anchor for most of the session, eventually closing near 25,140.
📉 This session marks a revisit to the breakout zone of June 26–27.
Is this a false breakout or a healthy retest?
Only time — and a bounce or breakdown from 25,080–25,060 — will tell.
⚠️ If we close below 25,000, the entire bullish move from late June might be invalidated.
But a sharp bounce from the 25080–25060 zone could spark a hopeful reversal setup.
🕯 5 Min Time Frame Chart with Intraday Levels
🕯 Daily Time Frame Chart with Intraday Levels
🕯 Daily Candle Breakdown
Open: 25,255.50
High: 25,322.45
Low: 25,129.00
Close: 25,149.85
Change: −205.40 (−0.81%)
📊 Candle Structure Breakdown
Real Body: 105.65 points – clean bearish body
Upper Wick: 66.95 points – buyers rejected
Lower Wick: 20.85 points – weak defense at bottom
🔍 Interpretation
Price opened weak and stayed weak.
An intraday push to 25,320 was sharply sold into.
Closing near the day’s low shows full bear control.
Minimal bounce from day low indicates lack of bullish confidence.
🕯 Candle Type
A Bearish Rejection Candle – resembles an inverted hammer in a downtrend; suggests sellers still strong and bulls hesitant
📌 Key Insight
The zone of 25,320–25,350 has turned into firm intraday resistance.
25,100–25,130 is the immediate make-or-break support — below that lies 25,000–25,050.
For bulls to breathe again, we need a bounce and hold above 25,250–25,300.
🛡 5 Min Intraday Chart
⚔️ Gladiator Strategy Update
ATR: 193.17
IB Range: 78.45 → Medium IB
Market Structure: 🔴 Imbalanced
Trades Triggered
10:21 AM – Short Trade → 🎯 Trailing SL Hit (R:R 1:2.41)
📌 Support & Resistance Zones
Resistance Levels
25,168
25,180 ~ 25,212
25,260
25,295 ~ 25,315
Support Levels
25,125
25,080 ~ 25,060
25,000 ~ 24,980
24,965
💭 Final Thoughts
"It wasn’t a crash, it was a quiet rejection — and that makes it more dangerous. If bulls don’t show up now, bears might get bolder from here."
✏️ Disclaimer
This is just my personal viewpoint. Always consult your financial advisor before taking any action.
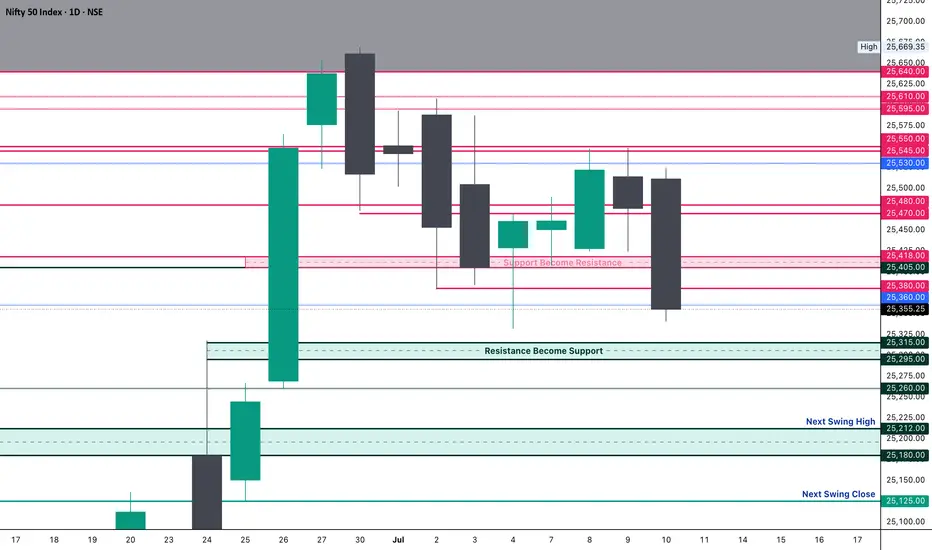
Nifty Analysis EOD – July 10, 2025 – Thursday🟢 Nifty Analysis EOD – July 10, 2025 – Thursday 🔴
"False Hopes, True Drop – Bears Tighten Their Grip"
Nifty opened with a mild 50-point gap-up, but within the very first minute, that optimism was crushed. It dropped nearly 100 points, breaching the previous day’s low, and entered the key support zone of 25405–25418, which held briefly for about half an hour.
But this wasn’t a day for bulls.
After a weak attempt to recover from the 25360 support (which held twice intraday), sellers regained momentum, dragged the index further down, and finally closed at the lowest point of the day – 25348.
🔸 Expiry volatility played its part — trapping option buyers and luring them into false reversals.
🔸 However, quick scalpers and intraday short-sellers likely capitalized well.
🔸 The structure was decisively bearish, with no meaningful intraday bounce.
Tomorrow becomes crucial.
Bulls have one last stronghold at the 25300 level.
Bears, already in charge, may extend the damage further if this breaks.
⚠️ Bias Levels:
🟢 Bullish above: 25420
🔴 Bearish below: 25290
⚪ Between = Neutral / Watch Mode
🕯 5 Min Time Frame Chart with Intraday Levels
🕯 Daily Time Frame Chart with Intraday Levels
🕯 Daily Candle Breakdown
Open: 25,511.65
High: 25,524.05
Low: 25,340.45
Close: 25,355.25
Change: −120.85 (−0.47%)
📊 Candle Structure Breakdown
Real Body: 156.40 points – large red candle
Upper Wick: 12.40 points – minimal bullish push
Lower Wick: 14.80 points – bears kept pressure till close
🔍 Interpretation
Bears took over early and never let go
The close at day low shows strong conviction from sellers
Lack of significant wicks → no real fight from bulls
🕯 Candle Type
Bearish Marubozu-style candle – clear sign of dominance by sellers, and potential for continuation if no quick reversal
📌 Key Insight
Market is in a critical zone — hovering above the edge of deeper correction
25300–25290 is the line in the sand
A breakdown below can target 25,200–25,250
Bulls can only regain momentum above 25,420
🛡 5 Min Intraday Chart
⚔️ Gladiator Strategy Update
ATR: 189.49
IB Range: 113.75 → Medium IB
Market Structure: 🟡 Balanced
Trades Triggered
10:52 AM – Short Trade → 🎯 Trail SL Hit (R:R 1:0.38)
📌 Support & Resistance Zones
Resistance Levels
25,380
25,405 ~ 25,418
25,470 ~ 25,480
25,530
25,545 ~ 25,550
Support Levels
25,315 ~ 25,295
25,260
25,212 ~ 25,180
25,125
💭 Final Thoughts
"Expiry days often blur the picture, but today’s price action was sharp. Unless bulls step up quickly, the breakdown may just be getting started."
✏️ Disclaimer
This is just my personal viewpoint. Always consult your financial advisor before taking any action.
Nifty Analysis EOD – June 20, 2025 – Friday🟢 Nifty Analysis EOD – June 20, 2025 – Friday 🔴
🚀 Bull Run Out of the Blue 🚀 – A Masterclass in Price Action
Nifty kicked off the session with a +56-point gap-up — surprising many, especially since Gift Nifty hinted flat to negative and yesterday’s close was weak. The real jolt came when, in the very first minute, price broke above the Previous Day High (PDH) and opened directly above the CPR zone — a rare occurrence when geopolitical tensions are peaking.
As I often say:
📌 “Market rarely follows the obvious. It thrives in the unexpected.”
Today was a textbook example of that.
Luckily, we were prepped. In yesterday’s note, I mentioned the bullish trigger above 24,862 — and right from the open, Nifty respected every level, offering "hope-on" and "hope-off" trades. What seemed like a 25K test turned into a blast to 25,136, with 100 points added in the last 30 minutes, leaving even seasoned traders awestruck.
The intraday close at 25,079.75 and the adjusted close at 25,112.40 — both above the 15th May closing levels — give a bullish vibe heading into the weekend. 🤞
💬 Personal Note:
Today was special — I sat with my elder daughter, helping her understand real-time market behavior. And what a day it was! From trend reversals, cup & handle, head & shoulders, wedges, shallow pullbacks, to aggressive one-way rallies — everything aligned perfectly to make this a live-action lesson in intraday trading.
🕯 5 Min Time Frame Chart with Levels
🕯 Daily Time Frame Chart
🕯 Daily Candle Breakdown
Open: 24,787.65
High: 25,136.20
Low: 24,783.65
Close: 25,112.40
Change: +319.15 (+1.29%)
📊 Candle Structure Breakdown
Real Body: 324.75 pts → ✅ Strong Green Candle
Upper Wick: 23.80 pts
Lower Wick: 4.00 pts
🔍 Interpretation
Opened flat and never looked back.
Minimal wicks = clear directional strength.
Buyers in full control from open to close.
🕯 Candle Type
📈 Bullish Marubozu-like — One of the strongest bullish signals. A powerful sign of trend continuation or breakout momentum.
📌 Key Insight
Today’s candle reinforces bullish strength.
Holding above 25,100 is key going forward.
A move above 25,136 could invite fresh upside targets — possibly 25,180+ and beyond.
🛡 5 Min Intraday Chart
⚔️ Gladiator Strategy Update
ATR: 251.32
IB Range: 116.6 → Medium IB
Market Structure: 📈 ImBalanced
Trades Triggered:
🔹 9:41 AM – Long Trade → Target Achieved (Trailing Exit, R:R 1:4.79)
🔹 12:18 PM – Short Contra Trade → Target Achieved (R:R 1:2)
🔹 1:07 PM – Long Trade → Target Achieved (Trailing Exit, R:R 1:2.62)
📌 Support & Resistance Zones
Resistance Levels
25,125 ~ 25,150
25,180 ~ 25,212
25,285
Support Levels
25,080 ~ 25,060
25,000 ~ 24,980
24,965
24,894 ~ 24,882
💭 Final Thoughts
The market surprised today — not just in movement but in clarity.The clean break, follow-through strength, and intraday structure hint at momentum continuation — but weekends can bring surprise news.
📌 Watch 25,100 as line in the sand on Monday.
🧠 “Markets are teachers. Today’s lesson? Expect the unexpected, but prepare like it’s already here.”
✏️ Disclaimer
This is just my personal viewpoint. Always consult your financial advisor before taking any action.

Nifty Analysis EOD – June 19, 2025 – Thursday🟢 Nifty Analysis EOD – June 19, 2025 – Thursday 🔴
📉 Bookish Spinning Top Doji – Another Day of Indecision on Expiry
Nifty opened with a mild +16-point gap-up and immediately dipped to test the Previous Day Low (PDL), marking the day low at 24,738.10. A quick reversal took the index 125 points higher, reaching a high of 24,863, only to settle back into theta-eating mode around VWAP.
Just as things looked ready to turn, a 13:50 breakout attempt fizzled as the price faced rejection above the CPR zone, leading to a final dip below the previous low, touching a new intraday low at 24,733.
Though the intraday close was at 24,744.70, the settlement close was 24,793.25 — a 47.65-point difference that’s not trivial, especially on expiry day.
The entire day remained a narrow-range, rollercoaster ride — clearly showing neither bulls nor bears could take charge. The total range was just 130 points, forming a textbook Spinning Top, which reflects market contraction.
📌 Now what?
Keep a close eye on the range:
🟢Bullish Breakout ➤ above 24,862 (CDH)
🔴Bearish Breakdown ➤ below 24,733 (CDL)
The squeeze is on. Expansion is near.
🕯 5 Min Time Frame Chart with Levels
🕯 Daily Time Frame Chart
🕯 Daily Candle Breakdown
Open: 24,803.25
High: 24,863.10
Low: 24,733.40
Close: 24,793.25
Change: −18.80 (−0.08%)
📊 Candle Structure Breakdown
Real Body: 10.00 pts → 🔻 Small Red Candle
Upper Wick: 59.85 pts
Lower Wick: 59.85 pts
🔍 Interpretation
Equal wicks show balanced buying and selling.
Small real body signals strong indecision.
Intraday volatility was neutral despite expiry impact.
🕯 Candle Type
⚖️ Perfect Spinning Top / Doji-like Candle – Indicates market contraction, waiting for directional resolution.
📌 Key Insight
The market continues its tight range-bound structure.
Any breakout beyond 24,865 or breakdown below 24,730 could trigger directional moves.
Till then: “Wait and watch mode.”
🛡 5 Min Intraday Chart
⚔️ Gladiator Strategy Update
ATR: 240.08
IB Range: 125.00 → Medium IB
Market Structure: ⚖️ Balanced
Trades:🚫 No Trade Triggered by System
📌 Support & Resistance Zones
Resistance Levels
24,894 ~ 24,882
24,972 ~ 25,000
25,060 ~ 25,080
25,102 ~ 25,125
Support Levels
24,825 ~ 24,847
24,725 ~ 24,735
24,660
24,590
💭 Final Thoughts
The market is compressing like a coiled spring.Spinning tops near resistance often signal upcoming volatility.Let the breakout come to you — don’t pre-empt, participate.
🧠 “When the market sleeps in narrow ranges, it dreams of big moves.”
✏️ Disclaimer
This is just my personal viewpoint. Always consult your financial advisor before taking any action.

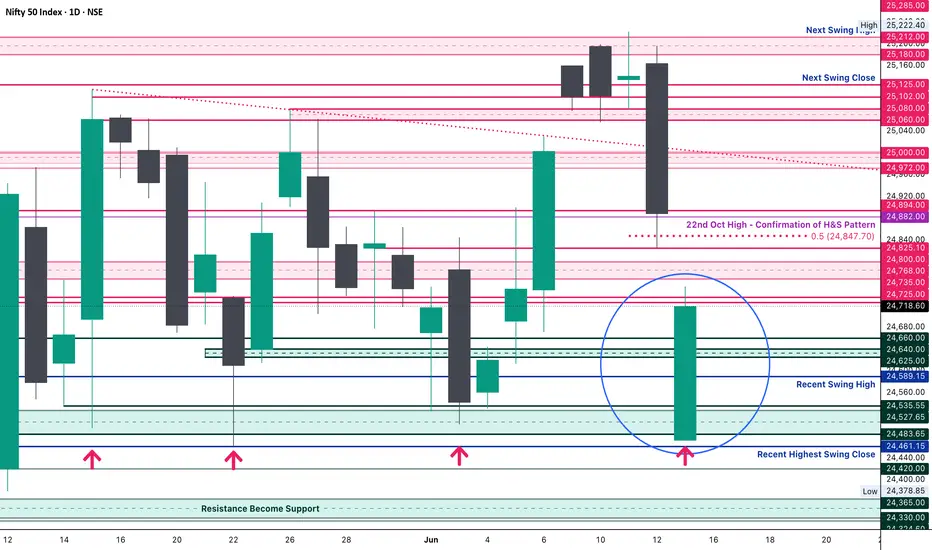
Nifty Analysis EOD – June 13, 2025 – Friday 🟢 Nifty Analysis EOD – June 13, 2025 – Friday 🔴
🕊️ Gap-Down on Geopolitical Tension – Buyers Step In at Crucial Support
Nifty opened with a massive gap-down of 415 points at 24,473 triggered by overnight geopolitical tensions — testing a crucial swing low from May 22. Interestingly, the market formed an OL (Open = Low) pattern and staged a powerful 281-point intraday recovery, closing near the day’s high at 24,718.60.
While the adjusted close still reflects a −0.68% drop, the price action was dominantly bullish. The strong bounce from the 24,460–24,520 demand zone — a region that had acted as a reversal zone multiple times earlier — reaffirms its significance.
🧭 If global cues stabilize or turn positive, this could pave the way for a bounce back toward 25,000. But if Friday’s low is breached, sentiment damage may deepen further. For now, intraday opportunities are preferable over positional plays, as uncertainty persists.
📝 A reminder from the May 22 note:
“Is the retracement run finished? Technically, YES. A bold call, but unless global headwinds reappear, today’s low must sustain.”
Nifty has once again honored this level — but the coming sessions will determine whether this bounce was genuine or temporary.
🛡 5 Min Chart with Levels
🕯 Daily Time Frame Chart
🕯 Daily Candle Breakdown
Open: 24,473.00
High: 24,754.35
Low: 24,473.00
Close: 24,718.60
Net Change: −169.60 (−0.68%)
📊 Candle Structure Breakdown
Real Body: 245.60 pts → 🟢 Strong Green Candle
Upper Wick: 35.75 pts
Lower Wick: None (OL Formation)
🔍 Interpretation
Despite the gap-down, bulls took control right from the open.
The absence of a lower wick signals firm intraday confidence.
Closing near the high reinforces the buying strength, even on a net down day.
🔦 Candle Type
💚 Bullish Marubozu–like (OL) Candle– Represents a strong intra-session reversal, where buyers dominated from the very first tick.
📌 Key Insight
Price respected the 24,460–24,520 zone, once again validating it as key support.
If the next session crosses and sustains above 24,750–24,770, a short-term reversal confirmation could follow.
However, a breakdown below 24,473 may renew bearish pressure.
🛡 5 Min Intraday Chart
⚔️ Gladiator Strategy Update
ATR: 269.05
IB Range: 145.05 → Medium IB
Market Structure: Balanced
Trades:✅ 10:20 AM – Long Triggered → Target Achieved, Trailing SL Hit (RR: 1:1.7)
📌 Support & Resistance Zones
Resistance Levels
24,725 ~ 24,735
24,825 ~ 24,847 (Fibonacci 0.5 retracement level)
24,882 ~ 24,894
24,972 ~ 25,000
25,060 ~ 25,080
Support Levels
24,660
24,640 ~ 24,625
24,420
24,365 ~ 24,330
24,245 ~ 24,220
💭 Final Thoughts
Friday’s session was a battle between fear and resilience — and bulls showed up just in time. The key test ahead: can the index reclaim 25K or will the bounce fade away?
🧠 “Great rebounds are born from great fear — but follow-through is what separates noise from reversal.”
✏️ Disclaimer
This is just my personal viewpoint. Always consult your financial advisor before taking any action.
Nifty Wkly Outlook: Market Volatility, Supprt Lvls & Possible
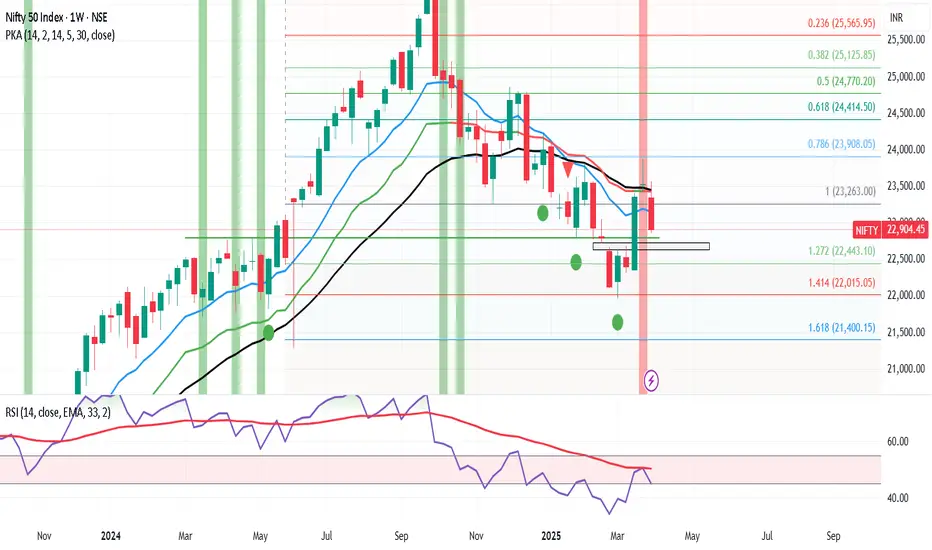
Nifty ended the week at 22,904, marking a significant decline of 600 points from the previous week’s close. The index reached a high of 23,565 and a low of 22,857. As anticipated, the dragonfly doji formation from last week, coupled with concerns over Trump’s new tariff measures taking effect from April 2nd, contributed to global market jitters. These factors spooked investors and led to heightened volatility across the board.
My initial forecast for Nifty's trading range this week was 24,000-23,000, but the lower end of that range was breached by 150 points, indicating increased downside pressure. Looking ahead, there is potential for Nifty to find support around the 22,600/22,400 zone, where it may consolidate and form a base to attempt a rebound towards the 24,000 level. However, if the index were to break below the critical support level of 21,964 (which, frankly, seems unlikely), a deeper correction towards 19,700 could unfold. * That said, I believe most of the negative news has already been priced in, and we could see a market recovery within the next 10-15days, depending on how the bulls respond to this pullback .*
In the global markets, the S&P 500 has closed below its 100-week exponential moving average (WEMA) at 5,074, and if it falls below this week’s low of 5,069, we could see a further slide towards 4,750/4,800, representing a 6% drop from current levels. Should Nifty also correct by 6% from its current position, this aligns with a potential support zone around 21,900/22,000, making it an interesting technical level to watch.
It will be crucial to monitor if the wounded bulls can stage a comeback or if the market will continue its downward trajectory. Stay tuned!
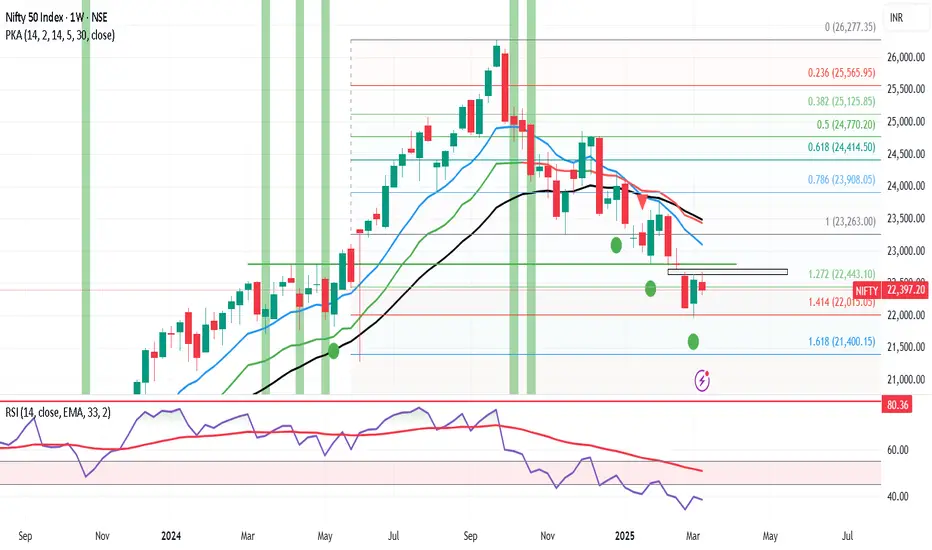
Nifty Faces Range-Bound Phase,brace for volatility till Mid ApriNifty ended the week at 22,397, marking a decline of about 150 points from the previous week's close. The index reached a high of 22,676 and a low of 22,314, trading in a narrow range of just 360 points. This suggests that next week, Nifty could experience a wider range, with potential moves between 22,850 and 21,950 .
Despite the weakness seen on both the monthly and weekly charts, Nifty remains range-bound as long as the critical support level of 21,950 holds. However, with the end of March approaching, many investors will likely start booking losses to offset any gains they’ve made this year. This could trigger another round of selling pressure in the market. As a result, we may not see a meaningful recovery until mid-April, meaning we could face one more month of market volatility and pessimism.
It's crucial to keep cash ready to invest in fundamentally strong stocks during this period of market uncertainty. On the global front, the S&P 500 closed the week at 5,521, slipping below its 50-week exponential moving average (50WEMA). It seems likely that the index will test the 100-week exponential moving average (100WEMA) at around 5,240–5,250, which is about 4% below its current level. If this happens, we could see additional pressure across global markets, including India.
In summary, brace yourself for another month of market negativity before any potential relief arrives. Stay cautious and focus on high-quality stocks for the long term.
#Nifty50 Outlook for upcoming week 30-3rd Jan 2025The Nifty roared this week, gaining a solid 226 points, closing at a strong 23813! It reached a peak of 23938 before dipping to 23647. As predicted, the Nifty stayed within the 24100-23000 range, forming an interesting inside candle pattern. Excitingly, a bullish "W" pattern has emerged on the weekly chart!
If the Nifty can hold above the crucial 23900 level next week, we could see it trading between 24300 and 23400 . However, while a bounce is expected, the bearish Monthly chart might tempt big players to unload their positions. Stay alert!
Across the pond, the S&P500 took a 2.5% hit, closing at 5970 after reaching a high of 6049. The 5870-5850 support zone is critical. A breach could trigger a faster selloff, potentially testing the 5637/5551 support levels. For an upward move, the S&P500 needs to conquer 6050, paving the way for resistance levels at 6094/6142/6225.
Bottom line: Use any bounce next week as an opportunity to lock in profits. Stay informed and trade wisely!"
Wishing everyone a very happy & prosperous New Year.

#nifty50 analysis for upcoming week 23-27th Sept 2024The #Nifty50 soared to a new all-time weekly high of 25,791, gaining a remarkable 430 points from the previous week's close. It reached a peak of 25,849 and a low of 25,285. As predicted, the Nifty has been trading within the 25,810-24,750 range. For the upcoming week, I anticipate a trading range of 26,400-25,200 . A breach of these levels could ignite significant market volatility.
As highlighted last week, the strong Fibonacci level of 25,810 is crucial. If the Nifty closes above this level next week, be prepared for a potential rally towards the next magical level of 26,990 or 27,000. Although reaching these levels may take some time, it's essential to be positioned for such a move.
Meanwhile, the S&P 500 finally broke through the strong resistance of 5,637, thanks to the Federal Reserve's rate cut. If it can maintain above this week's high of 5,733, we could see further gains towards resistance levels of 5,800, 6,000, or even 6,140. Since the S&P 500 has surpassed a significant Fibonacci level, it's poised to potentially reach another strong Fibonacci level of 6,959, which is 20% higher than current levels. Such a move would likely propel the Nifty towards 27,000.
A breakdown below this week's low of 5,604 would indicate a failed breakout and could lead to a test of support levels at 5,445 or 5,432. Exciting times are ahead!"
