#nifty50 analysis for upcoming week 12-16th Aug 2024The Nifty index concluded the week at 24,367, shedding 350 points from the previous close. The index touched a high of 24,419 and a low of 23,893. A global market downturn, ignited by the unwinding of yen-funded positions, sent shockwaves through financial markets worldwide.
Looking ahead, the Nifty is projected to oscillate between 25,150-23,800. A breach below the crucial 23,800 support could trigger a deeper correction towards 23,500. On the upside, 24,700 is a key resistance level to watch, representing a potential gap fill. Short-term chart patterns hint at a bullish reversal, supported by the positive outlook on weekly and monthly timeframes. Also remember next week is truncated due to 15th Aug holiday so it will be a 4 day week for Indian markets.
The S&P 500 found support near the DEMA 200. To sustain its upward momentum, the index must hold above 5,400, opening the door to potential targets at 5,433, 5,500, and 5,566. Conversely, a dip below 5,233 could reignite the downtrend, with support levels at 5,180, 5,088 (DEMA 200), and 5,016 exerting downward pressure on global markets.
Prepare for continued market volatility.
Nifty50levels

NiftyNifty Daily Chart today candle is Positive but nifty50 some share's will be go negative.. This POST is for aware to anyone for your Stock's... Something will go negative it's my view 🙇♀️🙇♀️
NIFTY 50 Analysis For Feb 22nd!Hello Traders,
Here is a Brief Overview About The Analysis of NIFTY 50 For Feb 22nd,
There Are Total of 3 Support Zones Which You Need To Look For And Same 2 Resistance Zones And To Be Mentioned One Grey Area And We Have 5 Imbalance Zones!
The Horizontal Lines From Volume To Volume And OI To OI Indicates The Market Range in Between For That Particular Day!
The Blue And Red Arrow Path Showing The Direction of The NIFTY 50 For That Day.
Note : Those Levels Are For That Particular Day Only.
Please Note That The Only Purpose of The Information On This Page is Purely Educational.
We Are Not Registered with SEBI; Therefore, Before Making Any Financial Decisions OR Investing, Please Consult with A SEBI-Qualified Financial Advisor. We Don't Have Any Responsibility For Your Profits OR Losses.
I Would Welcome Your Participation And Support in the Form of Likes, Comments, And Follow us to Offer Some Encouragement.
Thank You.

#Nifty50 trading levels for may 2nd#Nifty50 trading levels for may 2nd. Develop your intraday trading skills with these levels.

#nifty50 Friday trading setup #Nifty50 Friday trading setup. Trade only after the 15 minute candle closes the levels shown. Bearish below 17800 – Bullish above 18000

NIFTY 50 - Trend Lines (8th Dec Exp)NIFTY 50
- If Candle Breaks & sustains Green line (above / Below) then the target is next green line
- If Candle Breaks & sustains Blue line (above / Below) then the target is next Blue line
Market Range
High Range: 18780 - 18920
Mid Range: 18640 - 18780
Low Range: 18500 - 18640
caution:
cannot guarantee the accuracy of the data & it's presentation
stock market investments are risky by nature so we are not responsible for
your losses or profits, and your returns will depend on
your own personal trading methods only.

NIFTY - ALERT ! IMPORTANT LEVELS TO WATCHNIFTY BUY ABOVE 14042 TGT 14071 / 14101/14131
NIFTY SELL BELOW 13983 TGT 13953/ 13924/13894
Disclaimer : Trade at your own Risk
#nifty50levels #nifty50priceaction #nifty50trend #nifty50analysisi #nifty50price_targets #nifty50tradingplans #nifty50

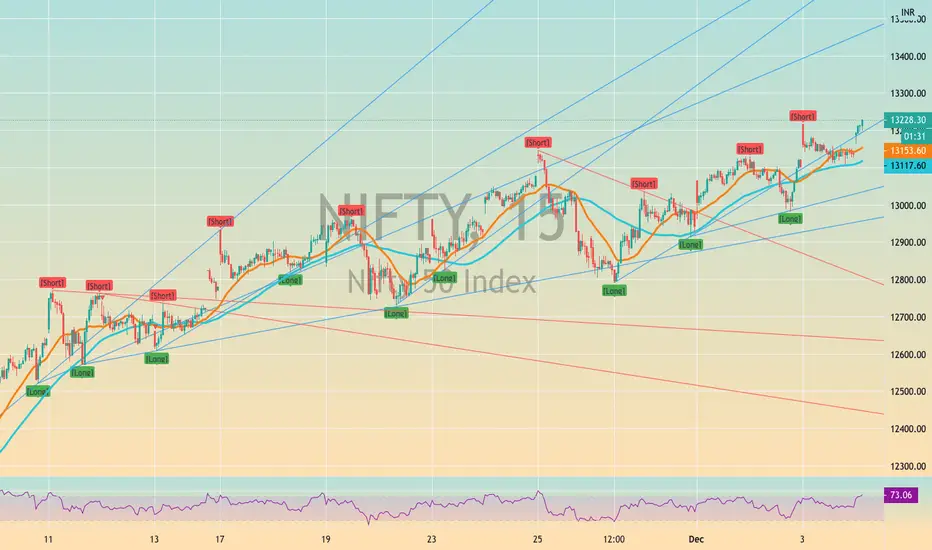
#NIFTY eyeing 13450-13500#NIFTY eyeing 13400-13500, we can see it next week.
Pick some 13400 calls for next week @ 38