Fibonacci Supports and Resistances Medium to Long term Outlook.Here we have tried to show you Fibonacci supports and resistances for Nifty on Monthly chart with Medium to Long term outlook. Fibonacci retracement suggests the nearby major resistances at 25233.
Crossing this zone and closing above this zone is imperative for proper bull market to return. In such a scenario the next resistances will be at 26277 (Previous All Time high). Closing above 26277 will open the door for the targets of 27K+. The Golden ratio of Fibonacci suggest the cap near 29540 within next 13 to 21 months. Supports for Nifty remain at 24443, 23903, 23375.
Below 23375 Bear market can return and can drag Nifty towards unlikely levels of 22737 or 21743. (This looks unlikely as of now but you can never say never looking at the Tariff wars and not so conducive Geo-Political situation of the subcontinent, Russia-Ukraine, Israel and other factors.)
So one eye of investors should be on macro factors also while looking at rosy micro factors related to Indian markets. While we look forward to making new highs in the next 1 or 2 years. Never forget Stop losses / Trailing stop Losses are best friends of investors. Stop losses protect your capital and trailing stop losses protect your profits.
Disclaimer: The above information is provided for educational purpose, analysis and paper trading only. Please don't treat this as a buy or sell recommendation for the stock or index. The Techno-Funda analysis is based on data that is more than 3 months old. Supports and Resistances are determined by historic past peaks and Valley in the chart. Many other indicators and patterns like EMA, RSI, MACD, Volumes, Fibonacci, parallel channel etc. use historic data which is 3 months or older cyclical points. There is no guarantee they will work in future as markets are highly volatile and swings in prices are also due to macro and micro factors based on actions taken by the company as well as region and global events. Equity investment is subject to risks. I or my clients or family members might have positions in the stocks that we mention in our educational posts. We will not be responsible for any Profit or loss that may occur due to any financial decision taken based on any data provided in this message. Do consult your investment advisor before taking any financial decisions. Stop losses should be an important part of any investment in equity.
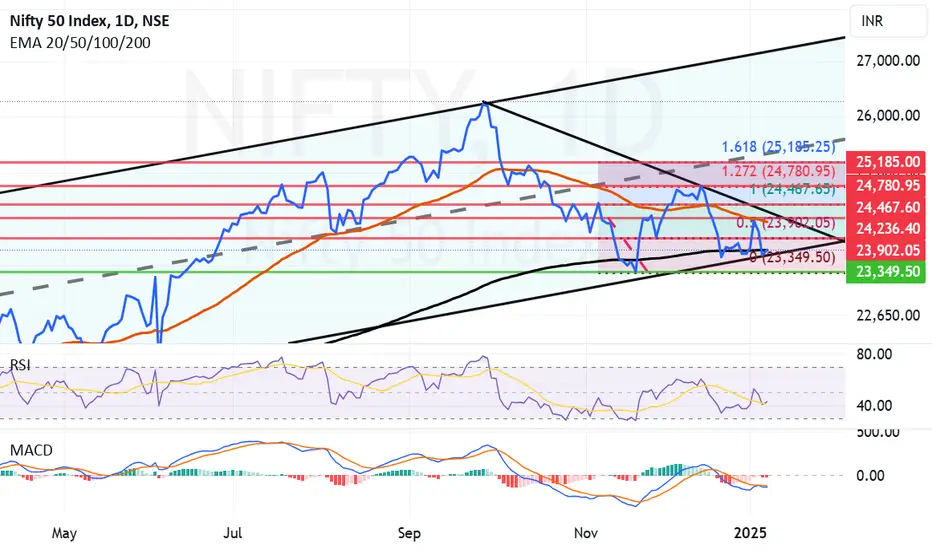
Niftyfibonacciretracement

Fibonacci Support & Resistances for Nifty (Medium term outlook).Important Fibonacci support for Nifty drawn on daily line chart of Nifty is at 23349. Below 23349 closing bears can have a field day and can create havoc but that looks less likely as of now. The closing today is 23207 which is just above 200 days EMA or the father line which is a good sign. Father line was at 23700. On the upside the Fibonacci resistance for Nifty seem to be at 23902, 24170 (Important Mother line Resistance) 24236, 24467, 24780 and finally Fibonacci Golden ratio from the current levels is at 25185. It will take some doing from the Bulls to close above this level. This presents the medium time frame outlook for the Nifty.
RSI indicator also seems to have taken an upward swing but mid level is yet to be crossed for that indicator.
MACD indicator suggests that Moving averages are fighting hard to converge and bring back some bullish momentum into the market to infuse some life into the Bull who are trying to come out of comma.
Disclaimer: The above information is provided for educational purpose, analysis and paper trading only. Please don't treat this as a buy or sell recommendation for the stock. We do not guarantee any success in highly volatile market or otherwise. Stock market investment is subject to market risks which include global and regional risks. We will not be responsible for any Profit or loss that may occur due to any financial decision taken based on any data provided in this message.