Market Still Searching for Bottom. Nifty is still searching for a firm bottom from where it can form a base and launch a comeback. RSI of Nifty on Weekly chart is at 34.15. The weekly RSI was this low only during COVID fall when market RSI had gone below the level of 20. Most of the levels are being broken down week after week and day after day.
Now Nifty supports are at 22054 and 21813. 21813 seems to be a very strong support if this support is broken we have only 21281 support which was the Election day low where there was a fear of regime change. If 21281 is broken then 20507 and 19706 Father line of weekly Chart.
Daily RSI is at 22.4 which indicates Nifty might be near the oversold zone. Upside resistances for Nifty are at 22588, 22743. Crossing these 2 hurdles will bring in a formidable Fibonacci resistance of 23214 and 23334 (Mother line of Weekly chart) into picture. Bulls can make a come back only after we get a closing above 23334.
Amongst all these negative indications Nifty 50 PE valuations are at 19.7. The 10 year Average PE of Nifty 50 is at 23.5. Which means lot of stocks are trading below their 10 year Price to Earning average and value buyers can see an opportunity here for long term investment and they can start collecting fallen stars.
Daily Disclaimer: The above information is provided for educational purpose, analysis and paper trading only. Please don't treat this as a buy or sell recommendation for the stock or index. The Techno-Funda analysis is based on data that is more than 3 months old. Supports and Resistances are determined by historic past peaks and Valley in the chart. Many other indicators and patterns like EMA, RSI, MACD, Volumes, Fibonacci, parallel channel etc. use historic data which is 3 months or older cyclical points. There is no guarantee they will work in future as markets are highly volatile and swings in prices are also due to macro and micro factors based on actions taken by the company as well as region and global events. Equity investment is subject to risks. I or my clients or family members might have positions in the stocks that we mention in our educational posts. We will not be responsible for any Profit or loss that may occur due to any financial decision taken based on any data provided in this message. Do consult your investment advisor before taking any financial decisions. Stop losses should be an important part of any investment in equity.
Niftylevels
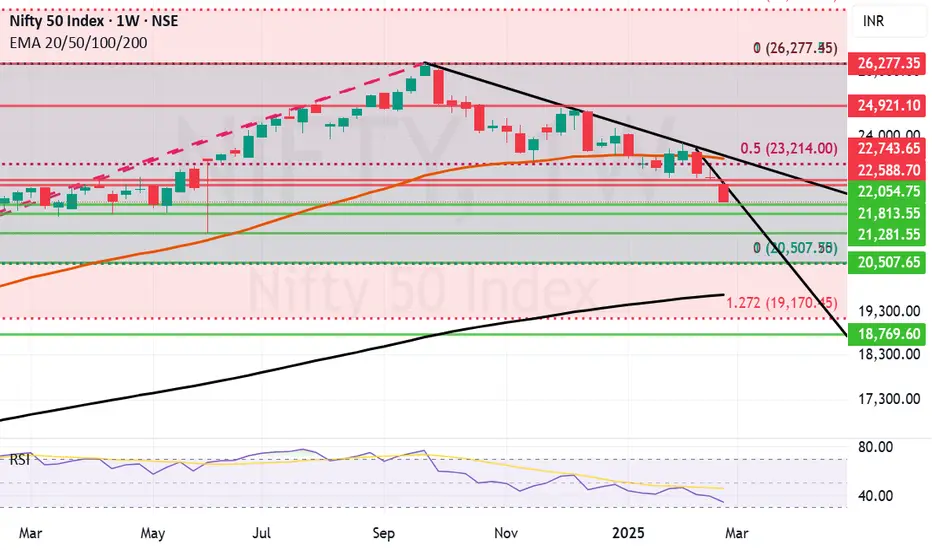
Nifty 50 long term trend analysis, major support and resistance Nifty 50 Index (NSEI: NIFTY) was in a trend for 12 years from June 2008 to Dec 2020. In December 2020 it broke out of this range at ~13357 and almost doubled in just shy of 4 years (September 2024) peaking at ~26277.
Support 1 : 21870 (Fib 23.6%)
Support 2 : 19114 (Fib 38.2%)
Support 3 : 16909 (Fib 50%)
Note: Not an investment / trade recommendation. Just for educational purposes only.

#NIFTY Intraday Support and Resistance Levels - 28/02/2025Flat opening expected in nifty. It is consolidating in between the range of 22500-22550 level. Major directional rally only expected if nifty give break and sustain this range breakout. Strong downside movement expected below 22500 level. For bearish rally 22300 will be next support level. For bullish rally upside 22750 will act as a major resistance in today's session.

NIFTY Intraday Trading levels and Plan – 28-Feb-2025
This analysis provides a comprehensive trading plan for the NIFTY 50 index on February 28, 2025, covering all possible opening scenarios. We will evaluate Gap-Up, Flat, and Gap-Down openings (with gaps of 100+ points) and outline clear action points, key levels, and risk management strategies. This plan is designed to help traders navigate the market with precision and discipline. 📈🔍
🔹 Scenario 1: Gap-Up Opening (100+ points)
If NIFTY 50 opens above 22,763 (a gap of 100+ points from the previous close of 22,663), it signals strong bullish momentum. This opening suggests aggressive buying interest, potentially driving prices higher.
If the price sustains above 22,763, it could target the resistance zone of 22,884–22,900. This zone is a profit-booking area where selling pressure may intensify due to historical resistance and recent highs.
If the price faces rejection at 22,884–22,900, a reversal trade could be considered, targeting a pullback to 22,700–22,663 (opening resistance and previous close).
Should the price break above 22,900 with strong momentum (e.g., high volume and bullish candlestick patterns), we might see a rally toward 23,000 or higher.
✅ Trade Plan:
✔️ Buy on a breakout and retest of 22,763 , targeting 22,884–22,900. Use a stop-loss below 22,663 to manage risk.
✔️ Short if the price rejects 22,884–22,900, aiming for 22,700–22,663. Place a stop-loss above 22,900 to limit potential losses.
Explanation: A Gap-Up opening of 100+ points reflects bullish sentiment, but chasing the gap immediately can be risky due to volatility. Waiting for a retest of 22,763 confirms bullish intent, while the resistance at 22,884–22,900 acts as a natural profit-taking zone. A rejection at this level could signal a shorting opportunity if bearish momentum builds.
🔹 Scenario 2: Flat Opening (Near 22,663–22,700)
If NIFTY 50 opens within the range of 22,663–22,700, it suggests a balanced market with no clear directional bias. This zone acts as a critical opening support/resistance area where price action could consolidate or break out.
A breakout above 22,700 could drive prices toward 22,884–22,900, signaling bullish momentum.
A breakdown below 22,663 might lead to selling pressure, targeting 22,510–22,356 (opening support and last intraday support) or even 22,268–22,070 (buyer’s support levels).
✅ Trade Plan:
✔️ Buy above 22,700 , targeting 22,884–22,900. Use a stop-loss below 22,663 to protect against a false breakout.
✔️ Sell below 22,663 , targeting 22,510–22,356 or 22,268–22,070. Set a stop-loss above 22,700 to manage downside risk.
Explanation: A Flat opening often results in consolidation, making it challenging to trade without confirmation. The 22,663–22,700 range is a no-trade zone unless a decisive breakout occurs. Traders should wait for clear price action (e.g., strong candlestick patterns or increased volume) to avoid fake moves and ensure higher probability trades.
🔹 Scenario 3: Gap-Down Opening (100+ points)
If NIFTY 50 opens below 22,563 (a gap of 100+ points from the previous close of 22,663), it signals bearish sentiment and potential weakness in the market.
Immediate support lies at 22,510–22,356 (opening support and last intraday support). If this holds, a pullback toward 22,663–22,700 could occur.
If 22,356 breaks with strong selling pressure, expect further downside toward 22,268–22,070 (buyer’s support for a possible reversal).
✅ Trade Plan:
✔️ Buy near 22,356 , targeting a pullback to 22,663–22,700. Use a stop-loss below 22,268 to limit risk.
✔️ Short below 22,356 , targeting 22,268–22,070. Place a stop-loss above 22,356 to protect against a quick recovery.
Explanation: A Gap-Down opening of 100+ points indicates panic or profit-taking, but prices can rebound if support levels hold. Waiting for confirmation near 22,356 ensures the price isn’t just oversold, while a break below this level confirms bearish momentum for shorting opportunities. The 22,268–22,070 zone offers a potential reversal point if buying interest emerges.
📌 Risk Management Tips for Options Trading 💡
🛑 Always Use a Strict Stop-Loss: Protect your capital by setting stop-loss orders at key support/resistance levels to limit potential losses.
🎯 Take Partial Profits: Lock in gains at intermediate targets (e.g., 22,884 or 22,356) to secure profits while allowing room for further moves.
🕰️ Avoid Overtrading: Stick to the plan and wait for clear price action confirmation—don’t force trades in uncertain conditions.
💰 Use Proper Position Sizing: Risk only a small percentage of your capital (e.g., 1–2%) per trade to ensure longevity in the market.
📌 Summary & Conclusion 🎯
✔️ Bullish Above: 22,700 → Target: 22,884–22,900.
✔️ Bearish Below: 22,663 → Target: 22,510–22,356 or 22,268–22,070.
✔️ No Trade Zone: 22,663–22,700 (Wait for a breakout).
Trade with discipline, follow your plan, and prioritize risk management to navigate the NIFTY 50 market effectively on February 28, 2025. 🚀
⚠️ Disclaimer
I am not a SEBI-registered analyst. This analysis is for educational purposes only. Please consult your financial advisor before making any trading decisions. 📉📈

#NIFTY Intraday Support and Resistance Levels - 27/02/2025Flat opening expected in nifty. After opening important level to watch is 22500. If nifty starts trading below this level then sharp downside rally expected upto 22300 in opening session. Any upside move only expected if it's sustain above 22550 level. Upside 22750 level will act as a resistance for today's session.

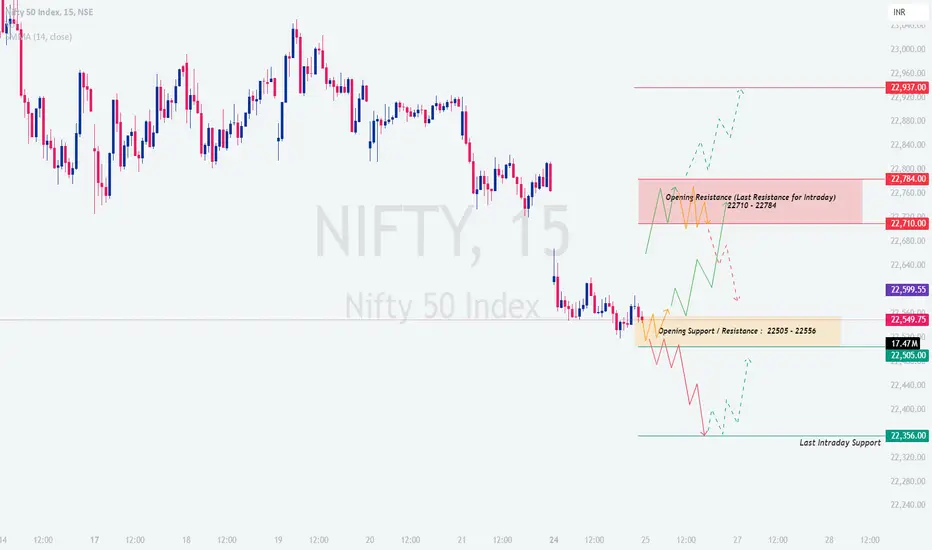
NIFTY : Intraday Trading Levels and Plan – 27-Feb-2025📌
This analysis provides a comprehensive trading plan for the NIFTY index on February 27, 2025, covering all possible opening scenarios. We will evaluate Gap-Up, Flat, and Gap-Down openings (with gaps of 100+ points) and outline clear action points, key levels, and risk management strategies. This plan is designed to help traders navigate the market with precision and discipline. 📈🔍
🔹 Scenario 1: Gap-Up Opening (100+ points)
If NIFTY opens above 22,784 (a gap of 100+ points from the previous close of 22,684), it signals strong bullish momentum. This opening suggests aggressive buying interest, potentially driving prices higher.
If the price sustains above 22,784, it could target the resistance zone of 22,871–22,987. This zone is a profit-booking area where selling pressure may intensify due to historical resistance and recent highs.
If the price faces rejection at 22,871–22,987, a reversal trade could be considered, targeting a pullback to 22,710–22,684 (opening resistance and previous close).
Should the price break above 22,987 with strong momentum (e.g., high volume and bullish candlestick patterns), we might see a rally toward 23,000 or higher.
✅ Trade Plan:
✔️ Buy on a breakout and retest of 22,784 , targeting 22,871–22,987. Use a stop-loss below 22,684 to manage risk.
✔️ Short if the price rejects 22,871–22,987, aiming for 22,710–22,684. Place a stop-loss above 22,987 to limit potential losses.
Explanation: A Gap-Up opening of 100+ points reflects bullish sentiment, but chasing the gap immediately can be risky due to volatility. Waiting for a retest of 22,784 confirms bullish intent, while the resistance at 22,871–22,987 acts as a natural profit-taking zone. A rejection at this level could signal a shorting opportunity if bearish momentum builds.
🔹 Scenario 2: Flat Opening (Near 22,684–22,710)
If NIFTY opens within the range of 22,684–22,710, it suggests a balanced market with no clear directional bias. This zone acts as a critical opening support/resistance area where price action could consolidate or break out.
A breakout above 22,710 could drive prices toward 22,871–22,987, signaling bullish momentum.
A breakdown below 22,684 might lead to selling pressure, targeting 22,505–22,356 (opening support and last intraday support) or even 22,400 (key support level).
✅ Trade Plan:
✔️ Buy above 22,710 , targeting 22,871–22,987. Use a stop-loss below 22,684 to protect against a false breakout.
✔️ Sell below 22,684 , targeting 22,505–22,356 or 22,400. Set a stop-loss above 22,710 to manage downside risk.
Explanation: A Flat opening often results in consolidation, making it challenging to trade without confirmation. The 22,684–22,710 range is a no-trade zone unless a decisive breakout occurs. Traders should wait for clear price action (e.g., strong candlestick patterns or increased volume) to avoid fake moves and ensure higher probability trades.
🔹 Scenario 3: Gap-Down Opening (100+ points)
If NIFTY opens below 22,584 (a gap of 100+ points from the previous close of 22,684), it signals bearish sentiment and potential weakness in the market.
Immediate support lies at 22,505–22,356 (opening support and last intraday support). If this holds, a pullback toward 22,684–22,710 could occur.
If 22,505 breaks with strong selling pressure, expect further downside toward 22,070 (buyer’s support for a possible reversal).
✅ Trade Plan:
✔️ Buy near 22,505 , targeting a pullback to 22,684–22,710. Use a stop-loss below 22,356 to limit risk.
✔️ Short below 22,505 , targeting 22,070. Place a stop-loss above 22,505 to protect against a quick recovery.
Explanation: A Gap-Down opening of 100+ points indicates panic or profit-taking, but prices can rebound if support levels hold. Waiting for confirmation near 22,505 ensures the price isn’t just oversold, while a break below this level confirms bearish momentum for shorting opportunities. The 22,070 zone offers a potential reversal point if buying interest emerges.
📌 Risk Management Tips for Options Trading 💡
🛑 Always Use a Strict Stop-Loss: Protect your capital by setting stop-loss orders at key support/resistance levels to limit potential losses.
🎯 Take Partial Profits: Lock in gains at intermediate targets (e.g., 22,871 or 22,505) to secure profits while allowing room for further moves.
🕰️ Avoid Overtrading: Stick to the plan and wait for clear price action confirmation—don’t force trades in uncertain conditions.
💰 Use Proper Position Sizing: Risk only a small percentage of your capital (e.g., 1–2%) per trade to ensure longevity in the market.
📌 Summary & Conclusion 🎯
✔️ Bullish Above: 22,710 → Target: 22,871–22,987.
✔️ Bearish Below: 22,684 → Target: 22,505–22,356 or 22,070.
✔️ No Trade Zone: 22,684–22,710 (Wait for a breakout).
Trade with discipline, follow your plan, and prioritize risk management to navigate the NIFTY market effectively on February 27, 2025. 🚀
⚠️ Disclaimer
I am not a SEBI-registered analyst. This analysis is for educational purposes only. Please consult your financial advisor before making any trading decisions. 📉📈

#NIFTY Intraday Support and Resistance Levels - 25/02/2025Slightly gap down opening expected in nifty. After opening if nifty starts trading below 22500 level then possible sharp downside of 150-200 points occurs in nifty. This downside rally can goes upto the 22300 level. Upside 22750 will act as a major resistance for today's session. Any upside rally can be reversal from this level.

NIFTY : Trading levels and Plan for 25-Feb-2025This analysis provides a comprehensive trading plan for the NIFTY 50 index on February 25, 2025, covering all possible opening scenarios. We will evaluate Gap-Up, Flat, and Gap-Down openings (with gaps of 100+ points) and outline clear action points, key levels, and risk management strategies. This plan is designed to help traders navigate the market with precision and discipline. 📈🔍
🔹 Scenario 1: Gap-Up Opening (100+ points)
If NIFTY 50 opens above 22,784 (a gap of 100+ points from the previous close of 22,684), it signals strong bullish momentum. This opening suggests aggressive buying interest, potentially driving prices higher.
If the price sustains above 22,784, it could target the resistance zone of 22,871–22,987. This zone is a profit-booking area where selling pressure may intensify due to historical resistance and recent highs.
If the price faces rejection at 22,871–22,987, a reversal trade could be considered, targeting a pullback to 22,710–22,684 (opening resistance and previous close).
Should the price break above 22,987 with strong momentum (e.g., high volume and bullish candlestick patterns), we might see a rally toward 23,000 or higher.
✅ Trade Plan:
✔️ Buy on a breakout and retest of 22,784 , targeting 22,871–22,987. Use a stop-loss below 22,684 to manage risk.
✔️ Short if the price rejects 22,871–22,987, aiming for 22,710–22,684. Place a stop-loss above 22,987 to limit potential losses.
Explanation: A Gap-Up opening of 100+ points reflects bullish sentiment, but chasing the gap immediately can be risky due to volatility. Waiting for a retest of 22,784 confirms bullish intent, while the resistance at 22,871–22,987 acts as a natural profit-taking zone. A rejection at this level could signal a shorting opportunity if bearish momentum builds.
🔹 Scenario 2: Flat Opening (Near 22,684–22,710)
If NIFTY 50 opens within the range of 22,684–22,710, it suggests a balanced market with no clear directional bias. This zone acts as a critical opening support/resistance area where price action could consolidate or break out.
A breakout above 22,710 could drive prices toward 22,871–22,987, signaling bullish momentum.
A breakdown below 22,684 might lead to selling pressure, targeting 22,505–22,356 (opening support and last intraday support) or even 22,400 (key support level).
✅ Trade Plan:
✔️ Buy above 22,710 , targeting 22,871–22,987. Use a stop-loss below 22,684 to protect against a false breakout.
✔️ Sell below 22,684 , targeting 22,505–22,356 or 22,400. Set a stop-loss above 22,710 to manage downside risk.
Explanation: A Flat opening often results in consolidation, making it challenging to trade without confirmation. The 22,684–22,710 range is a no-trade zone unless a decisive breakout occurs. Traders should wait for clear price action (e.g., strong candlestick patterns or increased volume) to avoid fake moves and ensure higher probability trades.
🔹 Scenario 3: Gap-Down Opening (100+ points)
If NIFTY 50 opens below 22,584 (a gap of 100+ points from the previous close of 22,684), it signals bearish sentiment and potential weakness in the market.
Immediate support lies at 22,505–22,356 (opening support and last intraday support). If this holds, a pullback toward 22,684–22,710 could occur.
If 22,505 breaks with strong selling pressure, expect further downside toward 22,240 (buyer’s support for a possible reversal).
✅ Trade Plan:
✔️ Buy near 22,505 , targeting a pullback to 22,684–22,710. Use a stop-loss below 22,356 to limit risk.
✔️ Short below 22,505 , targeting 22,240. Place a stop-loss above 22,505 to protect against a quick recovery.
Explanation: A Gap-Down opening of 100+ points indicates panic or profit-taking, but prices can rebound if support levels hold. Waiting for confirmation near 22,505 ensures the price isn’t just oversold, while a break below this level confirms bearish momentum for shorting opportunities. The 22,240 zone offers a potential reversal point if buying interest emerges.
📌 Risk Management Tips for Options Trading 💡
🛑 Always Use a Strict Stop-Loss: Protect your capital by setting stop-loss orders at key support/resistance levels to limit potential losses.
🎯 Take Partial Profits: Lock in gains at intermediate targets (e.g., 22,871 or 22,505) to secure profits while allowing room for further moves.
🕰️ Avoid Overtrading: Stick to the plan and wait for clear price action confirmation—don’t force trades in uncertain conditions.
💰 Use Proper Position Sizing: Risk only a small percentage of your capital (e.g., 1–2%) per trade to ensure longevity in the market.
📌 Summary & Conclusion 🎯
✔️ Bullish Above: 22,710 → Target: 22,871–22,987.
✔️ Bearish Below: 22,684 → Target: 22,505–22,356 or 22,240.
✔️ No Trade Zone: 22,684–22,710 (Wait for a breakout).
Trade with discipline, follow your plan, and prioritize risk management to navigate the NIFTY 50 market effectively on February 25, 2025. 🚀
⚠️ Disclaimer
I am not a SEBI-registered analyst. This analysis is for educational purposes only. Please consult your financial advisor before making any trading decisions. 📉📈
Nifty Review & Analysis - DailyPrice Action :
Nifty made another new low for the year down -1%
Technicals:
Nifty opened gap down and continued weakness below 22700 to close at 22550 forming a bearish candle below 5,10,20,50,100 & 200 DEMA
The momentum indicator, RSI - Relative Strength Index closed below 30 showing weakness
Support/Resistance
Major Support 22300
Immediate Support 22500
Immediate Resistance 22650
Major Resistance 22700, 22800, 23000
Trend:
Overall Trend is Bearish sideays
Options Data:
Highest CE OI was at 23000 with highest addition at 22600, 22700 & 22800 - Resistance
Highest PE OI was at 22500, highest Put writing seen at 22500, 22300 - No major support
PCR is 0.6 which indicates Bearishness
Futures Data:
FII Long/Short ratio at 15.5%/84.5%
FII Future positions saw little addition in longs and exiting shorts
Nifty Futures price was down by -1% with huge increase in Open Interest (OI) which typically indicates Bearishness
Outlook for Next Session:
Nifty is weak Sell on every rise
Approch:
Short at higher levels for target 22400-22300
Wait for today’s High or Low to break and sustaines for further direction
My Trades & Positions:
Holding Shorts in March monthly contract from 22850 levels

NIFTY : Trading levels and Plan for 24-Feb-2025NIFTY 50 Intraday Trading Plan – 24-Feb-2025
This analysis provides a comprehensive trading plan for the NIFTY 50 index on February 24, 2025, covering all possible opening scenarios. We will evaluate Gap-Up, Flat, and Gap-Down openings (with gaps of 100+ points) and outline structured action points, key levels, and risk management strategies. This plan is designed to help traders navigate the market with clarity and discipline. 📈🔍
🔹 Scenario 1: Gap-Up Opening (100+ points)
If NIFTY 50 opens above 22,987 (a gap of 100+ points from the previous close of 22,887), it indicates strong bullish momentum. This opening suggests buyers are aggressively entering the market, potentially driving prices higher.
If the price sustains above 22,987, it could target the resistance zone of 23,138–23,300. This zone is a profit-booking area where selling pressure might emerge due to historical resistance.
If the price faces rejection at 23,138–23,300, a reversal trade could be considered, targeting a pullback to 22,764–22,887 (the previous close and support zone).
Should the price break above 23,300 with strong momentum (e.g., high volume and bullish candlestick patterns), we might see a rally toward 23,400 or higher.
✅ Trade Plan:
✔️ Buy on a breakout and retest of 22,987 , targeting 23,138–23,300. Use a stop-loss below 22,887 to manage risk.
✔️ Short if the price rejects 23,138–23,300, aiming for 22,764–22,887. Place a stop-loss above 23,300 to limit potential losses.
Explanation: A Gap-Up opening reflects optimism, but chasing the gap immediately can be risky. Waiting for a retest of 22,987 ensures confirmation of bullish intent, while the resistance at 23,138–23,300 acts as a natural profit-taking zone. A breakdown from this resistance could signal a false breakout, offering a shorting opportunity.
🔹 Scenario 2: Flat Opening (Near 22,764–22,887)
If NIFTY 50 opens within the range of 22,764–22,887, it suggests a balanced market with no clear directional bias. This zone acts as a critical opening support/resistance area where price action could consolidate or break out.
A breakout above 22,887 could drive prices toward 23,138–23,300, signaling bullish momentum.
A breakdown below 22,764 might lead to selling pressure, targeting 22,510 (last intraday support) or even 22,235–22,156 (buyer’s support zone).
✅ Trade Plan:
✔️ Buy above 22,887 , targeting 23,138–23,300. Use a stop-loss below 22,764 to protect against a false breakout.
✔️ Sell below 22,764 , targeting 22,510 or 22,235–22,156. Set a stop-loss above 22,887 to manage downside risk.
Explanation: A Flat opening often leads to consolidation, making it tricky to trade without confirmation. The 22,764–22,887 range is a no-trade zone unless a decisive breakout occurs. Traders should wait for clear price action (e.g., strong candlestick patterns or increased volume) before entering positions to avoid fake moves.
🔹 Scenario 3: Gap-Down Opening (100+ points)
If NIFTY 50 opens below 22,664 (a gap of 100+ points from the previous close of 22,887), it signals bearish sentiment and potential weakness in the market.
Immediate support lies at 22,510–22,400 (last intraday support). If this holds, a pullback toward 22,764–22,887 could occur.
If 22,510 breaks with strong selling pressure, expect further downside toward 22,235–22,156 (buyer’s support zone).
✅ Trade Plan:
✔️ Buy near 22,510 , targeting a pullback to 22,764–22,887. Use a stop-loss below 22,400 to limit risk.
✔️ Short below 22,510 , targeting 22,235–22,156. Place a stop-loss above 22,510 to protect against a quick recovery.
Explanation: A Gap-Down opening indicates panic or profit-taking, but prices can recover if support levels hold. Waiting for confirmation near 22,510 ensures the price isn’t just oversold, while a break below this level confirms bearish momentum for shorting opportunities.
📌 Risk Management Tips for Options Trading 💡
🛑 Always Use a Strict Stop-Loss: Protect your capital by setting stop-loss orders at key support/resistance levels to limit potential losses.
🎯 Take Partial Profits: Lock in gains at intermediate targets (e.g., 23,138 or 22,510) to secure profits while allowing room for further moves.
🕰️ Avoid Overtrading: Stick to the plan and wait for clear price action confirmation—don’t force trades in uncertain conditions.
💰 Use Proper Position Sizing: Risk only a small percentage of your capital (e.g., 1–2%) per trade to ensure longevity in the market.
📌 Summary & Conclusion 🎯
✔️ Bullish Above: 22,887 → Target: 23,138–23,300.
✔️ Bearish Below: 22,764 → Target: 22,510 or 22,235–22,156.
✔️ No Trade Zone: 22,764–22,887 (Wait for a breakout).
Trade with discipline, follow your plan, and prioritize risk management to navigate the NIFTY 50 market effectively on February 24, 2025. 🚀

Accumulation Zone Activated in Nifty 50As we discussed before 1 month
Nifty react as well as my Analysis
🔍 Nifty 50 Analysis – Here’s a detailed breakdown of the chart and its implications:
⚔️Key Observations
📌 1. Accumulation Zone (22,625 - 22,821) ✅
🔹 This zone is a "best price range for long-term investment."
🔹 Historically, accumulation zones indicate a potential demand area where institutional buyers may step in.
🔹 If the index holds this level, we could see an upward movement 📈.
📌 2. Strong Resistance Zone (23,050 - 23,178) ❌
🔹 The chart suggests this area is a potential reversal point.
🔹 If Nifty reaches this level, profit booking or selling pressure may emerge.
🔹 A breakout above this zone could signal further bullish momentum 🚀.
📌 3. Projected Price Action (Wave Structure) 🔄
🔹 The pattern (A → D → F) suggests a possible bounce from accumulation to resistance.
🔹 If resistance is broken, Nifty could rally further.
📊 Trading Strategy
✅ Bullish View:
🔹 If Nifty holds above 22,625, it could move toward 23,050 - 23,178.
🔹 A breakout above 23,178 may signal a continued uptrend 🚀.
❌ Bearish View:
🔹 A breakdown below 22,625 could lead to further declines 📉.
🔹 If this happens, new support levels need to be identified.
⚠ Disclaimer: I am not a SEBI-registered analyst. Stock markets are subject to market risks. Please do your own research before investing. 📢📊

#NIFTY Intraday Support and Resistance Levels - 24/02/2025Flat or slightly gap down opening expected in nifty. After opening important level is 22750. In case nifty starts trading below this support level then possible strong downside rally in index upto 22550 in today's session. Any upside rally only expected if nifty sustain above 22800 support level. Upside 23000 level will act as a strong resistance for any bullish side rally.

Nifty Market Update: Bears Are in Control – A Rough Ride Ahead?The Nifty closed at 22,795 this week, down by 134 points from the previous week’s close, with a high of 23,049 and a low of 22,720. The formation of a Gravestone Doji candle indicates that the market is firmly under the control of the bears, signaling potential weakness ahead. As forecasted last week, Nifty moved within the range of 23,450 to 22,400, aligning perfectly with my predictions.
Looking ahead to next week, I expect Nifty to trade between the 23,300 to 22,250 range. While 22,300-22,400 offers a strong support zone, if the index slips below 22,250, it could test the WEMA100 at 22,050, which could offer some relief.
Digging deeper, I analyzed the Nifty50 monthly chart from 2004 onwards and noticed a recurring pattern: whenever Nifty closes below the monthly EMA21, it tends to test the EMA50, which currently stands at 19,450. If this month’s close is below 22,400, we could be heading toward 19,450, so brace yourselves for what could be a bumpy ride ahead.
On the international front, the S&P 500 is showing signs of forming a bearish M-pattern, a negative signal for the broader market. This is troubling news for Indian markets, which are already under pressure. From the current level of 6,013, a 1.5% correction could see the index testing support levels around 5,900.
The battle between bears and bulls continues, but for now, I believe the bears still have the upper hand. Stay cautious and keep a close watch on market movements – volatility is here to stay!

Nifty Review & Analysis - DailyPrice Action :
Nifty closed above 22900, making a small green candle trading in a smal band of 130 points whole day.
Technicals:
Nifty opened below previous day’s close around 22800 levels and sw si=ome buying at opening but faikled to move above 22950, trading whole day in a band of 50-70 points consolidating forming a small Green candle closing below 10,20,50,200 DEMA.
The momentum indicator, RSI - Relative Strength Index was sideways
Support/Resistance
Major Support 22700
Immediate Support 22850
Immediate Resistance 22950
Major Resistance 23100
Trend:
Overall Trend is Bearish sideays
Options Data:
Highest CE OI was at 23000 which also saw majoe writing - Resistance
Highest PE OI was at 23000, highest Put writing seen at 22600, 22700 ,22900 levels
PCR is 0.8 which indicates inconclusivness
Futures Data:
FII Long/Short ratio improved to 16.5%/83.5%
FII Future positions saw little change
Nifty Futures price was bit down,, a slight decrease in price alongside increase in Open Interest (OI) which typically indicates slight Bearishness
Outlook for Next Session:
Nifty is weak below 22800 or might see selling above 22950-23000
Approch:
Short at higher levels for 22700-22600 tgt
Wait for today’s High or Low to break and sustaines for further direction
My Trades & Positions:
No positions in Feb series

NIFTY : Trading levels and Plan 20-Feb-2025We will analyze three possible opening conditions and strategize accordingly. Key levels are marked for better decision-making.
🔹 Scenario 1: Gap-Up Opening (100+ points)
If NIFTY opens above 23,008 (last intraday resistance):
Sustaining above 23,008 can lead to an upside move towards 23,158 - 23,191 (Profit Booking Zone). If price sustains above this, we may see further bullish momentum.
Watch for rejection at 23,158-23,191—a reversal here could trigger selling pressure, providing a shorting opportunity with a target back to 23,008.
Aggressive traders can look for quick scalping opportunities on breakouts with strict stop-loss.
✅ Trade Plan:
✔️ Buy on breakout & retest of 23,008, targeting 23,158 - 23,191.
✔️ Short if price rejects 23,158-23,191, aiming for 23,008.
⚠️ Risk Tip: If price consolidates near 23,008, avoid trading immediately—wait for a strong direction confirmation.
🔹 Scenario 2: Flat Opening (Near 22,954 - 22,914)
If NIFTY opens within the 22,914 - 22,954 zone (Opening Resistance/Support), this could act as a No Trade Zone due to potential choppiness.
A decisive breakout above 22,954 can lead to a move towards 23,008 and higher levels.
A breakdown below 22,886 (Opening Support) could trigger selling towards 22,795.
✅ Trade Plan:
✔️ Buy above 22,954, targeting 23,008 and 23,158.
✔️ Sell below 22,886, targeting 22,795.
⚠️ Risk Tip: Avoid trading inside the No Trade Zone (22,895 - 22,949) unless a clear breakout happens with strong volume.
🔹 Scenario 3: Gap-Down Opening (100+ points)
If NIFTY opens below 22,795, it signals weakness.
Immediate support exists at 22,740 - 22,758 (Last Intraday Support). If this holds, expect a possible pullback towards 22,886 - 22,914.
If 22,740 breaks, expect further downside towards 22,636 (Buyer’s Support).
✅ Trade Plan:
✔️ Buy near 22,740, targeting a pullback to 22,886 - 22,914.
✔️ Short below 22,740, targeting 22,636 and lower.
⚠️ Risk Tip: In a gap-down scenario, watch for consolidation before entering. A weak opening doesn’t always mean immediate selling—wait for confirmation.
📌 Risk Management Tips for Options Trading 💡
🛑 Always use a strict stop-loss to protect capital.
🎯 Take partial profits at key levels to secure gains.
🕰️ Avoid overtrading—wait for clear price action confirmation.
💰 Use proper position sizing to manage risk.
📌 Summary & Conclusion 🎯
✔️ Bullish Above: 23,008 → Target: 23,158 - 23,191.
✔️ Bearish Below: 22,886 → Target: 22,795 - 22,740.
✔️ No Trade Zone: 22,895 - 22,949 (Wait for breakout).
Trade with a plan, manage risk wisely, and stay disciplined. ✅🚀
⚠️ Disclaimer
I am not a SEBI-registered analyst. This analysis is for educational purposes only. Please consult your financial advisor before making any trades. 📉📈

Mother Line again resisting and Trendline supporting. Something got to give now in a big way as Mother line 50 Hours EMA of 1 hour chart is resisting the up move and trend line formed from the base of recent low is providing support to the Nifty. Few things can happen here which everyone can observe for Educational purpose:
1) If Trend line is broken Nifty will again try to seek support at 3 month or more cyclical points of 22802 or 22722. If 22722 is broken Nifty may find itself again searching for Bottom which can be temporarily near 22451.
2) Second thing that can happen is Nifty can just like last 2 days stay range bound and trapped between trend line supports and resistance in the range of 22722 to 23022 (Mother line of 50 hours EMA).
3) We might get a break out if we get a closing above 23022 (Mother line). In such a scenario the next resistance levels based on cyclical 3 month or older data seem to be near 23108, 23200 or 23283 (200 Hours EMA or the Father line). If we get a closing above Father line 23283 the next resistances can be 23494 or 23804.
This is what short term outlook of Nifty looks like.
Disclaimer: The above information is provided for educational purpose, analysis and paper trading only. Please don't treat this as a buy or sell recommendation for the stock or index. The Techno-Funda analysis is based on data that is more than 3 months old. Supports and Resistances are determined by historic past peaks and Valley in the chart. Many other indicators and patterns like EMA, RSI, MACD, Volumes, Fibonacci, parallel channel etc. use historic data which is 3 months or older cyclical points. There is no guarantee they will work in future as markets are highly volatile and swings in prices are also due to macro and micro factors based on actions taken by the company as well as region and global events. Equity investment is subject to risks. I or my clients or family members might have positions in the stocks that we mention in our educational posts. We will not be responsible for any Profit or loss that may occur due to any financial decision taken based on any data provided in this message. Do consult your investment advisor before taking any financial decisions. Stop losses should be an important part of any investment in equity.

Nifty Analysis: Potential Final Low and Key Reversal ZonesNifty Analysis: Potential Final Low and Key Reversal Zones
Pattern & Wave Structure
=====================
1. The market appears to be in the late stages of a higher-degree Wave (4) correction in a classical A‑B‑C formation.
2. Based on current wave counts, the 17th February low could mark the completion of Wave C (and thus Wave (4)).
3. If the price undercuts that low again, the 25th Feb–6th March window stands out as another high‑probability reversal zone.
Price & Time Analysis
================
1. Fibonacci Retracements near the 23,400–22,550 region align with typical corrective targets (0.382 and 0.5 retracements).
2. Several cycle durations (High‑High, Low‑Low, etc.) also converge in the late Feb to early March window, suggesting that if the 17th Feb low fails, price is likely to pivot within this narrow time band.
Momentum Across Multiple Time Frames
==============================
1. Daily (8‑ & 13‑period Stoch RSI): Just triggered a bullish reversal signal, indicating a near‑term upside bias.
2. Weekly Stoch RSI: Currently in a bearish phase but could shift higher if price stabilizes or rallies from current levels.
3. Monthly Momentum: Deep in oversold territory, suggesting the market is nearing a major inflection point (downside risk appears more limited).
Overall Outlook
===========
With three time frames hinting that bearish momentum is losing steam—and a clear confluence of Fibonacci targets and time cycles—downside appears limited if not already exhausted.
A decisive push above recent swing highs would strengthen the case that the 17th Feb low was a significant bottom.
Conversely, a brief extension lower into late Feb–early March could still offer a strong rebound if support is confirmed in that zone.
Conclusion
=========
The interplay of price levels, time cycles, and momentum indicators points to a potential final leg of the correction nearing completion. If 17th Feb was not the turning point, then the upcoming 25th Feb–6th March window may serve as an important inflection date for Nifty. Keep an eye on key Fibonacci support zones and the evolving Stoch RSI signals for confirmation of a sustained upside move.

#NIFTY Intraday Support and Resistance Levels - 19/02/2025A flat opening today in nifty, with the index currently positioned near 23000-22950. If Nifty moves above 23050, a long position can be considered, targeting 23150, 23200, and 23250+.
However, a reversal short trade can be initiated around 23000-22950, with downside targets of 22900, 22850, and 22800. On the bearish side, a breakdown below 22750 will likely lead to further declines, with short targets set at 22650, 22550, and 22500.
Since the price is currently moving within the 22950-23000 range, the market is likely to open flat and may remain range-bound initially. The decisive move will come if it either breaks above 23050 for an uptrend or falls below 22750 for a bearish move. Should wait for a breakout confirmation before entering positions.

Nifty stopped by Trendline and Mid-Channel Resistance. Nifty again today was stopped by the trendline and mid channel resistance inside the falling channel. A closing above mid-channel around 22967 will enable some strength to Nifty. However closing above the Mid-Channel will not be enough as there are 50 hours resistance line or the Mother line of hourly chart nearby as well. This Mother line is at 23043. The next resistance if we get a closing above 23043 will be near 23200. After this hurdle is crossed the next hurdle is near 23307. 23307 is the Father line of hourly chart. Post crossing this area the channel top will be near 23494. Supports for Nifty right now are at 22802, 22745. If 22745 is broken channel bottom support is near 22451 and post that trend bottom support near 22114. The closing was negative today but shadow of the candle is neutral to positive. Which can be considered a possible sign of reversal. However it is to early to call it a clear reversal until we get a closing above 23494.
Disclaimer: The above information is provided for educational purpose, analysis and paper trading only. Please don't treat this as a buy or sell recommendation for the stock or index. The Techno-Funda analysis is based on data that is more than 3 months old. Supports and Resistances are determined by historic past peaks and Valley in the chart. Many other indicators and patterns like EMA, RSI, MACD, Volumes, Fibonacci, parallel channel etc. use historic data which is 3 months or older cyclical points. There is no guarantee they will work in future as markets are highly volatile and swings in prices are also due to macro and micro factors based on actions taken by the company as well as region and global events. Equity investment is subject to risks. I or my clients or family members might have positions in the stocks that we mention in our educational posts. We will not be responsible for any Profit or loss that may occur due to any financial decision taken based on any data provided in this message. Do consult your investment advisor before taking any financial decisions. Stop losses should be an important part of any investment in equity.

NIFTY : Trading levels and Plan for 19-Feb-2025We will analyze potential trade setups for NIFTY based on three different opening scenarios: Gap-Up, Flat, and Gap-Down. The plan is designed to help traders navigate the market effectively while managing risk.
📍 Scenario 1: Gap-Up Opening (100+ Points)
If NIFTY opens with a gap-up above 22930, we need to carefully assess the price action at key resistance zones.
✅ Plan of Action:
If the index sustains above 22950, it may move towards the 23039-23065 resistance zone.
A strong breakout above 23065 can push NIFTY towards 23178. However, watch for rejection signs near resistance.
If price struggles at 23039-23065, it may provide a short opportunity with a downside target of 22895-22949.
🛑 Invalidation: If NIFTY breaks and sustains above 23065, bearish trades should be avoided.
🎯 Bullish Target: 23178
🔻 Bearish Target: 22895
📍 Scenario 2: Flat Opening
A flat opening near 22,923 requires patience as price discovery takes place.
✅ Plan of Action:
If price remains between 22,895 - 22,949, it's a No-Trade Zone 📌 – avoid choppy action.
A breakout above 22,950 can push the index towards the 23039-23065 resistance area.
A breakdown below 22,895 may lead to a test of the 22,755-22,779 support zone.
If NIFTY takes support at 22,755, it may provide a buying opportunity.
🚨 No Trading in Choppy Zone: Avoid entering positions unless there is a clear breakout or breakdown.
🎯 Bullish Target: 23039
🔻 Bearish Target: 22,755
📍 Scenario 3: Gap-Down Opening (100+ Points)
If NIFTY opens below 22,850, it suggests weakness and a test of key support zones.
✅ Plan of Action:
If price holds 22,755-22,779, a bounce-back move can be expected.
A strong breakdown below 22,755 can drag NIFTY towards the 22,648-22,672 weak buyer’s support.
If the market finds demand at 22,648, it could lead to an intraday reversal opportunity.
📢 Watch out for panic selling near support zones – look for reversal signs before going long.
🎯 Bullish Target: 22,923
🔻 Bearish Target: 22,648
🎯 Risk Management & Pro Tips for Options Traders
📌 Avoid buying options immediately after market opens – wait for direction confirmation.
📌 Use stop-loss wisely – protect capital in volatile conditions.
📌 Time decay matters! If trading options, avoid holding losing positions for too long.
📌 Watch for wicks & rejection candles near key levels to time your entries better.
📌 Summary & Conclusion
✅ Key Resistance Levels: 23039-23065, 23178
✅ Key Support Levels: 22,755-22,779, 22,648-22,672
✅ No Trade Zone: 22,895 - 22,949
🚀 Bullish above: 22,950
📉 Bearish below: 22,755
⚠️ Disclaimer: I am not a SEBI-registered analyst. This analysis is for educational purposes only. Trade at your own risk! 💡

#NIFTY Intraday Support and Resistance Levels - 18/02/2025Today will be flat opening expected in nifty. After opening important level is 23000. If nifty starts trading above 23050 then possible upside rally in opening session. If nifty not sustain above level and starts trading below 22950 then sharp downside expected upto 22800 and this can be extend further for 200+ points if nifty gives breakdown of 22750 level.

Great 234 point comeback by Nifty from lows of the day. Nifty made a great comeback of 234 points from lows of the day that is 22725 to close at 22959. The momentum has to carry forward tomorrow in order for any rally to sustain. Only when we get a closing above Mother and Father line Bulls can take a sigh of relief. Mother line and Father line are at 23530 and 23587 respectively. Before we reach there there are cyclical resistances 3 months or older at 22984, 23229 and 23435. Supports for Nifty will be at 22725, 22438 and 22159. If we get a weekly closing below 22159 the next supports will be at 21810 and 21302 only. So despite a good closing we are not out of danger zone as of now. Shadow of the candle is neutral as of now.
Disclaimer: The above information is provided for educational purpose, analysis and paper trading only. Please don't treat this as a buy or sell recommendation for the stock or index. The Techno-Funda analysis is based on data that is more than 3 months old. Supports and Resistances are determined by historic past peaks and Valley in the chart. Many other indicators and patterns like EMA, RSI, MACD, Volumes, Fibonacci, parallel channel etc. use historic data which is 3 months or older cyclical points. There is no guarantee they will work in future as markets are highly volatile and swings in prices are also due to macro and micro factors based on actions taken by the company as well as region and global events. Equity investment is subject to risks. I or my clients or family members might have positions in the stocks that we mention in our educational posts. We will not be responsible for any Profit or loss that may occur due to any financial decision taken based on any data provided in this message. Do consult your investment advisor before taking any financial decisions. Stop losses should be an important part of any investment in equity.

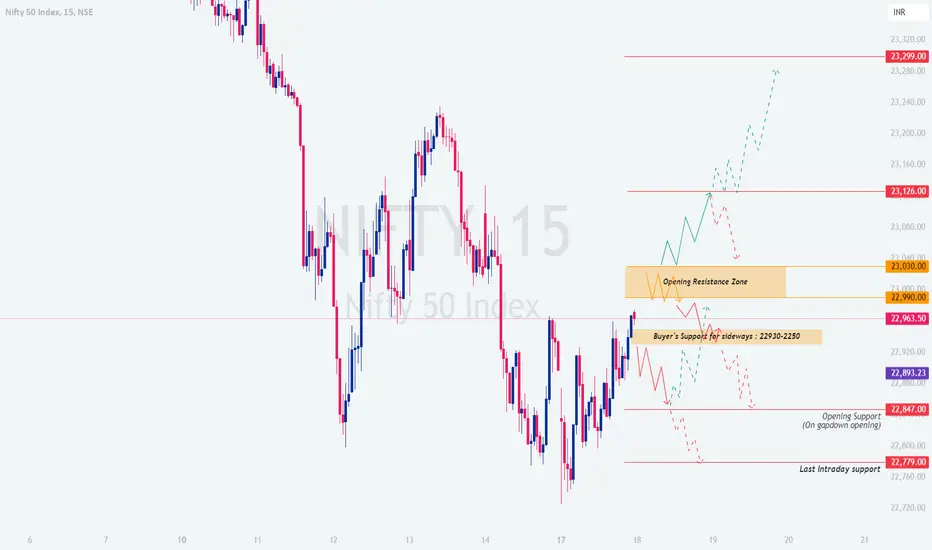
NIFTY : Trading levels and Plan for 18-Feb-2025
The market structure and price action suggest a key decision-making zone around 22,990-23,030. Based on the opening price, we will approach the trade accordingly.
🔹 1. Gap-Up Opening (100+ Points Above Previous Close)
If NIFTY opens with a gap-up above 23,030, it will directly enter the resistance zone. Here’s how to plan:
A rejection from 23,126 can trigger a short trade targeting 22,990. Confirmation is needed via bearish candles.
If NIFTY sustains above 23,126, a further rally towards 23,299 is possible. Look for a breakout retest before entering long positions.
Avoid fresh longs near resistance unless volume confirms breakout strength.
📌 Pro Tip: If opening above resistance, avoid chasing longs immediately; wait for a pullback.
🔹 2. Flat Opening (Near Previous Close: 22,954-22,990)
If price holds 22,990 and bounces, expect a push towards 23,030 and possibly 23,126.
A breakdown below 22,963 can lead to a drop towards 22,847.
Consider sideways movement between 22,990-23,030 as a no-trade zone unless a clear trend emerges.
📌 Pro Tip: Flat opens demand patience—wait for clear directional movement before entering.
🔹 3. Gap-Down Opening (100+ Points Below Previous Close)
If NIFTY opens below 22,847, it enters the support zone. Here’s how to approach:
A bullish rejection from 22,779 can offer a good long trade towards 22,847-22,963.
If the support fails, expect a deeper correction towards 22,720.
Sideways action in the 22,779-22,847 zone suggests waiting for trend confirmation.
📌 Pro Tip: Don’t rush into long trades unless price action confirms demand at support.
🔸 Risk Management & Options Trading Tips 🛡️
Keep SL tight, especially if trading near resistance/support zones.
Use option spreads to reduce risk in high-volatility conditions.
Avoid overtrading—stick to planned levels and execution strategies.
Watch open interest data to confirm market direction.
📌 Summary & Conclusion
✅ Resistance Levels: 23,030 → 23,126 → 23,299✅ Support Levels: 22,963 → 22,847 → 22,779✅ Trade Carefully in No Trade Zone: 22,990-23,030
🎯 The market is at a crucial level; patience and confirmation-based entries are key! Let the price action guide your trades.
⚠️ Disclaimer: I am not a SEBI-registered analyst. This analysis is for educational purposes only. Trade at your own risk! 🚀