#NIFTY Intraday Support and Resistance Levels - 17/02/2025Flat opening expected in nifty. After opening nifty will face strong resistance at 23000 level and expected downside movement upto the 22800 in opening session. For today's session, 22800 is the important support if nifty break this support and starts trading below 22750 then sharp downside rally possible upto 22500 level. Any major upside rally only expected if nifty starts trading and sustain above the 23050 level.
Niftylevels

NIFTY : Trading levels and plan for 17-Feb-2025
🔍 Market Context: NIFTY has shown a strong downtrend with critical resistance and support levels forming significant zones. The price action near key levels will determine the direction for the day. Let’s break down possible scenarios.
1. Gap-Up Opening (100+ Points Above 22,996) If NIFTY opens above 22,996 , it enters the "Opening Resistance/Support Zone". Sellers may step in around this zone, leading to a possible rejection and downside move toward 22,918 . If the price sustains above 23,135 , bullish momentum could extend toward the 23,359 resistance zone. Profit booking is expected around 23,359 , making it a key level to watch for reversals.
🔹 Action Plan: ✅ If NIFTY faces rejection at 22,996 , consider short trades with a target of 22,918 .✅ If price sustains above 23,135 , go long with a target of 23,359 .✅ If NIFTY reaches 23,359 , consider partial profit booking.
💡 Tip: In a gap-up scenario, option premiums inflate. Consider spreads instead of naked options to control risk.
2. Flat Opening (Between 22,918 - 22,996) A flat open indicates uncertainty, keeping price inside the No Trade Zone (22,912 - 22,996) . A breakout above 22,996 signals bullish momentum toward 23,135 . A breakdown below 22,918 invites selling pressure toward the 22,743 - 22,677 support zone.
🔹 Action Plan: ✅ Avoid taking trades within 22,912 - 22,996 until a clear breakout occurs.✅ If price breaks 22,996 , go long with a stop-loss below 22,900 .✅ If price breaks below 22,918 , go short targeting 22,743 .
💡 Tip: Flat openings often trap traders. Wait for 15-30 minutes before entering trades.
3. Gap-Down Opening (100+ Points Below 22,743) A gap-down opening below 22,743 signals bearish sentiment. The 22,508 level is a critical intraday support – breaking below it can accelerate selling pressure. If NIFTY bounces back from 22,508 , it could trigger an intraday pullback toward 22,743 .
🔹 Action Plan: ✅ If price sustains below 22,743 , go short with a target of 22,508 .✅ If price holds 22,508 and reverses, consider long trades for an intraday recovery.✅ A move above 22,743 can lead to short covering toward 22,918 .
💡 Tip: In a gap-down scenario, IV (Implied Volatility) spikes, making option premiums expensive. Selling OTM call options can be a profitable strategy.
⚠ Risk Management & Options Trading Tips
🔹 Always use stop-loss – Never trade without a predefined risk level.🔹 Position sizing is key – Avoid over-leveraging.🔹 Trade with confirmation – Enter only after clear price action signals.🔹 Manage time decay – If buying options, choose ATM or ITM strikes to reduce theta decay.
📌 Summary & Conclusion
✅ Key Levels to Watch:
Resistance: 22,996 / 23,135 / 23,359
Support: 22,918 / 22,743 / 22,508
✅ Trading Plan Overview:
Gap-Up: Watch for rejection at 22,996 , possible breakout toward 23,135 .
Flat Open: No Trade Zone between 22,912 - 22,996 – wait for breakout.
Gap-Down: If below 22,743 , bearish sentiment dominates with 22,508 as the key support.
💡 Final Tip: Trade with discipline and follow your plan. Avoid emotional decisions – the market rewards patience! 🚀
📢 Disclaimer: I am not a SEBI registered analyst . This trading plan is for educational purposes only . Please do your own research before taking any trades. 📊

Market Update: Nifty Faces Bearish Pressure, 17-21st feb
Nifty closed at 22,929 this week, marking a decline of 630 points from the previous week's close. The index reached a high of 23,568 and a low of 22,774. As highlighted in my previous post, the bearish sentiment in Nifty remains intact, as both the monthly and weekly timeframes show negative trends. Until there is a significant reversal on these timeframes, the bearish outlook is expected to continue.
Looking ahead to next week, I anticipate Nifty will move within a range of 23,450 to 22,400 . The 22,300/22,400 zone offers strong support, and if this level is breached, we could see Nifty heading towards the 21,800 levels. Given this volatility, Nifty might not be the ideal index for small investors, particularly those heavily invested in mid and small-cap stocks. Let’s now take a closer look at the mid-cap and small-cap indices.
The Mid-Cap Index is currently near its key support level of 48,700 on the monthly chart. If it manages to hold this support next week, a potential reversal could follow, offering some relief to investors. On the other hand, the Small-Cap Index is still far from its crucial support of 14,500, which suggests that we could witness further downside of 4-5% in this segment . This could add more pressure on small-cap stocks, which are already facing a tough environment.
On a global front, the S&P 500 has finally broken through the strong resistance at 6,100 and closed above this level. If it manages to sustain above 6,100, we could see it reach 6,225 or even 6,376. This could potentially provide some tailwinds for the Indian markets, but for now, it seems that the Indian market remains under the tight grip of bearish forces.
In conclusion, while there are some signs of potential recovery in specific indices, the overall sentiment remains cautious. Investors should stay vigilant, especially in mid and small-cap segments, as the road ahead could be bumpy.
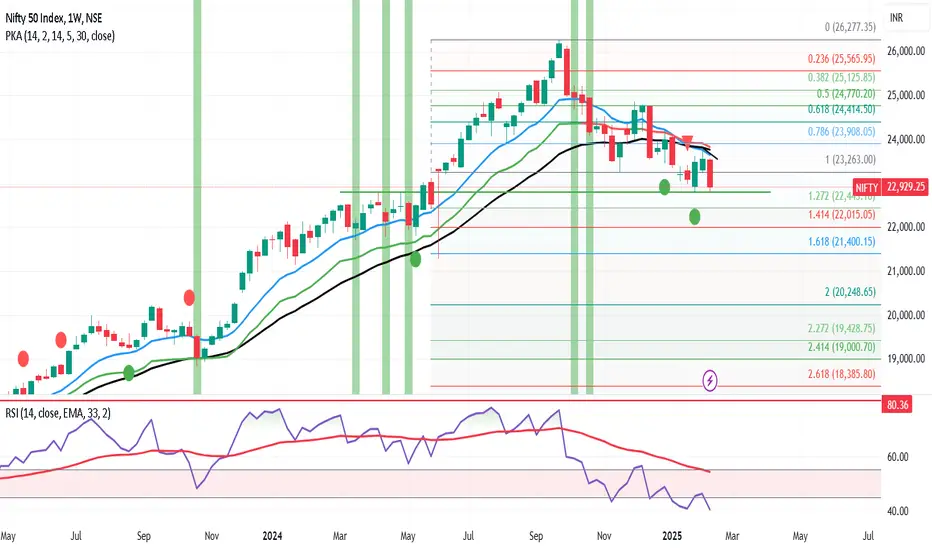
Nifty did well to hold on to crucial support. Can it hold ?Nifty did well today to bounce back from the lows of the day at 22774 to close at 22929. Holding this support is key. Under the pressure of relentless selling the market is in bear grip as of now. This is a good time to identify long term investment opportunities. Gaining immediate profits and fast recovery looks little difficult as of now. (You can not be 100% sure about the tops and bottoms of the market.) Next few months will give ample opportunities to average/add on bounce only. Mother father line supports and Resistances are the key to any investment during the bear phase of market. Patience of investors will be tested in the coming few weeks and months. Reshuffling your portfolios in favour of Fundamentally strong stocks that are going or still above 50 and 200 weeks EMA or Mother father line will be key. This is a stock pickers market. The forth that had build up post COVID rally is being cleared. Corrections are healthy sign for long term investors. Stock market is a place where money is transferred from the impatient to the patient. Pain will remain in the market for a short to medium term but hopefully great time and great rally awaits us in medium to long term. This next few weeks and probably months will test the new investors. Those who have seen a few Bull and Bear cycles know that good times do return eventually on the browsers.
Nifty Supports remain at: 22758, 22159, 21810 and finally 21302.
Nifty Resistances remain at: 23128, 23259 and 23435. Major hurdles for Bulls remain near Mother line at 23554 and Father line 23594. After a closing above 23838 only Bulls can be back into the game.
Disclaimer: The above information is provided for educational purpose, analysis and paper trading only. Please don't treat this as a buy or sell recommendation for the stock or index. The Techno-Funda analysis is based on data that is more than 3 months old. Supports and Resistances are determined by historic past peaks and Valley in the chart. Many other indicators and patterns like EMA, RSI, MACD, Volumes, Fibonacci, parallel channel etc. use historic data. There is no guarantee they will work in future as markets are highly volatile and swings in prices are also due to macro and micro factors based on actions taken by the company as well as region and global events. Equity investment is subject to risks. I or my clients or family members might have positions in the stocks that we mention in our educational posts. We will not be responsible for any Profit or loss that may occur due to any financial decision taken based on any data provided in this message. Do consult your investment advisor before taking any financial decisions. Stop losses should be an important part of any investment in equity.

Nifty 14th FEB 2025 – Key Support & Resistance ZonesNifty Analysis – Key Support & Resistance Zones
🔹 Support Zones (Green):
22,935 - 22,926: Strong support area where buyers may step in. A break below this level could lead to further downside.
🔹 Resistance Zones (Red):
23,296 - 23,317: First major resistance zone.
23,382 - 23,400: Another key resistance area.
23,440 - 23,479: Strong resistance—breakout above this could signal bullish momentum.
📊 Current Trend:
✅ Trading Plan:
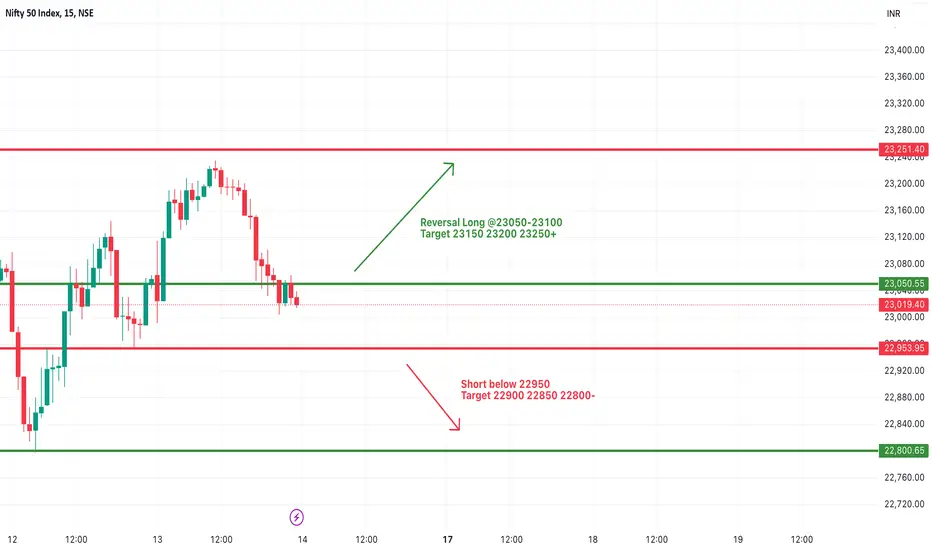
Bullish Scenario: Watch for a breakout above 23,153 for a potential move toward 23,296+.
Bearish Scenario: A breakdown below 23,019 could push the price toward 22,935 - 22,926.
📢 Keep an eye on price action near these levels and manage risk accordingly!

#NIFTY Intraday Support and Resistance Levels - 14/02/2025Gap up opening expected in nifty. After opening possible nifty will trade in between range of 23050 to 23250 in today's session. Any major and further downside only expected if nifty starts trading below the 22950 level. Upside 23250 will act as a strong resistance for nifty. Any strong bullish rally possible if nifty gives breakout of this resistance level.
NIFTY : Trading levels and Plan for 14-FEB-2025🔹 Key Levels:
📌 Resistance Zones:
🔴 Last Intraday Resistance: 23,262 – 23,306
🔴 Opening Resistance: 23,119 – 23,185
📌 Support Zones:
🟢 Opening Support/Resistance: 23,015 – 23,019
🟢 Buyer’s Support at Golden Retracement: 22,922 – 22,880
🟢 Stronger Buyer’s Support for Sideways/Consolidation: 22,677 – 22,742
📌 EMA: Price is reacting to the moving average, which could act as dynamic support/resistance.
📊 1️⃣ Gap-Up Opening (100+ points above previous close)
If NIFTY opens above 23,185:
Watch for rejection at 23,262 – 23,306: If price struggles, consider a short trade with SL above 23,320. Target: 23,185 – 23,100.
Sustained breakout of 23,306? Expect bullish momentum. Enter on a retest for targets 23,350 – 23,400.
Avoid impulsive longs at open: Wait for price to consolidate before entering trades.
💡 Pro Tip: If price rejects 23,262, sellers might step in aggressively. Consider buying Put options cautiously.
📊 2️⃣ Flat Opening (±50 points from previous close)
If NIFTY opens near 23,000 - 23,100:
Opening Support/Resistance Zone (23,015 – 23,019): This level will decide the market direction.
Break above 23,100? Expect bullish movement to 23,185. Go long above 23,105 with SL at 23,050.
Break below 23,015? Expect downside movement toward 22,922. Short below 23,010 with SL at 23,050.
💡 Pro Tip: In a flat opening, let price settle before making a decision. Patience pays!
📊 3️⃣ Gap-Down Opening (100+ points below previous close)
If NIFTY opens near 22,880 or below:
22,880 – 22,922 is a retracement support: If price holds, expect a bounce back. Go long above 22,900 with SL at 22,850.
Break below 22,880? Next major support is 22,677 – 22,742. Short below 22,870 with SL at 22,950.
If price reaches 22,677 and holds, expect a bounce. Look for buying opportunities around this level.
💡 Pro Tip: In a gap-down, avoid panic trades. Wait for proper confirmation before entering.
⚠️ Risk Management Tips for Options Trading
📌 Never chase a trade. Let price confirm the level before entering.
📌 Use stop-losses strictly. Protect your capital at all times.
📌 Avoid trading in the No Trade Zone. This is where stop-losses get hunted easily.
📌 Monitor IV (Implied Volatility). If IV is high, options premiums might be inflated. Consider spreads instead of naked options.
🔥 Summary & Conclusion
✅ Key Resistance: 23,119 – 23,185 / 23,262 – 23,306
✅ Key Support: 23,015 – 23,019 / 22,922 – 22,880 / 22,677 – 22,742
✅ Gap-Up: Watch resistance at 23,262. Breakout = bullish, rejection = short.
✅ Flat Opening: Wait for breakout/breakdown from Opening Support before entering.
✅ Gap-Down: 22,880 is crucial. Holding = bounce, breakdown = more downside.
🎯 Stick to the plan, follow discipline, and manage your risks!
⚠ Disclaimer: I am NOT a SEBI-registered analyst. This analysis is for educational purposes only. Trade at your own risk.

NIFTY 13th Feb 2025 Above the yellow zone → Bullish momentum is likely, meaning the price may rise toward the red resistance zones.
Below the yellow zone → Bears might take control, pushing the price toward the green support zones.
Green zones → Strong support levels, where price could bounce.
Red zones → Resistance levels, where price might face selling pressure.

NIFTY : Trading Levels and Plan for 13-Feb-2025
🔹 Key Levels:
📌 Resistance: 23,205 / 23,298 – 23,332 (Last Intraday Resistance)
📌 Support: 22,970 / 22,873 – 22,893 / 22,660 / 22,508
📌 No Trade Zone: 23,049 - 23,103 (Avoid trading inside this range)
📊 1️⃣ Gap-Up Opening (100+ points above previous close)
If NIFTY opens above 23,205:
Watch for rejection at 23,298 – 23,332: If price struggles, consider a short trade with SL above 23,350. Target: 23,205 – 23,100.
Sustained breakout of 23,332? Expect bullish momentum. Enter on a retest for targets 23,400 – 23,450.
Avoid impulsive longs at open: Wait for price to consolidate before entering trades.
💡 Pro Tip: If price rejects 23,298, sellers might step in aggressively. Consider buying Put options cautiously.
📊 2️⃣ Flat Opening (±50 points from previous close)
If NIFTY opens near 23,000 - 23,100:
No Trade Zone (23,049 - 23,103): Avoid trading here. Wait for price to break out clearly.
Break above 23,103? Expect bullish movement to 23,205. Go long above 23,105 with SL at 23,050.
Break below 23,049? Expect downside movement toward 22,970. Short below 23,045 with SL at 23,100.
💡 Pro Tip: In a flat opening, let price settle before making a decision. Patience pays!
📊 3️⃣ Gap-Down Opening (100+ points below previous close)
If NIFTY opens near 22,873 or below:
22,873 as support? If price holds, expect a bounce back. Go long above 22,900 with SL at 22,850.
Break below 22,873? Next major support is 22,660. Short below 22,870 with SL at 22,950.
If price reaches 22,660 and holds, expect a bounce. Look for buying opportunities around this level.
💡 Pro Tip: In a gap-down, avoid panic trades. Wait for proper confirmation before entering.
⚠️ Risk Management Tips for Options Trading
📌 Never chase a trade. Let price confirm the level before entering.
📌 Use stop-losses strictly. Protect your capital at all times.
📌 Avoid trading in the No Trade Zone. This is where stop-losses get hunted easily.
📌 Monitor IV (Implied Volatility). If IV is high, options premiums might be inflated. Consider spreads instead of naked options.
🔥 Summary & Conclusion
✅ Key Resistance: 23,205 / 23,298 – 23,332
✅ Key Support: 22,970 / 22,873 – 22,893 / 22,660 / 22,508
✅ No Trade Zone: 23,049 - 23,103
✅ Gap-Up: Watch resistance at 23,298. Breakout = bullish, rejection = short.
✅ Flat Opening: Wait for breakout/breakdown from No Trade Zone before entering.
✅ Gap-Down: 22,873 is crucial. Holding = bounce, breakdown = more downside.
🎯 Stick to the plan, follow discipline, and manage your risks!
⚠ Disclaimer: I am NOT a SEBI-registered analyst. This analysis is for educational purposes only. Trade at your own risk.

#NIFTY Intraday Support and Resistance Levels - 12/02/2025Today will be slightly gap up opening expected in nifty. After opening if it's sustain above 23050 level then expected reversal upto the 23250 level. 23250 level will act a strong resistance for today's session. Possible nifty will goes further downside from this level. Important support for today's session is 23000-23050 zone. Sharp downside expected below the 23000 level.

Nifty Review & Analysis - DailyPrice Action :
Nifty closed at 23072, down 1.32% after a sharp 200 points drop in 30 min, hitting an intraday low of 22986.
Technicals:
Nifty opened below previous day’s close and saw continued selling and saw sudden drop of 200 points in 2nd half and closed at 23072 down 1.32% forming a big Red candle suggesting weakness closing below 10,20,50,200 DEMA.
The momentum indicator, RSI - Relative Strength Index was down to 41
Support/Resistance
Major Support 22800
Immediate Support 22950
Immediate Resistance 23250
Major Resistance 23400
Trend:
Overall Trend is Bearish
Options Data:
Highest CE OI was at 23500, 23400 followed by 23300 - Resistance
Highest PE OI was at 22700 followed by 22800 - Support
23300CE 23400CE and 23500CE saw major addition signaling Shorts added
22700PE saw PE addition indicating support
PCR is 0.6 which indicates Bearishness
Futures Data:
FII Long/Short ratio improved to 14.5%/85.5%
FII exited 4K Longs in Future at 38K and Shorts intact at 1.9L contracts
Nifty Futures price was in down -1.4%, a slight decrease in price alongside slight increase in Open Interest (OI) typically indicates slight Bearishness
Outlook for Next Session:
Nifty is weak below 23000
Approch:
Short at higher levels for 22700 tgt
Wait for today’s High or Low to break and sustaines for further direction
My Trades & Positions:
Holding shorts from 23250 levels booked half at 23000

Nifty Review & Analysis - DailyPrice Action :
Nifty saw selling from the opening to close below 23400 but managed to bounce from 23300 levels.
Technicals:
Nifty opened below previous day’s close and saw continued selling to find support/buying around 23300 levels and saw slight pull back above 23350 levels forming a Bearish candle closing below 10,20,50,200 DEMA.
The momentum indicators, RSI - Relative Strength Index was down to 47
Support/Resistance
Major Support 23300
Immediate Support 23150
Immediate Resistance 23450
Major Resistance 24600
Trend:
Overall Trend is Bearish
Options Data:
Highest CE OI was at 23700, 23600 followed by 23600 - Resistance
Highest PE OI was at 23000 followed by 23100 - Support
23700CE 23600CE and 23500CE saw major addition signaling Shorts added
23200Pe saw unwinding indicating weakness and 23000pe saw addition indicating support
PCR is 0.6 which indicates Bearishness
Futures Data:
FII Long/Short ratio improved to 16.5%/83.5%
FII exited 4K Longs in Future at 38K and Shorts intact at 1.9L contracts
Nifty Futures price was in negative, a slight decrease in price alongside slight increase in Open Interest (OI) typically indicates slight Bearishness
Outlook for Next Session:
Nifty is weak below 23300
Approch:
Waiting for move up or down
Wait for today’s High or Low to break and sustaines for further direction
My Trades & Positions:
No Positions

#NIFTY Intraday Support and Resistance Levels - 10/02/2025Flat opening expected in nifty. After opening if nifty starts trading and sustain above 23600 level then expected upside rally upto 23800+ level in opening session. Major downside rally expected below 23550 level. This downside can goes upto the 23400 level.

Nifty's Next Move? 24,000 on the Cards!The hourly candle formed on Friday, 7th Feb looks promising! A bullish engulfing pattern, confirming RD while taking support at AVWAP, sets up an interesting long opportunity. With the low of this candle on a closing basis as SL, going long makes sense.
📈 Upside Target? 24,000 in the coming weeks!
📉 What about ATH? A new all-time high (ATH) looks unlikely unless we see a clear breakout above the heavy supply zone of 24,200 - 24,300.
🔍 Trading Idea
For now, shorting PUTs seems like a good play, aiming for 23,800 - 24,000 levels with a clear SL of closing below 23,400.
👀 What's your view? Drop your thoughts below! 🔥📊
⚠ Disclaimer: This is my personal view and not a recommendation or tip. Please do your own due diligence and study before making any trading decisions.
NSE:NIFTY


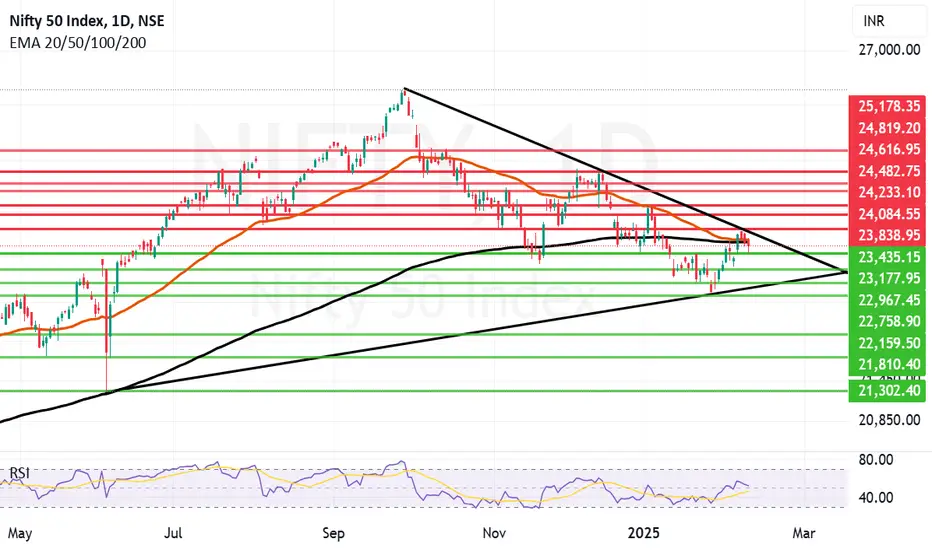
Can Nifty overcome Mother, Father and the Trendline resistances?With the results in Delhi elections that will suit the market fervor can Nifty break the triple whammy of Mother, Father and Trendline resistances which are not allowing it to fly? The answer to the question can be yes. But what is important is if Nifty can sustain the opening that it might get and hold on to the levels? This will depend again on FII activity. FII as we know are on the selling side continuously. Also there is an upcoming New Income Tax bill to be tabled. Investors will wait and see the action taken on the LTCG and STCG taxes on the income. No bad news can be a good news with respect to this aspect. After the income tax relief received and RBI rate cut.
Supports for Nifty remain at: 23435, 23177 and 22967. If the major support at 22967 is broken there can be a free fall in the market till the levels of 22758, 22159 or even lower as depicted in the chart.
Resistances for Nifty remain at: 22619 (Father Line, 200 days EMA), 22658 (Mother line, 50 days EMA), 22838 (Major trend line resistance). If 22838 is crossed and we get a closing above it we can see the levels of 24084, 24223 and 24482. For levels above 24482 we will have to get a weekly closing above the same first.
Disclaimer: The above information is provided for educational purpose, analysis and paper trading only. Please don't treat this as a buy or sell recommendation for the stock or index. The Techno-Funda analysis is based on data that is more than 3 months old. Supports and Resistances are determined by historic past peaks and Valley in the chart. Many other indicators and patterns like EMA, RSI, MACD, Volumes, Fibonacci, parallel channel etc. use historic data. There is no guarantee they will work in future as markets are highly volatile and swings in prices are also due to macro and micro factors based on actions taken by the company as well as region and global events. Equity investment is subject to risks. I or my clients or family members might have positions in the stocks that we mention in our educational posts. We will not be responsible for any Profit or loss that may occur due to any financial decision taken based on any data provided in this message. Do consult your investment advisor before taking any financial decisions. Stop losses should be an important part of any investment in equity.
NIFTY - Pre - Budgetary AnalysisHello Traders,
I hope this message finds you well. I am pleased to share an insightful analysis with you, which illuminates the continuation of the market shift in accordance with the budget.
Preliminary Analysis Overview:
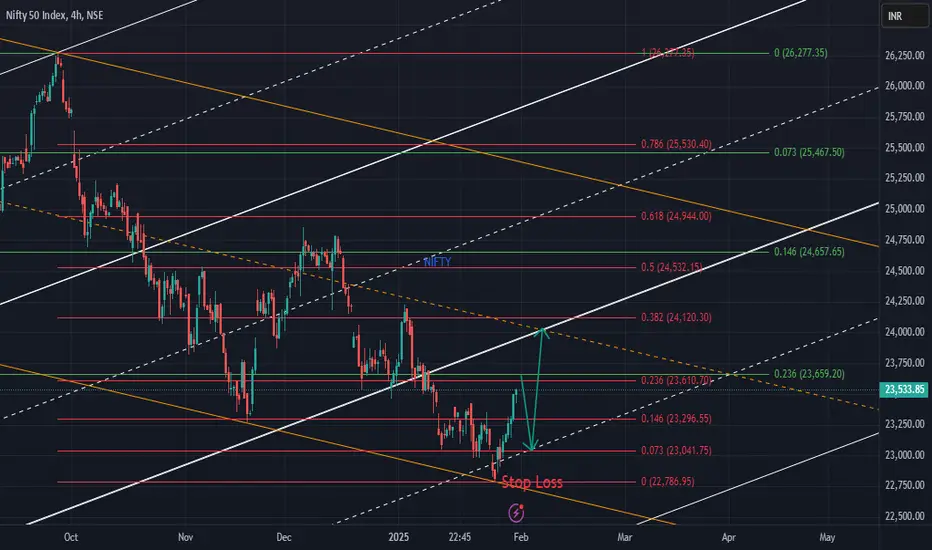
The correction initiated on September 27, 2024, comprises three phases and bottomed out at 22,786 on January 27, 2025 (~120D) . Given the recent decline, it is considered a correction within a correction, and we anticipate a retracement to higher levels before resuming the trend in a more significant manner.
The analysis is supported by the fact that a crucial time resistance for the down trend lies at 17 February 2025, where the market is anticipated to conclude the ongoing correction phase and initiate a new trend.
Phase I:
Following a brief rally in the pre-open and open periods, the market is expected to decline towards lower levels between 9.15 - 11 AM to the following levels.
SI: 23,300
SII: 23,140 (Stronger)
SIII: 23,041 (Potentially for extension to 23,000)
*Please note that these values are indicative and not actual.
Phase II:
Following the completion of the internal correction, the market is anticipated to resume its current interim upward trend in a more significant manner to test the 38.2 R 24,120 levels) + static support.
R I – 23,950
RII – 24,120 ~ 24,225
*These values are not actual but merely levels.
**Budget commentary that I expect: **
1. There will not be any change in corporate tax rate.
2. Personal IT may see a small slab change, accompanied by an increase in standard deduction.
3. No changes to STT, LTCG / STCG (revision(s) will undermine the integrity of the decisions from FM).
4. Reduced borrowing costs accommodating leveraged capex.
5. Incentivization (PLI, infra, agricultural & make in india).
6. Semi conductor push.
Overall, I am expecting a neutral budget – Neither hawkish nor dovish.
The markets will do what they have to….!!!
**Important Note:**
This entire analysis holds true only until the market breaks 22,786.90, although I believe not today.
** Final Verdict: **
The current uptrend is considered interim. The primary trend remains downward and is anticipated to persist further and deeper. This trend is expected to test the 38.2% support level coinciding with the 22,146 ~ 21,245 -support level.
**Strategy:**
Given the implied volatility increase, it is prudent to adapt to changes as they appear to transpire.
1. Sell until phase I.
2. Buy for phase II (Conservatives may await some confirmation with strict SL @ 22,786).
3. Exit any open position after phase II completion and await cues.
Fellow Traders,
The creation of this valuable analytical resource has necessitated countless hours of dedication and effort. If you find it useful, I humbly request your support by promoting the idea and following me (updates will be provided via this post, new posts, and through minds). Your comments and thoughts on this idea are highly valued, and I am committed to engaging with each one personally.
Thank you for investing your time in reading this article.
Wishing you profitable and fulfilling trading endeavors!
Disclaimer:
Before concluding, I must emphasize that the insights shared are based on my analysis. It is imperative that you conduct your own research and, if necessary, consult with a financial advisor before making any trading decisions. The dynamic nature of financial markets necessitates that your strategies align with your financial objectives and risk tolerance.
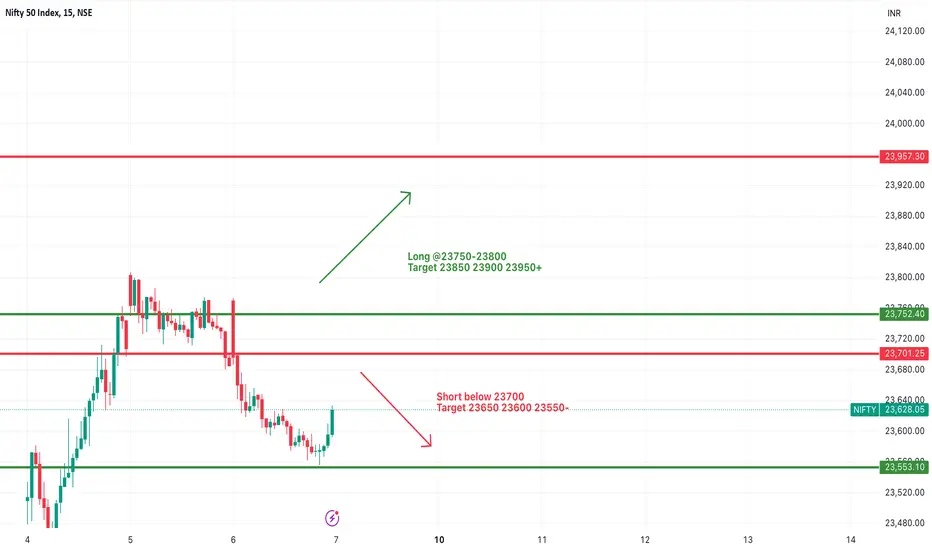
#NIFTY Intraday Support and Resistance Levels - 07/02/2025Gap up opening expected in nifty near the 23700 level. After opening if nifty starts trading above 23750 level then expected upside movement in index. This upside rally can goes upto 23950+ level. Below 23700 downside possible upto the 23550 support level in today's session.
Any major downside only expected below this support level.
NIFTY : TRADING LEVELS AND PLAN – 07-Feb-2025📌
🔹 Previous Close: 23,628.05
🔹 Important Zones to Watch:
🟥 Profit Booking Zone: 24,024 - 24,155
🟥 Last Intraday Resistance: 23,900
🟧 Opening Resistance: 23,747
🟧 No Trade Zone: 23,566 - 23,656
🟩 Last Intraday Support: 23,442
🟢 Support for Sideways Market: 23,346
📈 Scenario 1: Gap-Up Opening (Above 23,750)
If NIFTY opens with a gap-up of 100+ points above 23,750, it will enter the Opening Resistance Zone (23,747 - 23,900).
🔹 Bullish Strategy:
If NIFTY sustains above 23,900, expect a strong move toward the Profit Booking Zone (24,024 - 24,155).
Ideal entry will be on retracement near 23,900 with SL below 23,850.
🔻 Bearish Scenario:
If rejection is seen from 23,900 - 24,024, a short trade can be initiated targeting 23,750 - 23,650.
Stop loss for short trade above 24,100.
📝 Pro Tip: A direct gap-up into a resistance zone often leads to profit booking. Avoid aggressive longs unless a breakout is confirmed.
📊 Scenario 2: Flat Opening (Between 23,566 - 23,656)
A flat opening within the No Trade Zone (23,566 - 23,656) suggests uncertainty. Traders should wait for a clear breakout or breakdown.
🔹 Bullish Plan:
A breakout above 23,656 can trigger a long trade targeting 23,747 - 23,900.
SL for longs should be below 23,600.
🔻 Bearish Plan:
If NIFTY breaks below 23,566, expect a drop toward 23,442.
Short trade can be taken with SL above 23,600.
📝 Pro Tip: A flat opening often leads to range-bound price action initially. Avoid taking trades in the first 15-20 minutes unless a clear trend emerges.
📉 Scenario 3: Gap-Down Opening (Below 23,450)
If NIFTY opens below 23,450, it enters the Last Intraday Support Zone. Watch for a reversal or further breakdown.
🔹 Buying Opportunity:
A bullish reversal from 23,346 - 23,442 can give a long trade opportunity targeting 23,566 - 23,656.
Stop loss for longs should be below 23,300.
🔻 Breakdown Plan:
If 23,346 breaks, expect further downside toward 23,200-23,150.
Short trade can be taken with SL above 23,400.
📝 Pro Tip: A gap-down below key supports often triggers panic selling. But if a quick pullback is seen, it might be a bear trap—wait for confirmation before shorting.
⚠️ Risk Management & Options Trading Tips
✔ Option Buyers: Trade ATM (At-the-Money) options and avoid OTM options when volatility is low.
✔ Option Sellers: If IV (Implied Volatility) is high, selling OTM strikes can be a good strategy.
✔ Always Use Stop Loss: Risk management is key to capital preservation.
✔ Avoid Overtrading: Stick to planned trades and don’t force setups.
📌 Summary & Conclusion
🚀 Bullish above: 23,656 (Target 23,900 - 24,024)
📉 Bearish below: 23,566 (Target 23,442 - 23,346)
⚠️ Key Zones to Watch: No Trade Zone & Profit Booking Area
📊 Expect Volatility: Let the market establish a clear direction before taking trades.
⚠️ Disclaimer: I am not a SEBI-registered analyst. This analysis is for educational purposes only. Always do your own research before taking any trades. 📢📊
#NIFTY #TradingPlan #StockMarket #OptionsTrading 🚀

Nifty Review & Analysis - Daily
Price Action :
Nifty saw selling from the opening to close just above 23600
Technicals:
Nifty opened flat and saw selling from opening and found support around 23550 levels and managed to close above 23600 levels forming a Bearish Candle . A small profit booking was seen above 23700 levels but over all looked strong and stable Nifty closed below 50 and 200 DEMA but above 10&20 DEMA
The momentum indicators, RSI - Relative Strength Index was down to 53
FII Sold Rs. 3550 Cr in cash market
Support/Resistance
Major Support 23400
Immediate Support 23500
Immediate Resistance 23650
Major Resistance 24000
Trend:
Overall Trend is Bearish but short term Nifty is bit positive till it trades above 22300
Options Data:
Highest CE OI was at 24000 followed by 23600 - Resistance
Highest PE OI was at 23600 followed by 23500 and 23000 - Support
23700CE 23600CE saw major addition signaling Shorts added & 23700 is Resistance
PCR is 0.82 which indicates neutral
Futures Data:
FII Long/Short ratio improved to 16.5%/83.5%
FII exited 4K Longs in Future at 38K and Shorts intact at 1.9L contracts
Nifty Futures price was in negative, a slight decrease in price alongside slight increase in Open Interest (OI) typically indicates slight Bearishness
Outlook for Next Session:
Nifty in Strong above 23500
Approch:
Maintain Long positions with 23500 SL
avoid shorts
Wait for today’s High or Low to break and sustaines for further direction
My Trades & Positions:
still holding Long in Feb Series CE waiting for a big Short covering above 24100

NIFTY 7 FEBRUARY 2025Please check the levels on the chart for more details. The red zones represent resistance, and the green zones indicate strong support.

Two important Resistances to conquer for Nifty ahead. There are 2 important resistances for Nifty ahead which need to be conquered for the Bull run that started post budget to sustain. These 2 resistances are at 23630 and 23809. Today Nifty made a good comeback from lows of the day which was near 23556 to close at 23603. The resistnace near 23809 acted again as Nifty plummeted from the level of 23773 to fall to 23556. The trend line shown in the chart acted as support for Nifty to come back into the game. There are 3 important events coming up later. RBI Policy where market is expecting a rate cur. Delhi election results and finally Income tax bill to be tabled in the parliament. Market is fearing a little bit and hoping that there is no bad news related to LTCG or STCG etc. in the bill.
Nifty supports remain at: 23556, 23498 and 23484 (Mother and Father line of the daily chart). If this line is broken we can see Nifty falling to old support system of 23376 and 23222. Closing below 23222 can bring the Bears back into the game and calling the shots again.
Nifty Resistances remain at: 23630 and 23809. If these to resistances are conquered we can a strong up move towards 24K level with resistances at 23991, 24197 and 24344 level. Above 24344 level Bulls will come out of ICU and start taking control of the system.
Shadow of the candle right now is absolutely neutral. Tomorrows closing will be very important a closing above 23630 will be good but closing above 23809 will be great. Similarly a closing below 23556 will make the market weak. Nicely balanced right now.
Disclaimer: The above information is provided for educational purpose, analysis and paper trading only. Please don't treat this as a buy or sell recommendation for the stock or index. The Techno-Funda analysis is based on data that is more than 3 months old. Supports and Resistances are determined by historic past peaks and Valley in the chart. Many other indicators and patterns like EMA, RSI, MACD, Volumes, Fibonacci, parallel channel etc. use historic data. There is no guarantee they will work in future as markets are highly volatile and swings in prices are also due to macro and micro factors based on actions taken by the company as well as region and global events. Equity investment is subject to risks. I or my clients or family members might have positions in the stocks that we mention in our educational posts. We will not be responsible for any Profit or loss that may occur due to any financial decision taken based on any data provided in this message. Do consult your investment advisor before taking any financial decisions. Stop losses should be an important part of any investment in equity.

Nifty tried to consolidate today after the BO yesterday. Nifty did well to consolidate and end above 50 and 200 days EMA today Nifty closed at 23696 and the Mother and Father lines are at 23664 and 23620 respectively. These Two lines will continue to act as support for the coming days and sessions. Nifty faced a very stiff resistance today as expected near 23800. It will not be easy to cross this resistance. This was made clear by us in earlier messages. Exit poll results, followed by RBI rate cut followed by actual Delhi state election results in favour of market expectation can lead to a positive sentiment build up and these levels can be taken down and Nifty can even regain 24K levels in the coming time.
Nifty supports remain at: 23664 (Mother line), 23620 (Father Line), 23346 and 23222. Below 23222 weekly closing Nifty will become very bearish.
Nifty Resistances remain at: 23809, 23883, 23984 24108 and finally 24197. Above 24197 Weekly closing Nifty will become very bullish.
Disclaimer: The above information is provided for educational purpose, analysis and paper trading only. Please don't treat this as a buy or sell recommendation for the stock or index. The Techno-Funda analysis is based on data that is more than 3 months old. Supports and Resistances are determined by historic past peaks and Valley in the chart. Many other indicators and patterns like EMA, RSI, MACD, Volumes, Fibonacci, parallel channel etc. use historic data. There is no guarantee they will work in future as markets are highly volatile and swings in prices are also due to macro and micro factors based on actions taken by the company as well as region and global events. Equity investment is subject to risks. I or my clients or family members might have positions in the stocks that we mention in our educational posts. We will not be responsible for any Profit or loss that may occur due to any financial decision taken based on any data provided in this message. Do consult your investment advisor before taking any financial decisions. Stop losses should be an important part of any investment in equity.
