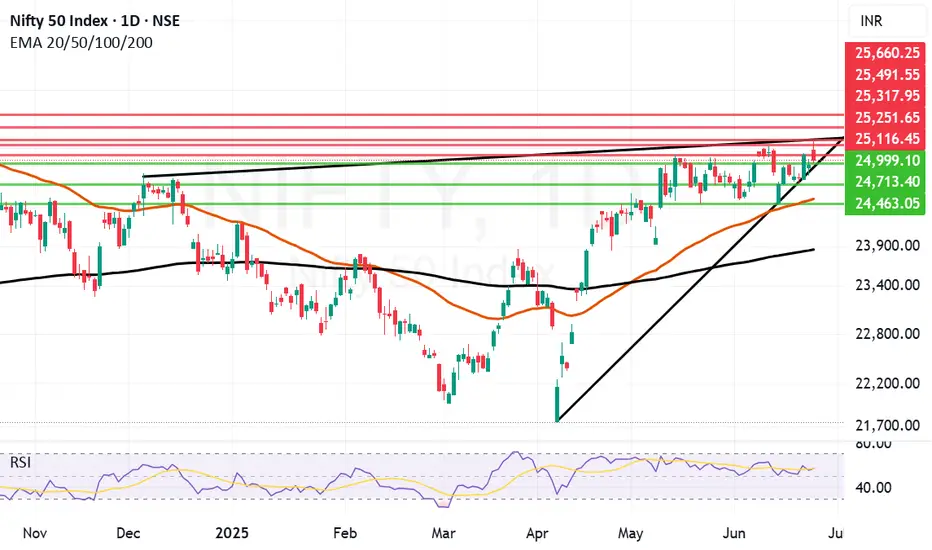
Final hurdle remains to be crossed before Nifty can fly further.One important final hurdle of 25251 remain just in front of Nifty before it can fly further. I can it a final hurdle because it is an important trendline resistance. Last 2 days Nifty has tried to climb above it but we did not get a closing above it yesterday and today as well. Today Nifty made a high of 24266 but closed at 25244. It could not hold on to the ground above 25251. The level is challenging but positive momentum built from today's display might allow it to close above the same. Only time will tell. Closing of this week will be very important.
Nifty resistances remain at: 25251, Closing above 25251 will empower Bulls to pull Nifty further upwards towards 25317, 25491 and 25660.
Nifty supports remain at: 24999, 24713, 24749 (Mother Line Support), 23875 (Father line support). (Closing below Father line support can bring Bears back into the game).
Disclaimer: The above information is provided for educational purpose, analysis and paper trading only. Please don't treat this as a buy or sell recommendation for the stock or index. The Techno-Funda analysis is based on data that is more than 3 months old. Supports and Resistances are determined by historic past peaks and Valley in the chart. Many other indicators and patterns like EMA, RSI, MACD, Volumes, Fibonacci, parallel channel etc. use historic data which is 3 months or older cyclical points. There is no guarantee they will work in future as markets are highly volatile and swings in prices are also due to macro and micro factors based on actions taken by the company as well as region and global events. Equity investment is subject to risks. I or my clients or family members might have positions in the stocks that we mention in our educational posts. We will not be responsible for any Profit or loss that may occur due to any financial decision taken based on any data provided in this message. Do consult your investment advisor before taking any financial decisions. Stop losses should be an important part of any investment in equity.
Niftylevels
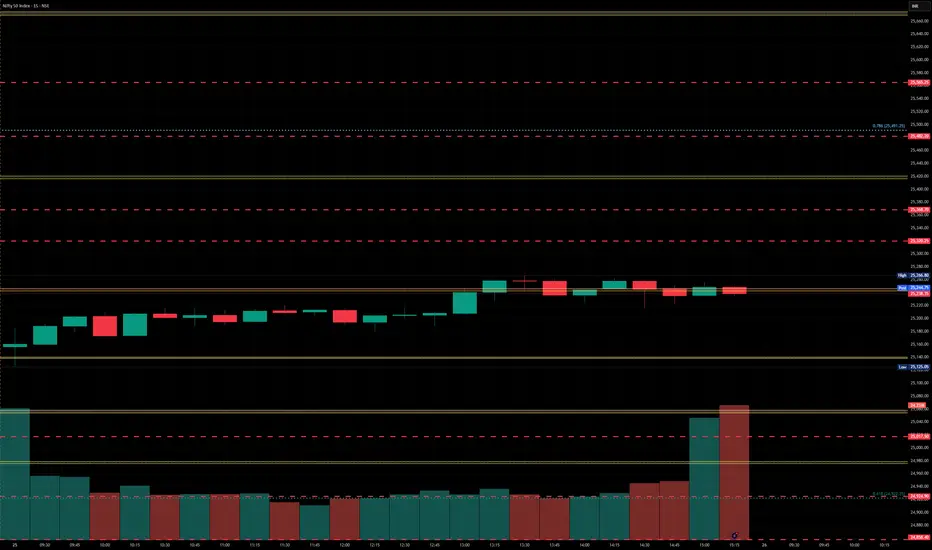
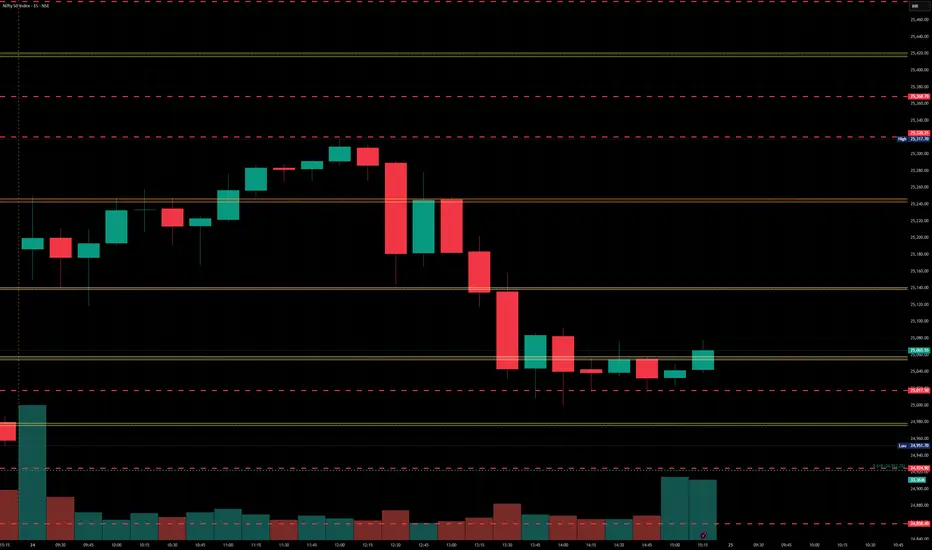
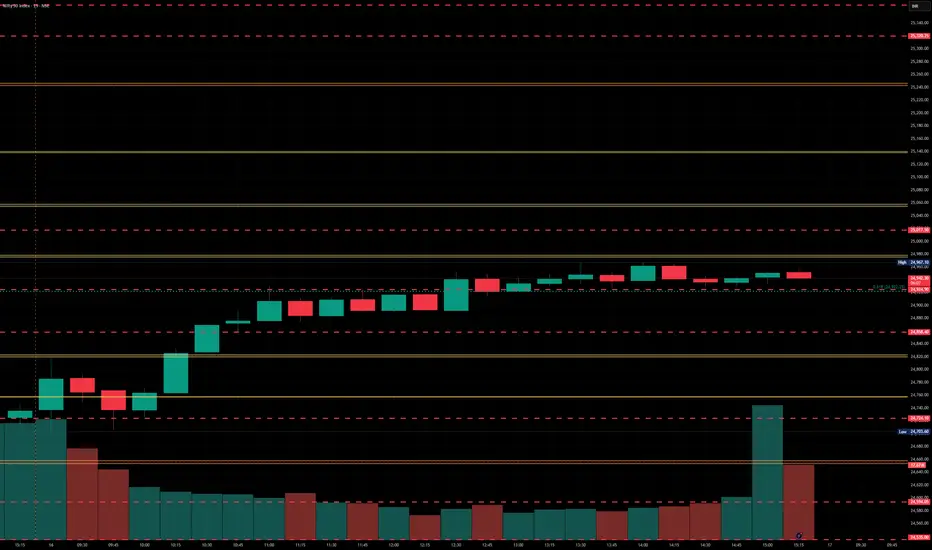
Nifty levels - Jun 26, 2025Nifty support and resistance levels are valuable tools for making informed trading decisions, specifically when combined with the analysis of 5-minute timeframe candlesticks and VWAP. By closely monitoring these levels and observing the price movements within this timeframe, traders can enhance the accuracy of their entry and exit points. It is important to bear in mind that support and resistance levels are not fixed, and they can change over time as market conditions evolve.
The dashed lines on the chart indicate the reaction levels, serving as additional points of significance to consider. Furthermore, take note of the response at the levels of the High, Low, and Close values from the day prior.
We hope you find this information beneficial in your trading endeavors.
* If you found the idea appealing, kindly tap the Boost icon located below the chart. We encourage you to share your thoughts and comments regarding it.
Wishing you success in your trading activities!
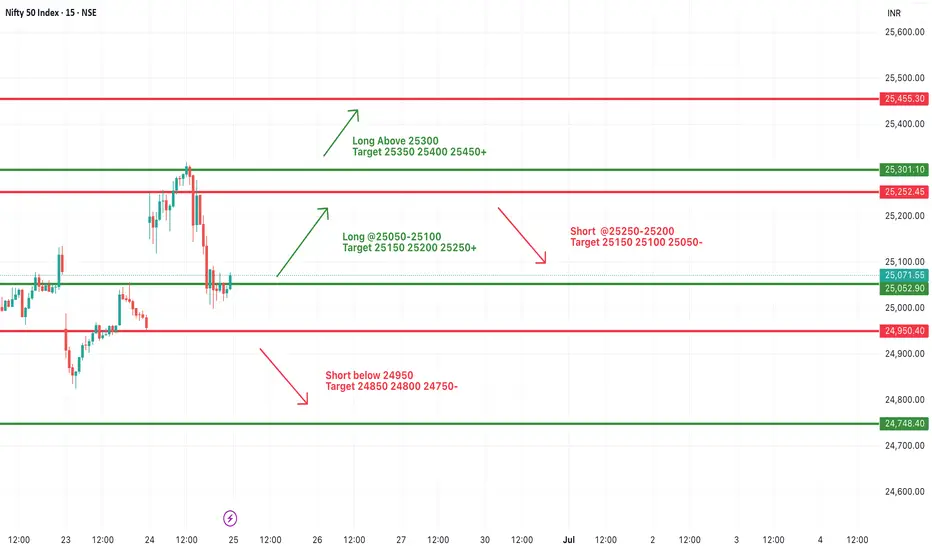
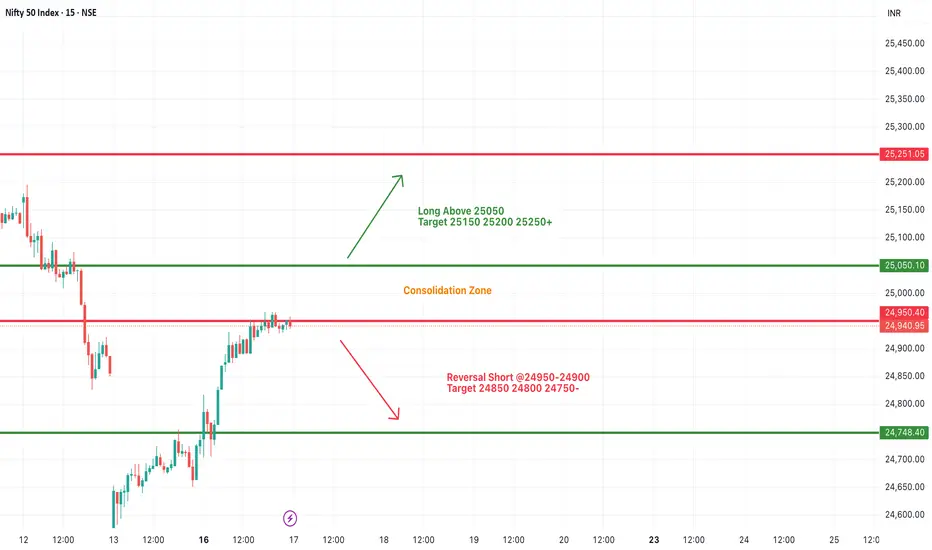
#NIFTY Intraday Support and Resistance Levels - 25/06/2025Nifty is expected to open with a gap-up near the 25,250 level, signaling early bullish strength. If the index sustains above the 25,250–25,300 zone after opening, we could see a continuation of the upward momentum toward the next resistance levels at 25,350, 25,400, and possibly 25,450+. However, if it fails to hold above 25,250 and slips back into the 25,100–25,050 zone, there could be selling pressure. A break below 25,050 may drag Nifty further down to 24,950. If 24,950 breaks, then a short trade could trigger, with targets at 24,850, 24,800, and 24,750. The key levels to watch today are 25,250 on the upside and 24,950 on the downside.
Nifty lost gains but it is a positive sign to close above 25KNifty in the Euphoria of ceasefire between Iran and Israel gained a lot of ground early in the day and made a high of 25317 but could not sustain the levels and lost massive 273 points due to profit booking to close the day at 25044. Although the loss was big but the silver lining is Nifty still ended the day 72 points in the green and closed above 25K levels. As there were news and claims related to ceasefire violations from both sides a lot of investors and participants were apprehensive of carrying long positions forward. If the things remain positive over night and if important resistance levels of 25116 and 25251 are crossed we might yet again see positive momentum building.
Nifty Resistances remain at: 25116, 25251, 25317. Closing above 25317 will lead to further upside towards the next resistance levels of 25491 and 25660.
Nifty Supports remain at: 25499 (Trend line support), 24713, 24521 (Mother Line Support) and 24463. closing below 24463 can had over the gains to the Bears who can drag index down towards Father line support of 23861.
Disclaimer: The above information is provided for educational purpose, analysis and paper trading only. Please don't treat this as a buy or sell recommendation for the stock or index. The Techno-Funda analysis is based on data that is more than 3 months old. Supports and Resistances are determined by historic past peaks and Valley in the chart. Many other indicators and patterns like EMA, RSI, MACD, Volumes, Fibonacci, parallel channel etc. use historic data which is 3 months or older cyclical points. There is no guarantee they will work in future as markets are highly volatile and swings in prices are also due to macro and micro factors based on actions taken by the company as well as region and global events. Equity investment is subject to risks. I or my clients or family members might have positions in the stocks that we mention in our educational posts. We will not be responsible for any Profit or loss that may occur due to any financial decision taken based on any data provided in this message. Do consult your investment advisor before taking any financial decisions. Stop losses should be an important part of any investment in equity.
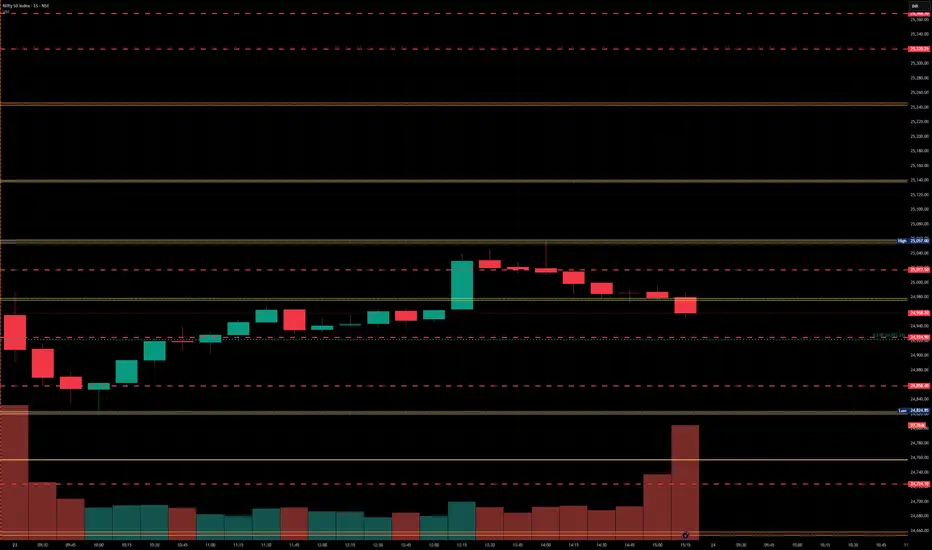
Nifty levels - Jun 25, 2025Nifty support and resistance levels are valuable tools for making informed trading decisions, specifically when combined with the analysis of 5-minute timeframe candlesticks and VWAP. By closely monitoring these levels and observing the price movements within this timeframe, traders can enhance the accuracy of their entry and exit points. It is important to bear in mind that support and resistance levels are not fixed, and they can change over time as market conditions evolve.
The dashed lines on the chart indicate the reaction levels, serving as additional points of significance to consider. Furthermore, take note of the response at the levels of the High, Low, and Close values from the day prior.
We hope you find this information beneficial in your trading endeavors.
* If you found the idea appealing, kindly tap the Boost icon located below the chart. We encourage you to share your thoughts and comments regarding it.
Wishing you success in your trading activities!
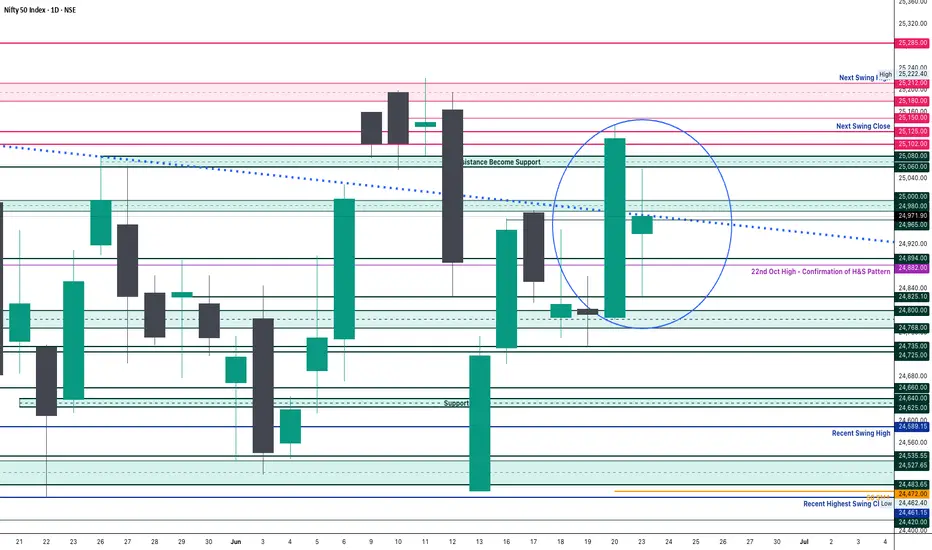
Nifty Analysis EOD – June 23, 2025 – Monday🟢 Nifty Analysis EOD – June 23, 2025 – Monday 🔴
👊 Tug of War Between Optimism and Pessimism
Nifty opened with a sharp 140-point gap-down, weighed by geopolitical tensions and negative news cues. The mood was clearly pessimistic — yet, from the deep low of 24,824.85, bulls made a bold comeback.
What followed was a classic textbook reversal:Price clawed back up, cutting through multiple key resistances — S1, VWAP, CDH, CPR BC, and Central CPR — before kissing the CPR TC, where it marked the day high at 25,057. This level acted as a supply zone and pushed Nifty back down toward the CPR BC, where it managed to close above the open — a quiet victory for the bulls, even in a red session overall.
The level 24,825 has now proven itself once again — the market’s respect for this support zone grows stronger with every bounce.
Today’s candle was a spinning top-style doji and also formed an inside bar, with all movement inside Friday’s wide-range candle (352 pts). Despite a smaller 232-point range today, this still requires caution — inside bars after large-range candles often result in false breakouts, especially amid macro noise.
📌 When the world looks bearish, and the chart looks bullish — trust your system.And that’s exactly what I did today — sticking to the Gladiator Strategy, a simple, disciplined intraday price action-based option buying framework.
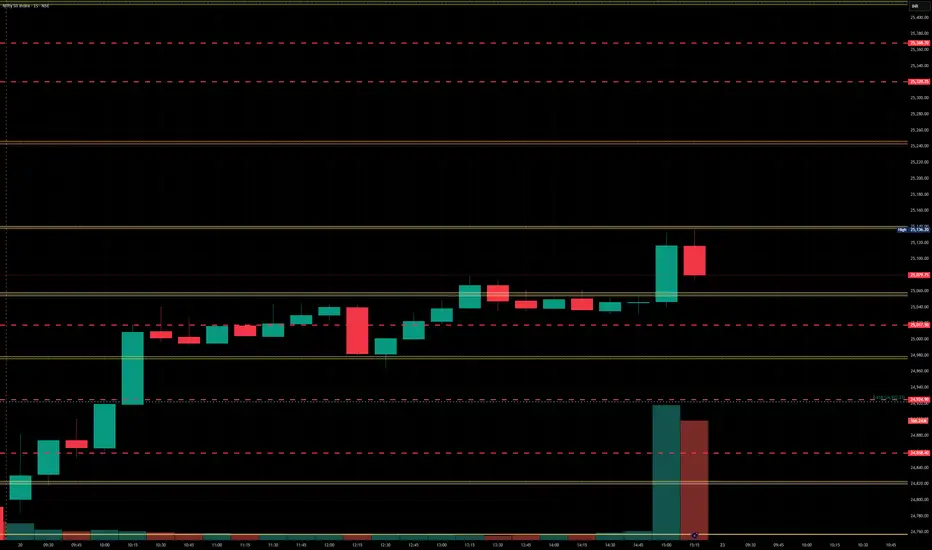
🕯 5 Min Time Frame Chart with Intraday Levels
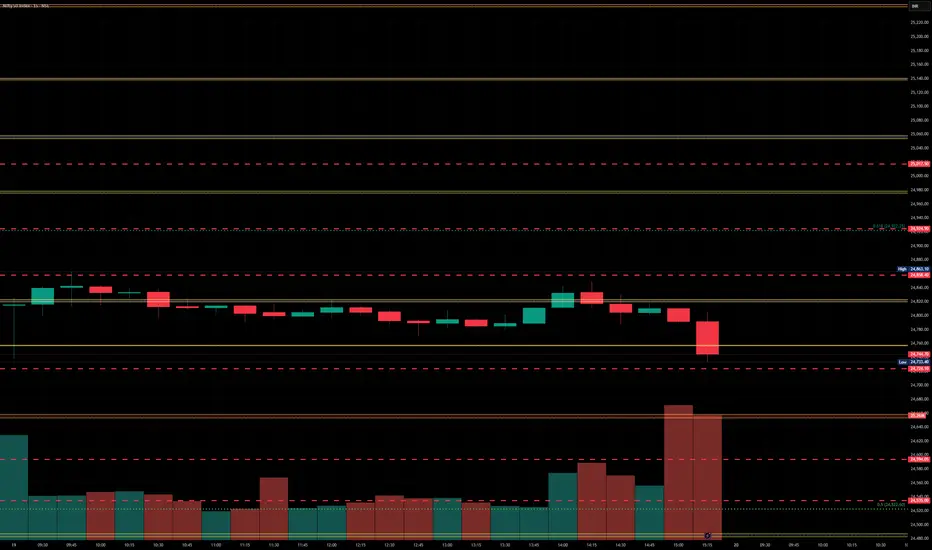
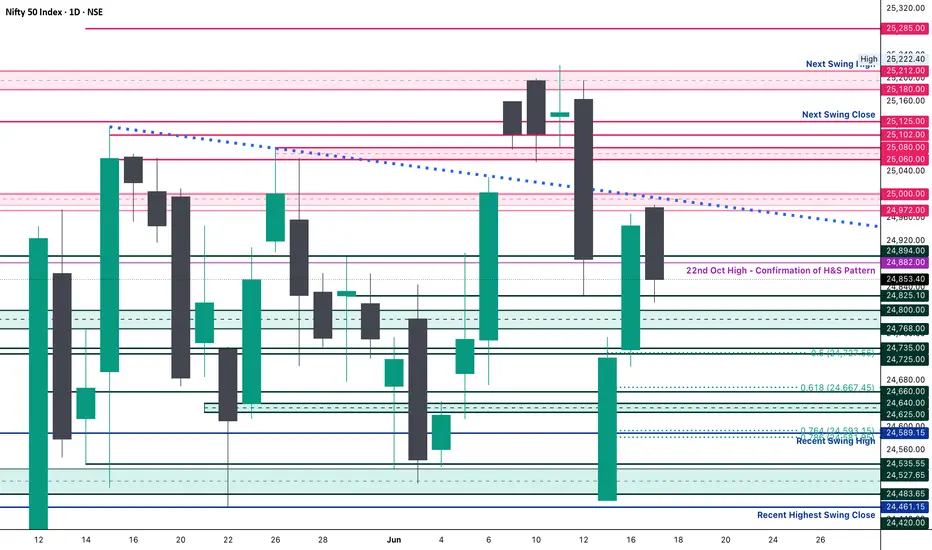
🕯 Daily Time Frame Chart with Intraday Levels
🕯 Daily Candle Breakdown
Open: 24,939.75
High: 25,057.00
Low: 24,824.85
Close: 24,971.90
Change: −140.50 (−0.56%)
📊 Candle Structure Breakdown
Real Body: 32.15 pts (small green body)
Upper Wick: 85.10 pts
Lower Wick: 114.90 pts
🔍 Interpretation
Despite a lower close than Friday, it was a green-bodied candle (close > open).
Long lower wick shows strong buying near 24,825.
Long upper wick signals resistance near 25,050–25,060.
🕯 Candle Type
📍 Spinning Top with Long Wicks — Sign of indecision, but slight bullish bias due to buying off the lows.
📌 Key Insight
Support at 24,825 holds strong.
Upper rejection near 25,050 indicates tight overhead pressure.
Watch closely:
Break above 25,060 → May trigger bullish continuation.
Break below 24,820 → Could open downside to 24,735–24,660 zone.
🛡 5 Min Intraday Chart
⚔️ Gladiator Strategy Update
ATR: 254.95
IB Range: 163.25 → Medium IB
Market Structure: ⚖️ Balanced
Trades Triggered:
🟢 10:14 AM – Long Trade → ✅ Target Achieved (Trailing Exit, R:R 1:4.51)
🔴 2:16 PM – Short Signal → ❌ Discarded (RR not favorable)
📌 Support & Resistance Zones
Resistance Levels
24,980 ~ 25,000
25,060 ~ 25,080
25,125 ~ 25,150
25,180 ~ 25,212
25,285
Support Levels
24,965
24,894 ~ 24,882
24,825
24,800 ~ 24,768
24,735 ~ 24,725
💭 Final Thoughts
Markets are currently walking a tightrope — with bearish headlines on one side and bullish price action on the other.The Gladiator approach today helped sidestep the noise and focus on what matters: price structure and clean levels.
📌 Trade the chart, not the news. And when in doubt — zoom out.
🧠 “Uncertainty is the playground of the disciplined.”
✏️ Disclaimer
This is just my personal viewpoint. Always consult your financial advisor before taking any action.
Nifty levels - Jun 24, 2025Nifty support and resistance levels are valuable tools for making informed trading decisions, specifically when combined with the analysis of 5-minute timeframe candlesticks and VWAP. By closely monitoring these levels and observing the price movements within this timeframe, traders can enhance the accuracy of their entry and exit points. It is important to bear in mind that support and resistance levels are not fixed, and they can change over time as market conditions evolve.
The dashed lines on the chart indicate the reaction levels, serving as additional points of significance to consider. Furthermore, take note of the response at the levels of the High, Low, and Close values from the day prior.
We hope you find this information beneficial in your trading endeavors.
* If you found the idea appealing, kindly tap the Boost icon located below the chart. We encourage you to share your thoughts and comments regarding it.
Wishing you success in your trading activities!
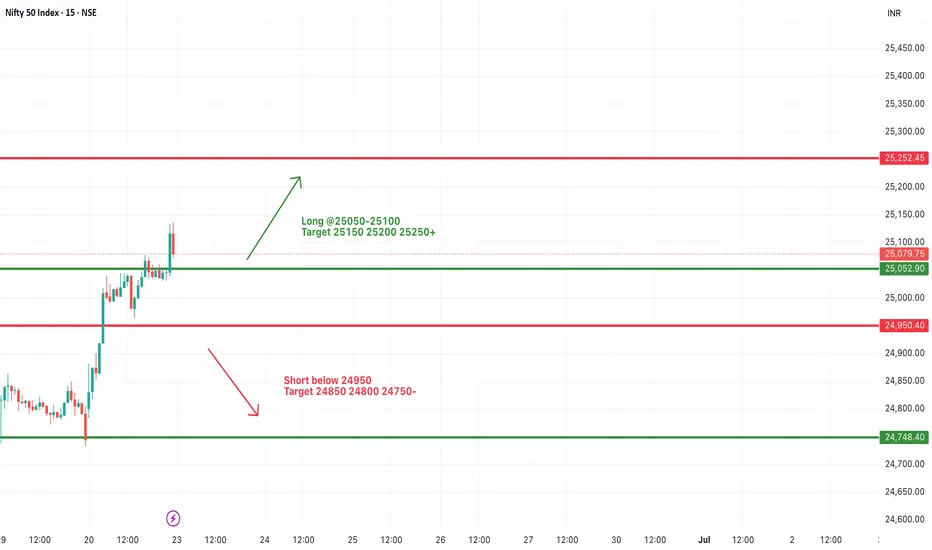
#NIFTY Intraday Support and Resistance Levels - 23/06/2025A flat opening is expected in Nifty today. If Nifty sustains above the 25,050–25,100 zone after the open, we can expect an upside rally toward 25,150 → 25,200 → 25,250+ levels. This bullish momentum may continue if Nifty remains strong above 25,100.
However, any downside momentum may begin if Nifty starts trading below 24,950, which is a crucial support zone. In such a scenario, the index could slip toward 24,850 → 24,800 → 24,750- levels.
For intraday trades, focus on breakout or breakdown levels, and manage risk with trailing stop-losses in place.
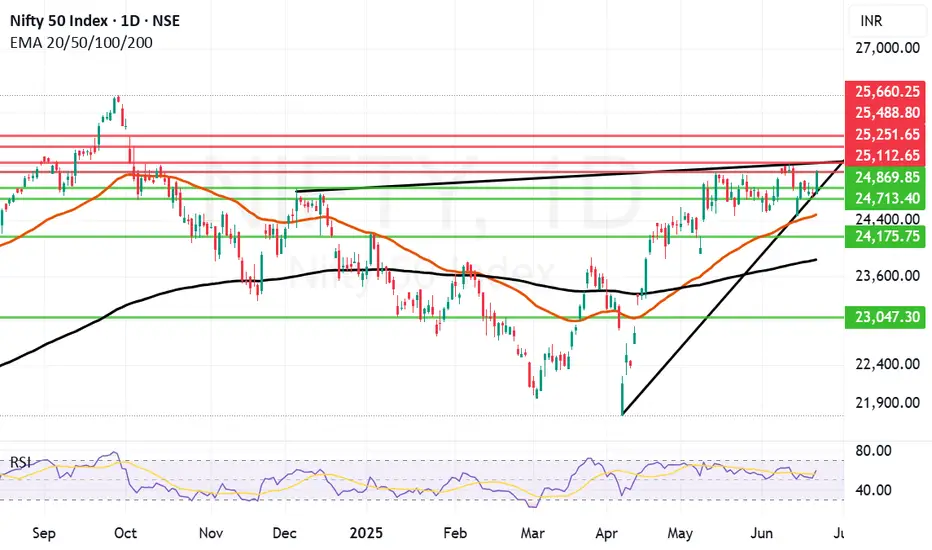
Great recovery by Nifty to end the week. Nifty has shown a great recovery to end the week at 25112 despite persisting global uncertainties. This again shows imminent strength of Indian markets and confidence on the local factors by Bulls.
Nifty however is now entering a tough resistance zone which starts exactly from 25113 and extends till 25251. Once we get a closing above 25251 the Bulls will try to control the market with more strength. Till that happens it can still go in any direction. The supports for Nifty remain at 24869, 24713, 24480 (Mother line support), 24175 and finally 23838 (Father line support).
If any major further global escalation happens during the weekend and we get a closing below 23838 then Bears can become more powerful and they might have potential to push market further down towards 23047 or below.
Things hang in balance despite a strong closing on Friday as the shadow of the candle is still neutral.
Disclaimer: The above information is provided for educational purpose, analysis and paper trading only. Please don't treat this as a buy or sell recommendation for the stock or index. The Techno-Funda analysis is based on data that is more than 3 months old. Supports and Resistances are determined by historic past peaks and Valley in the chart. Many other indicators and patterns like EMA, RSI, MACD, Volumes, Fibonacci, parallel channel etc. use historic data which is 3 months or older cyclical points. There is no guarantee they will work in future as markets are highly volatile and swings in prices are also due to macro and micro factors based on actions taken by the company as well as region and global events. Equity investment is subject to risks. I or my clients or family members might have positions in the stocks that we mention in our educational posts. We will not be responsible for any Profit or loss that may occur due to any financial decision taken based on any data provided in this message. Do consult your investment advisor before taking any financial decisions. Stop losses should be an important part of any investment in equity.
Nifty levels - Jun 23, 2025Nifty support and resistance levels are valuable tools for making informed trading decisions, specifically when combined with the analysis of 5-minute timeframe candlesticks and VWAP. By closely monitoring these levels and observing the price movements within this timeframe, traders can enhance the accuracy of their entry and exit points. It is important to bear in mind that support and resistance levels are not fixed, and they can change over time as market conditions evolve.
The dashed lines on the chart indicate the reaction levels, serving as additional points of significance to consider. Furthermore, take note of the response at the levels of the High, Low, and Close values from the day prior.
We hope you find this information beneficial in your trading endeavors.
* If you found the idea appealing, kindly tap the Boost icon located below the chart. We encourage you to share your thoughts and comments regarding it.
Wishing you success in your trading activities!
Nifty Analysis EOD – June 19, 2025 – Thursday🟢 Nifty Analysis EOD – June 19, 2025 – Thursday 🔴
📉 Bookish Spinning Top Doji – Another Day of Indecision on Expiry
Nifty opened with a mild +16-point gap-up and immediately dipped to test the Previous Day Low (PDL), marking the day low at 24,738.10. A quick reversal took the index 125 points higher, reaching a high of 24,863, only to settle back into theta-eating mode around VWAP.
Just as things looked ready to turn, a 13:50 breakout attempt fizzled as the price faced rejection above the CPR zone, leading to a final dip below the previous low, touching a new intraday low at 24,733.
Though the intraday close was at 24,744.70, the settlement close was 24,793.25 — a 47.65-point difference that’s not trivial, especially on expiry day.
The entire day remained a narrow-range, rollercoaster ride — clearly showing neither bulls nor bears could take charge. The total range was just 130 points, forming a textbook Spinning Top, which reflects market contraction.
📌 Now what?
Keep a close eye on the range:
🟢Bullish Breakout ➤ above 24,862 (CDH)
🔴Bearish Breakdown ➤ below 24,733 (CDL)
The squeeze is on. Expansion is near.
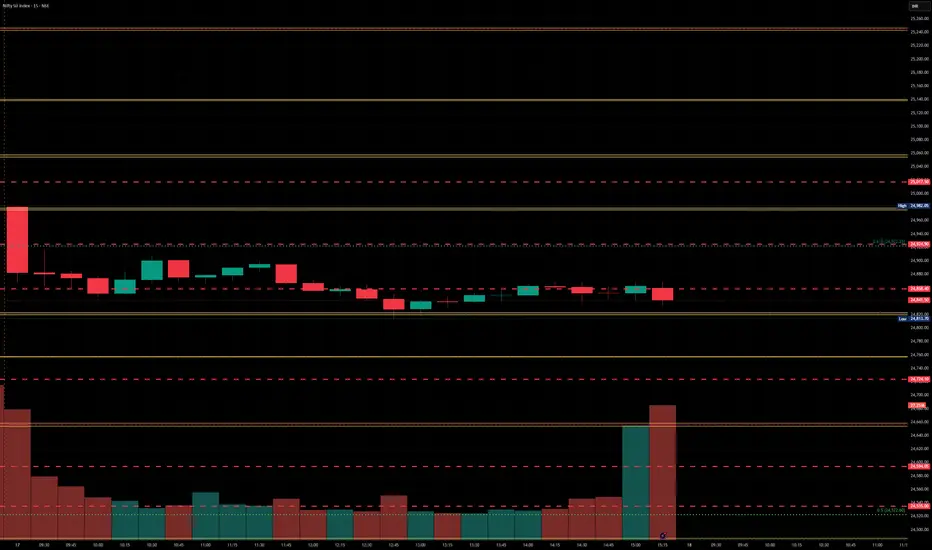
🕯 5 Min Time Frame Chart with Levels
🕯 Daily Time Frame Chart
🕯 Daily Candle Breakdown
Open: 24,803.25
High: 24,863.10
Low: 24,733.40
Close: 24,793.25
Change: −18.80 (−0.08%)
📊 Candle Structure Breakdown
Real Body: 10.00 pts → 🔻 Small Red Candle
Upper Wick: 59.85 pts
Lower Wick: 59.85 pts
🔍 Interpretation
Equal wicks show balanced buying and selling.
Small real body signals strong indecision.
Intraday volatility was neutral despite expiry impact.
🕯 Candle Type
⚖️ Perfect Spinning Top / Doji-like Candle – Indicates market contraction, waiting for directional resolution.
📌 Key Insight
The market continues its tight range-bound structure.
Any breakout beyond 24,865 or breakdown below 24,730 could trigger directional moves.
Till then: “Wait and watch mode.”
🛡 5 Min Intraday Chart
⚔️ Gladiator Strategy Update
ATR: 240.08
IB Range: 125.00 → Medium IB
Market Structure: ⚖️ Balanced
Trades:🚫 No Trade Triggered by System
📌 Support & Resistance Zones
Resistance Levels
24,894 ~ 24,882
24,972 ~ 25,000
25,060 ~ 25,080
25,102 ~ 25,125
Support Levels
24,825 ~ 24,847
24,725 ~ 24,735
24,660
24,590
💭 Final Thoughts
The market is compressing like a coiled spring.Spinning tops near resistance often signal upcoming volatility.Let the breakout come to you — don’t pre-empt, participate.
🧠 “When the market sleeps in narrow ranges, it dreams of big moves.”
✏️ Disclaimer
This is just my personal viewpoint. Always consult your financial advisor before taking any action.

Nifty levels - Jun 20, 2025Nifty support and resistance levels are valuable tools for making informed trading decisions, specifically when combined with the analysis of 5-minute timeframe candlesticks and VWAP. By closely monitoring these levels and observing the price movements within this timeframe, traders can enhance the accuracy of their entry and exit points. It is important to bear in mind that support and resistance levels are not fixed, and they can change over time as market conditions evolve.
The dashed lines on the chart indicate the reaction levels, serving as additional points of significance to consider. Furthermore, take note of the response at the levels of the High, Low, and Close values from the day prior.
We hope you find this information beneficial in your trading endeavors.
* If you found the idea appealing, kindly tap the Boost icon located below the chart. We encourage you to share your thoughts and comments regarding it.
Wishing you success in your trading activities!
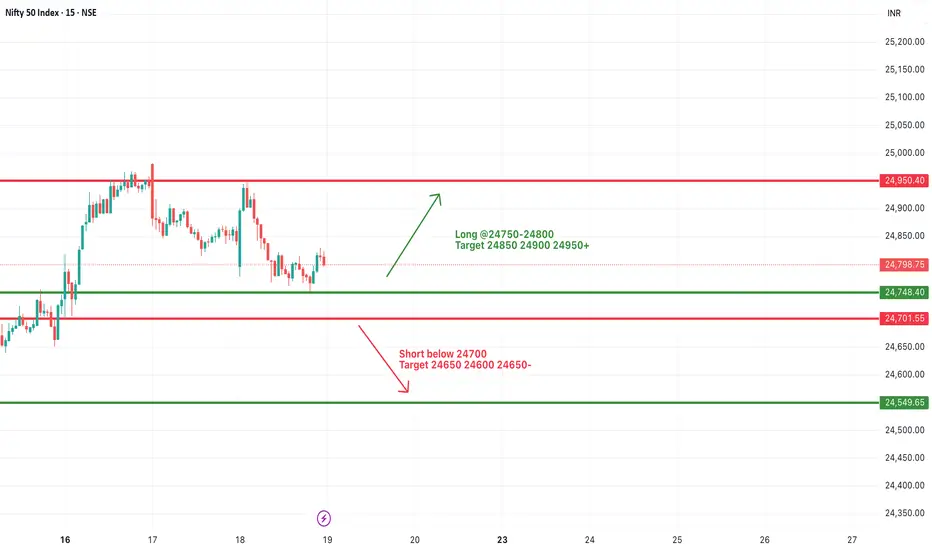
#NIFTY Intraday Support and Resistance Levels - 19/06/2025Today, a flat opening is expected in Nifty around the 24,800 level. The index continues to trade within a narrow range, indicating market indecision and potential consolidation.
🔼 On the upside, if Nifty sustains above the 24,750–24,800 zone, it may trigger a bullish move toward 24,850 → 24,900 → 24,950+. Sustained strength above 24,950 can further open room for a breakout.
🔽 On the downside, if the index slips below 24,700, a short opportunity may arise toward 24,650 → 24,600 → 24,550-. Breach of 24,550 could lead to deeper correction.
⚠️ Key Notes:
The market is likely to remain range-bound and volatile.
Reversals from resistance and support levels are possible.
Trade with a strict stop loss and manage positions actively.
Nifty levels - Jun 19, 2025Nifty support and resistance levels are valuable tools for making informed trading decisions, specifically when combined with the analysis of 5-minute timeframe candlesticks and VWAP. By closely monitoring these levels and observing the price movements within this timeframe, traders can enhance the accuracy of their entry and exit points. It is important to bear in mind that support and resistance levels are not fixed, and they can change over time as market conditions evolve.
The dashed lines on the chart indicate the reaction levels, serving as additional points of significance to consider. Furthermore, take note of the response at the levels of the High, Low, and Close values from the day prior.
We hope you find this information beneficial in your trading endeavors.
* If you found the idea appealing, kindly tap the Boost icon located below the chart. We encourage you to share your thoughts and comments regarding it.
Wishing you success in your trading activities!

Nifty Analysis EOD – June 17, 2025 – Tuesday🟢 Nifty Analysis EOD – June 17, 2025 – Tuesday 🔴
⚠️ Resistance Rejection at 25K – Pause or Warning Sign?
Yesterday’s note rightly anticipated today’s challenge near 25K — and that’s exactly how the session unfolded.
Nifty opened at 24,977.85, right inside the critical resistance zone of 24,972–25,000, and formed a near O=H (Open = High) structure. The index quickly lost ground, dropping 135 points within the first hour to mark a day low of 24,813.70, forming a medium-sized Initial Balance (IB) within a wide CPR — conditions known for range-bound or tricky days.
Throughout the session, Nifty hovered largely inside the CPR and IB, with a false breakdown attempt around 12:50 PM. Such setups (wide CPR + higher value + medium IB) often result in false moves or low-conviction sessions, and today was no exception.
By day’s end, Nifty closed at 24,853.40, logging a modest −93.10 point dip, forming what can be termed as a healthy pullback — but the real test remains.
If bulls want to take charge again, they must breach and close above 25,025. On the flip side, if 24,800–24,820 gives way, it could trigger a slide toward 24,725 and 24,660 in the coming sessions.
🕯 Daily Time Frame Chart
🕯 Daily Candle Breakdown
Open: 24,977.85
High: 24,982.05
Low: 24,813.70
Close: 24,853.40
Change: −93.10 (−0.37%)
📊 Candle Structure Breakdown
Real Body: 124.45 pts → 🔻 Red Candle
Upper Wick: 4.20 pts
Lower Wick: 39.70 pts
🔍 Interpretation
Opened near the day’s high but selling dominated soon after.
Small upper wick shows minimal buyer strength; recovery attempts were mild.
Lower wick indicates some support emerged at day’s low, but overall tone remained bearish.
🕯 Candle Type
🟥 Bearish Candle – strong real body, minor lower wick — reflects steady intraday selling, though not overly aggressive.
📌 Key Insight
Nifty has now rejected the 25K zone two days in a row, turning it into short-term resistance.
If 24,800 breaks, expect pressure to mount — next watch: 24,725 → 24,660.
Bulls need a close above 25,025 to regain command.
🛡 5 Min Intraday Chart
⚔️ Gladiator Strategy Update
ATR: 258.48
IB Range: 131.60 → Medium IB
Market Structure: ⚖️ Balanced
Trades:🚫 No Trade Triggered by System
📌 Support & Resistance Zones
Resistance Levels
24,894 ~ 24,882
24,972 ~ 25,000
25,060 ~ 25,080
25,102 ~ 25,125
Support Levels
24,825 ~ 24,847
24,725 ~ 24,735
24,660
24,590
💭 Final Thoughts
Today’s session didn’t break anything major — but it also didn’t conquer anything new.Stuck between major support and resistance, the index is coiling for a move. Bulls have the burden of proof now.
🧠 “Markets don’t pause forever — compression leads to expansion. Be ready when it chooses its direction.”
✏️ Disclaimer
This is just my personal viewpoint. Always consult your financial advisor before taking any action.
Resistance zones and Geo-political instability acting up.Geo-Political instability and resistance zone are acting up together to stop Nifty and not allowing it to close above 25K. As the world is looking at developments in Iran Vs Israel conflict with beated heart market today gave up some gains from yesterday. The only index looking strong is IT index right now. Avoid taking very long positions unless you are very sure of the company. Yesterday also Nifty failed to close above 25K opened briefly near 25K today and then moved downwards. Lot will be decided in the short term by the developments that happen tonight. Important G7 meet and US Federal reserve Rate Cut meet is also to happen later in the week. These 2 global factors will decide fate of the market in the short term. Local factors are all in line and nothing to worry for Indian markets on that front.
The supports for Nifty remain at: 24713 (Trend line support), 24425 (Mother line support of Daily chart), next support is near 23917, 23806 (Father line support of daily chart is in place). Closing below 23906 can lead to further down side and in such a scenario Nifty can fall further towards 23500 or 23047 levels. If we get a closing below that we will give updates regarding the same.
Resistances for Nifty remain at: 24982 (Today's high), 25112 and trend line resistance of 25251. When we get a closing above 25251 we will update you regarding the further upward resistnace levels.
Disclaimer: The above information is provided for educational purpose, analysis and paper trading only. Please don't treat this as a buy or sell recommendation for the stock or index. The Techno-Funda analysis is based on data that is more than 3 months old. Supports and Resistances are determined by historic past peaks and Valley in the chart. Many other indicators and patterns like EMA, RSI, MACD, Volumes, Fibonacci, parallel channel etc. use historic data which is 3 months or older cyclical points. There is no guarantee they will work in future as markets are highly volatile and swings in prices are also due to macro and micro factors based on actions taken by the company as well as region and global events. Equity investment is subject to risks. I or my clients or family members might have positions in the stocks that we mention in our educational posts. We will not be responsible for any Profit or loss that may occur due to any financial decision taken based on any data provided in this message. Do consult your investment advisor before taking any financial decisions. Stop losses should be an important part of any investment in equity.
Nifty levels - Jun 18, 2025Nifty support and resistance levels are valuable tools for making informed trading decisions, specifically when combined with the analysis of 5-minute timeframe candlesticks and VWAP. By closely monitoring these levels and observing the price movements within this timeframe, traders can enhance the accuracy of their entry and exit points. It is important to bear in mind that support and resistance levels are not fixed, and they can change over time as market conditions evolve.
The dashed lines on the chart indicate the reaction levels, serving as additional points of significance to consider. Furthermore, take note of the response at the levels of the High, Low, and Close values from the day prior.
We hope you find this information beneficial in your trading endeavors.
* If you found the idea appealing, kindly tap the Boost icon located below the chart. We encourage you to share your thoughts and comments regarding it.
Wishing you success in your trading activities!
#NIFTY Intraday Support and Resistance Levels - 17/06/2025Today, a flat opening is expected in Nifty near the 24,950 level. The index has been moving in a narrow consolidation zone and currently trades just below an important resistance. If Nifty manages to sustain above the 25,050–25,100 zone after the opening, we may witness bullish momentum building up. This could lead to an upward move toward 25,150, 25,200, and possibly 25,250+ levels during the day.
However, if Nifty fails to hold above the 24,950 mark and slips into weakness, it may invite intraday profit booking. A drop below the 24,900–24,950 level could open the downside toward 24,850, 24,800, and 24,750 levels. This zone has previously acted as a support range, and any break here could intensify selling pressure.
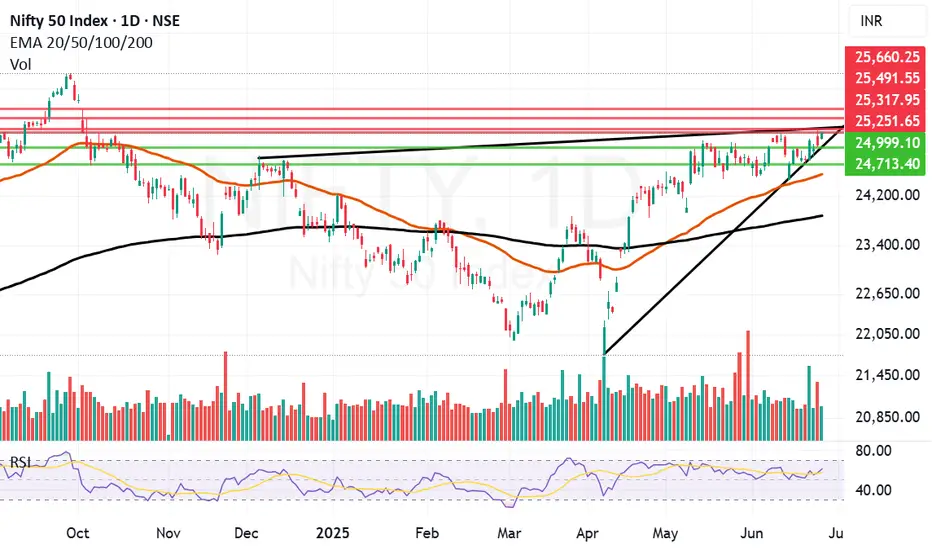
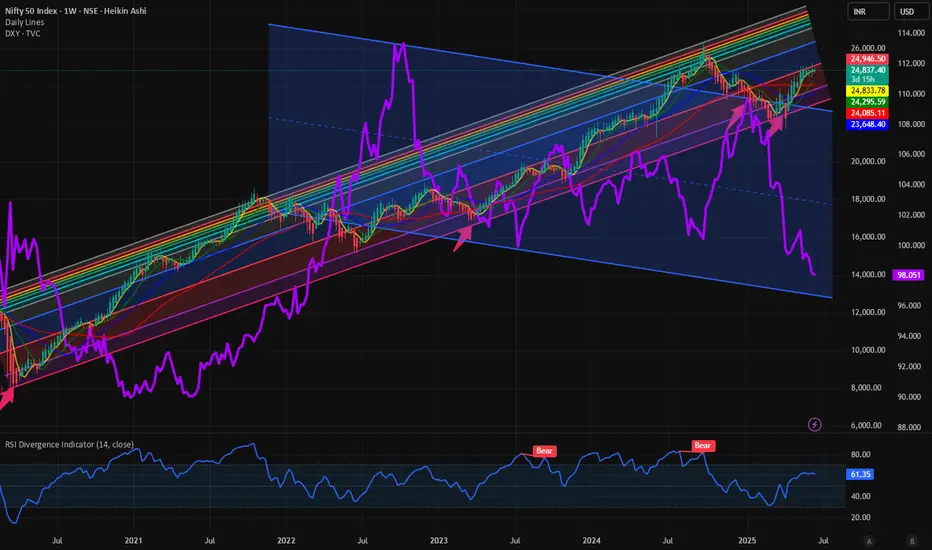
$DXY weakness and EM markets: $NIFTY more upside? The recent weakness in TVC:DXY is well documented. We have analyzed it here in detail in our blogs. This weakness is giving wings to all kinds of risk assets including Ems. One of our favorite EM in this space has been India and NSE:NIFTY index for quiet some time. It is the only EM which is close to beating S&P 500 over the last 5-year period. We have been recently bullish at NSE:NIFTY and published new targets on June 6. Please check the post in the link here.
NSE:NIFTY : New highs incoming; 27500 can be cycle highs for NSE:NIFTY by RabishankarBiswal — TradingView
The road to the medium-term target of 27500 on NSE:NIFTY has to do with the weakness of $DXY. As we see, lower lows and lower highs in the Dollar index TVC:DXY provides the required boost to risky assets like Stocks, Crypto and EMs. Even if we have some recent choppiness in the market the upward momentum will continue. By the end of July, we might see TVC:DXY at 96 up 2.5% and NSE:NIFTY @ 26000 up 5%.
Verdict : Pair Trade : Short TVC:DXY to 96 and Long NSE:NIFTY to 26000.
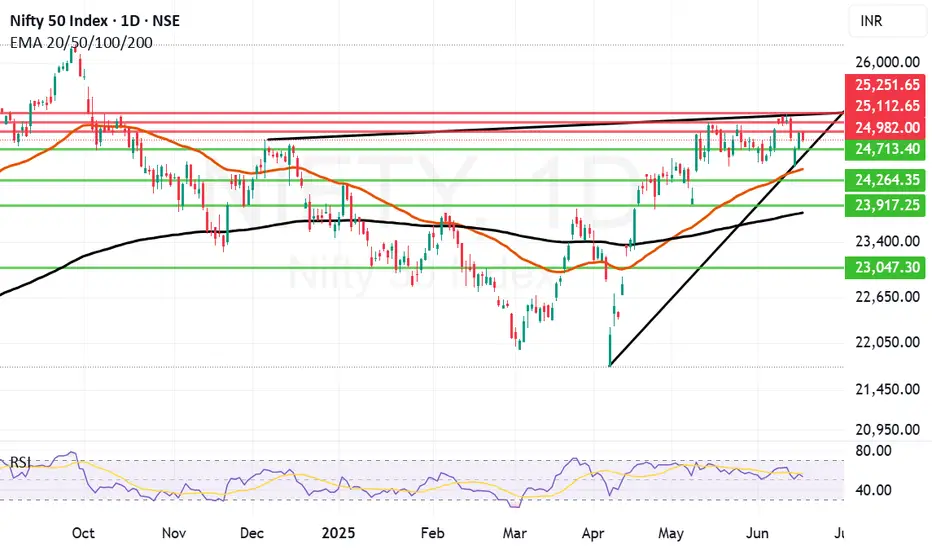
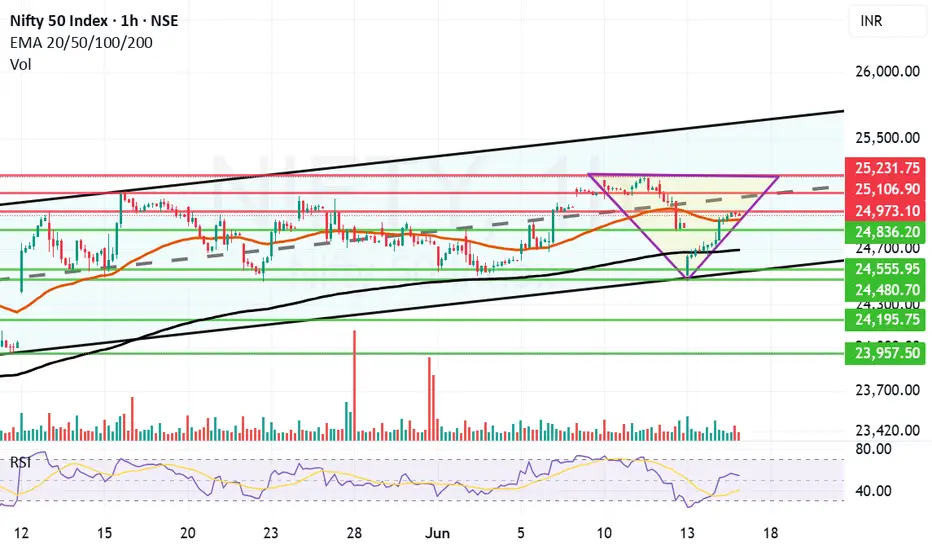
Solid V Shaped recovery within the Parallel channel for NiftyNifty recovered sharply within the parallel channel. The reasons that can be attributed are inherent strength in the Indian market and swift recovery in IT, Infra, Metal, commodities, Realty, Mid and Small cap browsers. The closing of Nifty was at 24946 which is just above the mother line which is at 24908. The same mother line provided the support to Nifty in the last few hours of trade when there was some intraday profit booking pressure.
Nifty Supports remain at: 24908 (Mother line Support), 24836, 24690 (Father Line Support), 24555 (Channel Bottom Support) and 24480 recent low. Below 24880 Nifty will be very weak and Bears in that scenario can drag Nifty further down to 24195 or 23957. These are the levels as of now. If we go below these levels in unlikely circumstances we will update the levels once we get there.
Nifty Resistances remain at: 24973, 25106 (Mid Channel Resistance) and 25231.Once we close above 25231 we will update further levels.
Disclaimer: The above information is provided for educational purpose, analysis and paper trading only. Please don't treat this as a buy or sell recommendation for the stock or index. The Techno-Funda analysis is based on data that is more than 3 months old. Supports and Resistances are determined by historic past peaks and Valley in the chart. Many other indicators and patterns like EMA, RSI, MACD, Volumes, Fibonacci, parallel channel etc. use historic data which is 3 months or older cyclical points. There is no guarantee they will work in future as markets are highly volatile and swings in prices are also due to macro and micro factors based on actions taken by the company as well as region and global events. Equity investment is subject to risks. I or my clients or family members might have positions in the stocks that we mention in our educational posts. We will not be responsible for any Profit or loss that may occur due to any financial decision taken based on any data provided in this message. Do consult your investment advisor before taking any financial decisions. Stop losses should be an important part of any investment in equity.
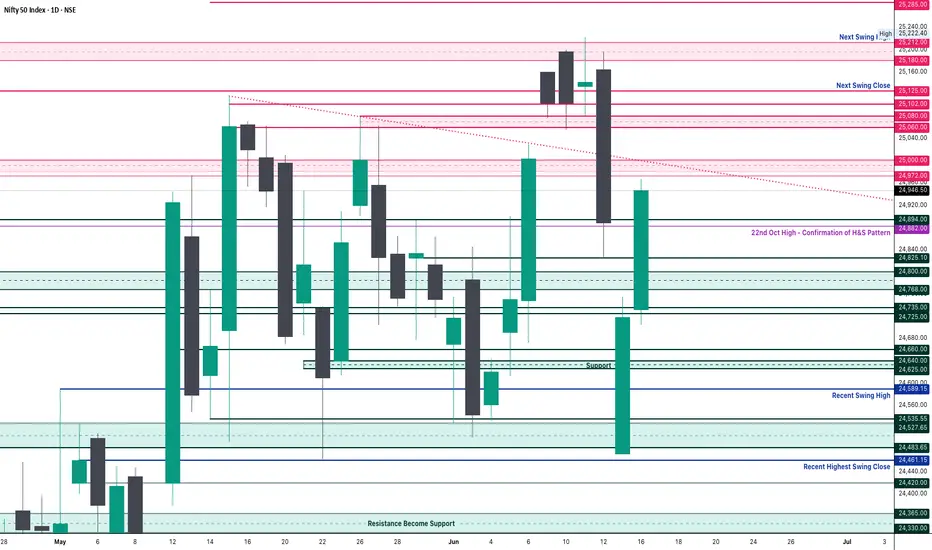
Nifty Analysis EOD – June 16, 2025 – Monday🟢 Nifty Analysis EOD – June 16, 2025 – Monday 🔴
📈 Expected Follow-Through Plays Out – Bulls Eye 25K Hurdle Next
Nifty opened flat-to-positive at 24,737, briefly dipped to the day’s low of 24,703.60, and then reversed smartly to touch an intraday high of 24,967.10 by 13:40. After that, the index spent the rest of the day consolidating in a narrow 40-point band and closed at 24,940.95 intraday (adjusted close: 24,946.50), delivering a solid +227.90 point gain.
As anticipated, the 24,768–24,800 support zone provided the launchpad for further upside, confirming the bullish follow-up from Friday's recovery. The rally tested 24,967, just shy of the crucial resistance at 24,972, which remains a key watch for the next session.
🔍 However, going forward, the bulls face major challenges around 25,000–25,080. This zone has acted as a hurdle in the past and could either stall the rally or serve as a breakout trigger. Watch price behavior carefully around these levels to assess conviction.
🛡 5 Min Chart with Levels
🕯 Daily Time Frame Chart
🕯 Daily Candle Breakdown
Open: 24,732.35
High: 24,967.10
Low: 24,703.60
Close: 24,946.50
Change: +227.90 (+0.92%)
📊 Candle Structure Breakdown
Real Body: 214.15 pts → 🟢 Strong Green Candle
Upper Wick: 20.60 pts
Lower Wick: 28.75 pts
🔍 Interpretation
Opened near day’s low, closed near day’s high — classic bullish sentiment.
Small wicks show controlled buying with minimal resistance and shakeouts.
Reinforces the bulls’ momentum after Friday’s OL recovery candle.
🔦 Candle Type
💚 Bullish Marubozu–type / Bullish Continuation Candle– Often found during the middle leg of a bullish swing, signaling strong trend momentum.
📌 Key Insight
Today's price action confirmed continuation of the recovery.
Close above 24,950–25,000 in the next session could ignite fresh upside.
Rejection around 25,060–25,080 would indicate caution — stay nimble.
🛡 5 Min Intraday Chart
⚔️ Gladiator Strategy Update
ATR: 268.49
IB Range: 114.05 → Medium IB
Market Structure: ⚖️ Unbalanced
Trades:
✅ 10:20 AM – Long Triggered → Target Achieved, Trailing SL Hit (RR: 1:3.28)
📌 Support & Resistance Zones
Resistance Levels
24,972 ~ 25,000
25,060 ~ 25,080
25,102 ~ 25,125
Support Levels
24,894 ~ 24,882
24,825 ~ 24,847
24,725 ~ 24,735
24,660
💭 Final Thoughts
The market played exactly as mapped — now it’s about decision time near 25K. Will the bulls charge ahead or pause? Either way, the structure favors short-term bullishness — but profit booking pressure near resistance must be expected.
🧠 “Momentum is a gift – but without volume and conviction, it fades at resistance.”
✏️ Disclaimer
This is just my personal viewpoint. Always consult your financial advisor before taking any action.
Nifty levels - Jun 17, 2025Nifty support and resistance levels are valuable tools for making informed trading decisions, specifically when combined with the analysis of 5-minute timeframe candlesticks and VWAP. By closely monitoring these levels and observing the price movements within this timeframe, traders can enhance the accuracy of their entry and exit points. It is important to bear in mind that support and resistance levels are not fixed, and they can change over time as market conditions evolve.
The dashed lines on the chart indicate the reaction levels, serving as additional points of significance to consider. Furthermore, take note of the response at the levels of the High, Low, and Close values from the day prior.
We hope you find this information beneficial in your trading endeavors.
* If you found the idea appealing, kindly tap the Boost icon located below the chart. We encourage you to share your thoughts and comments regarding it.
Wishing you success in your trading activities!
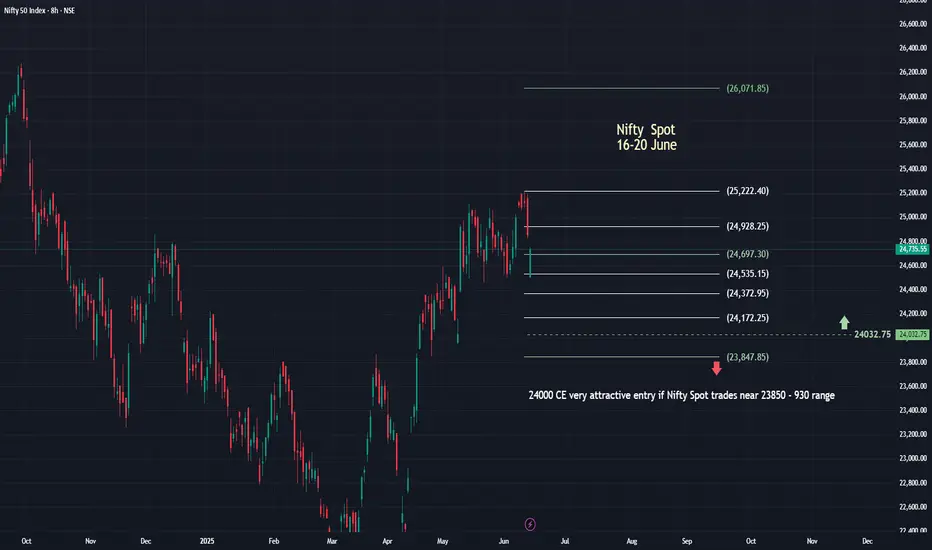
NIfty SpotVery good resilience shown by Indian Markets amid Global uncertainty.
Iran - Israel war will surely have an impact on opening of the markets tomorrow..
The way the war is continuing all likely hood of opening deep red...tomorrow
Well but i feel taht will be a good opportunity to buy near 24000-23850 Zone... as it is also a previous GAP so all possibility of finding suppport near that level
Have marked important level on chart.
Like... Share... Comment.