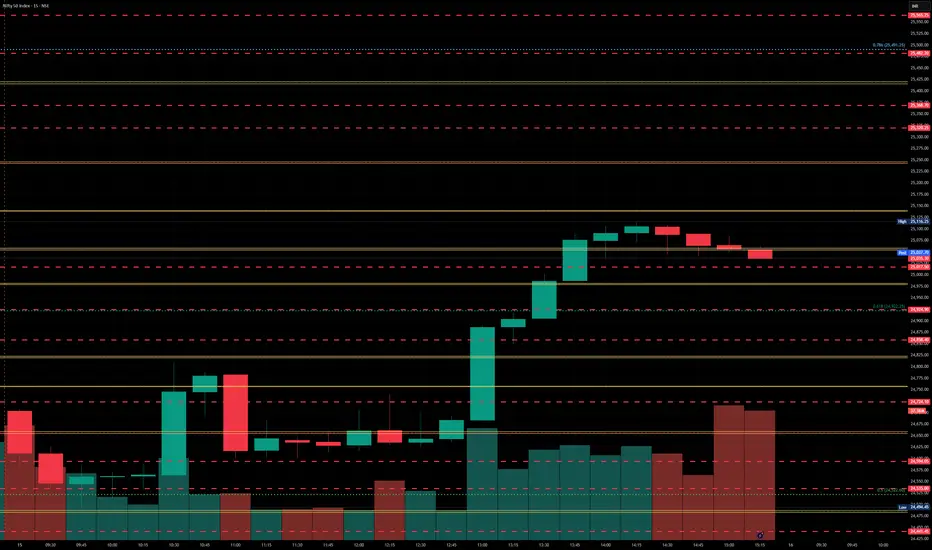
Nifty levels - May 16, 2025Nifty support and resistance levels are valuable tools for making informed trading decisions, specifically when combined with the analysis of 5-minute timeframe candlesticks and VWAP. By closely monitoring these levels and observing the price movements within this timeframe, traders can enhance the accuracy of their entry and exit points. It is important to bear in mind that support and resistance levels are not fixed, and they can change over time as market conditions evolve.
The dashed lines on the chart indicate the reaction levels, serving as additional points of significance to consider. Furthermore, take note of the response at the levels of the High, Low, and Close values from the day prior.
We hope you find this information beneficial in your trading endeavors.
* If you found the idea appealing, kindly tap the Boost icon located below the chart. We encourage you to share your thoughts and comments regarding it.
Wishing you success in your trading activities!
Niftylevels
Volatile day where Mother line gave support to NiftyIt was a volatile day on browsers where Mother line of hourly chart gave support to Nifty and helped it close in Green. after opening in Green Nifty and making a high of 24767 Nifty saw selling pressure which took it to as low as 24535 losing over 232 points. There Nifty found the support of Mother line and rose 141 points closing at 24666 which is 88 points hig from yesterdays close. Further volatility cant be ruled out as Nifty is facing the resistance of the trend line at 24684. If this level is crossed Nifty can find further resistance at 24852 and 25012. 25012 seems to be a Channel top resistance which will be little difficult to cross. Supports for Nifty remain at 24505 (Mother Line Support), 24374, 24165 and 23979 (Father Line Support). If Father line support is broken by chance bears can drag Nifty further down to 23786 levels. Around this zone we will also have mid channel support of the parallel channel. Thigs are delicately poised with positive shadow of the candle.
Disclaimer: The above information is provided for educational purpose, analysis and paper trading only. Please don't treat this as a buy or sell recommendation for the stock or index. The Techno-Funda analysis is based on data that is more than 3 months old. Supports and Resistances are determined by historic past peaks and Valley in the chart. Many other indicators and patterns like EMA, RSI, MACD, Volumes, Fibonacci, parallel channel etc. use historic data which is 3 months or older cyclical points. There is no guarantee they will work in future as markets are highly volatile and swings in prices are also due to macro and micro factors based on actions taken by the company as well as region and global events. Equity investment is subject to risks. I or my clients or family members might have positions in the stocks that we mention in our educational posts. We will not be responsible for any Profit or loss that may occur due to any financial decision taken based on any data provided in this message. Do consult your investment advisor before taking any financial decisions. Stop losses should be an important part of any investment in equity.

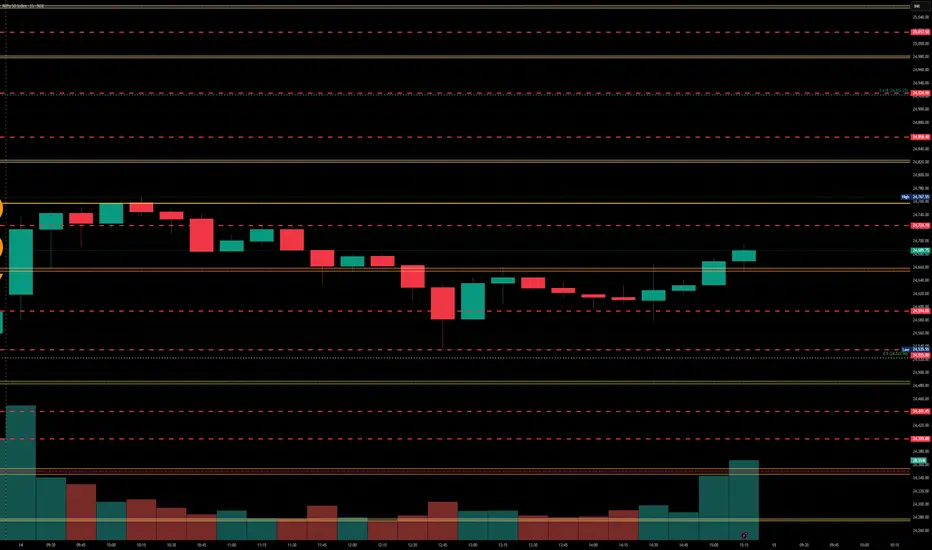
Nifty levels - May 15, 2025Nifty support and resistance levels are valuable tools for making informed trading decisions, specifically when combined with the analysis of 5-minute timeframe candlesticks and VWAP. By closely monitoring these levels and observing the price movements within this timeframe, traders can enhance the accuracy of their entry and exit points. It is important to bear in mind that support and resistance levels are not fixed, and they can change over time as market conditions evolve.
The dashed lines on the chart indicate the reaction levels, serving as additional points of significance to consider. Furthermore, take note of the response at the levels of the High, Low, and Close values from the day prior.
We hope you find this information beneficial in your trading endeavors.
* If you found the idea appealing, kindly tap the Boost icon located below the chart. We encourage you to share your thoughts and comments regarding it.
Wishing you success in your trading activities!
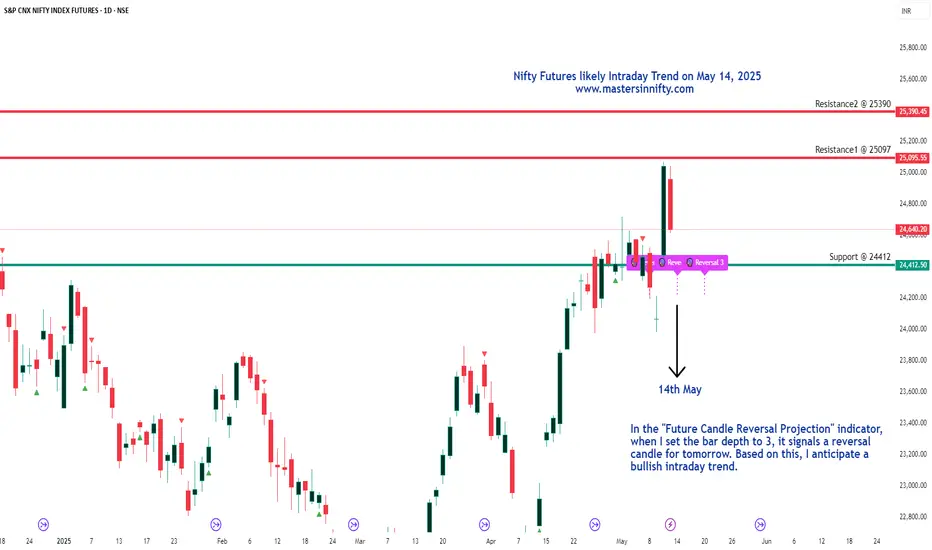
Nifty Futures likely Intraday Trend on May 14, 2025I foresee a bullish intraday trend with support at 24412 and resistance level1 @ 25097 and resistance 2 @ 25390.
I have not considered gaps on the either direction. This is just my view and the levels in the real-time may vary due to gaps.
Traders are advised to do own technical studies and trade with proper stop-loss.
Nifty Analysis EOD - May 13, 2025 - Tuesday🟢 Nifty Analysis EOD - May 13, 2025 - Tuesday 🔴
Is it Retracement or Breakout Failed?
🔍 Nifty Summary
Nifty opened with a mild gap-down of 35 points and within the first 20 minutes, it sliced through multiple supports — Previous Day Close, 24,882, 24,801–24,768, and even 24,730 — in what looked like a determined breakdown. However, the follow-up was missing. Instead of extending lower, the index hovered indecisively near the CPR until 12:30 PM.
Post-lunch, a breakout attempt did arrive — but momentum was lukewarm. Both sides saw significant premium erosion, making it a tough day for option buyers.
Despite the early pressure, Nifty closed at 24,578 (-57 pts) — a mild negative close, but interestingly near multiple fib supports and recent swing zones, hinting at absorption.
🕵️ Intraday Walk
🔽 Broke PDC → 24,882 → 24,801–24,768 → 24,730 within 20 minutes.
🌀 Stuck inside CPR zone until 12:30 PM – volatility without trend.
📈 Breakout attempt post-lunch lacked strength.
💸 Both calls and puts decayed heavily – option writers ruled.
🧭 75-Min Chart Analysis / Zone Commentary
Market flirted with imbalance in the morning, but later balanced out, forming a neutral structure.
The rejection of deeper downside and close near key fibs point to a pause more than a trend.
🔍 Key Observations:
✅ Closed near recent swing high at 24,589
✅ Near 0.382 Fib retracement from the previous close (24,587)
✅ Near 0.618 Fib from the prior session (24,595)
❌ No follow-through after support breaks
❌ Momentum faded quickly after the breakout attempt
📌 Implication:
The market shows signs of absorption near support zones but lacks strength for a reversal — neutral to slightly bullish bias, but still cautious.
🛡 Gladiator Strategy Update
Strategy Parameters
ATR: 362.82
IB Range: 298.2 → 📏 Large IB
Market Structure: ⚖️ Balanced
Trade Highlights
📈 Long Trigger @ 12:40 PM
🎯 Target 1:1 Achieved
💼 Total Trades: 1
🔢 Support & Resistance Levels
🟩 Resistance Zones:
24,660
24,730
24,768 ~ 24,800
24,882
24,980 ~ 25,000
25,100 ~ 25,128
25,180 ~ 25,212
🟥 Support Zones:
24,882
24,800 ~ 24,768
24,730
24,660
24,590
24,530 ~ 24,480
24,461
24,420 ~ 24,400
24,365 ~ 24,330
24,245 ~ 24,240
🔮 What’s Next?
Today’s session looked like a failed to sustain above 24800 and lack of retracement. close around the fib level, raises a question about whether is it breakout failure or just retracement ?
In short: no clarity.
📌 If Nifty holds above 24,530–24,480, it may attract buying towards 24,730–24,800 again.
📉 But a sustained break below 24,480 could invite a retest of 24,365 ~ 24,330 zone.
➡️ For now, traders should stay nimble and option buyers cautious.
💬 Final Thoughts
“Confusion is a part of clarity. Let the market reveal itself — reacting is better than predicting.”
✏️ Disclaimer
This is just my personal viewpoint. Always consult your financial advisor before taking any action.
Nifty levels - May 14, 2025Nifty support and resistance levels are valuable tools for making informed trading decisions, specifically when combined with the analysis of 5-minute timeframe candlesticks and VWAP. By closely monitoring these levels and observing the price movements within this timeframe, traders can enhance the accuracy of their entry and exit points. It is important to bear in mind that support and resistance levels are not fixed, and they can change over time as market conditions evolve.
The dashed lines on the chart indicate the reaction levels, serving as additional points of significance to consider. Furthermore, take note of the response at the levels of the High, Low, and Close values from the day prior.
We hope you find this information beneficial in your trading endeavors.
* If you found the idea appealing, kindly tap the Boost icon located below the chart. We encourage you to share your thoughts and comments regarding it.
Wishing you success in your trading activities!
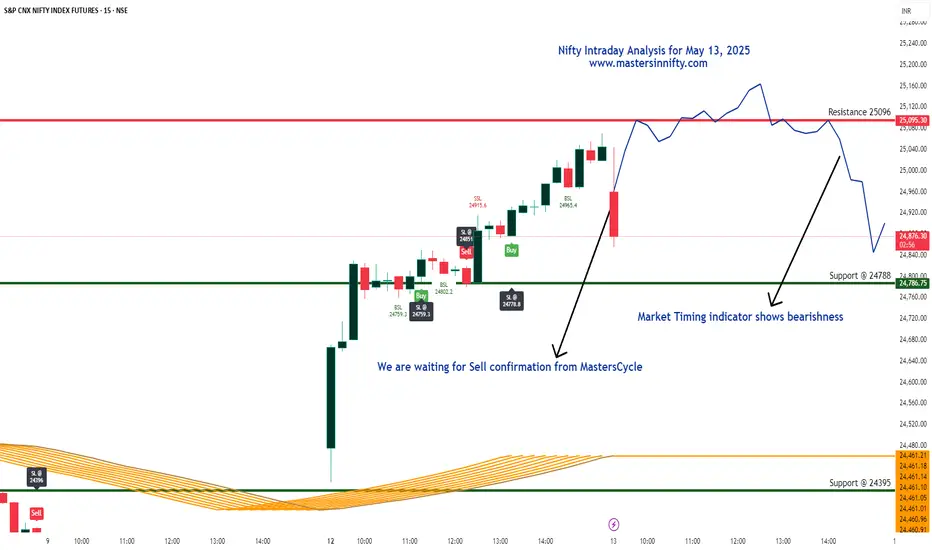
Nifty Futures Intraday Analysis for May 13, 2025According to our Market Timing indicator, it looks bearish trend for the day. The Support levels are at 24788 and 24395 while Resistance is at 25096.
I am waiting for Sell Signal confirmation from MastersCycle indicator with a proper stop-loss to take my short position.
This is only my view. Traders are suggested to follow own technical analysis and trade with proper risk management.
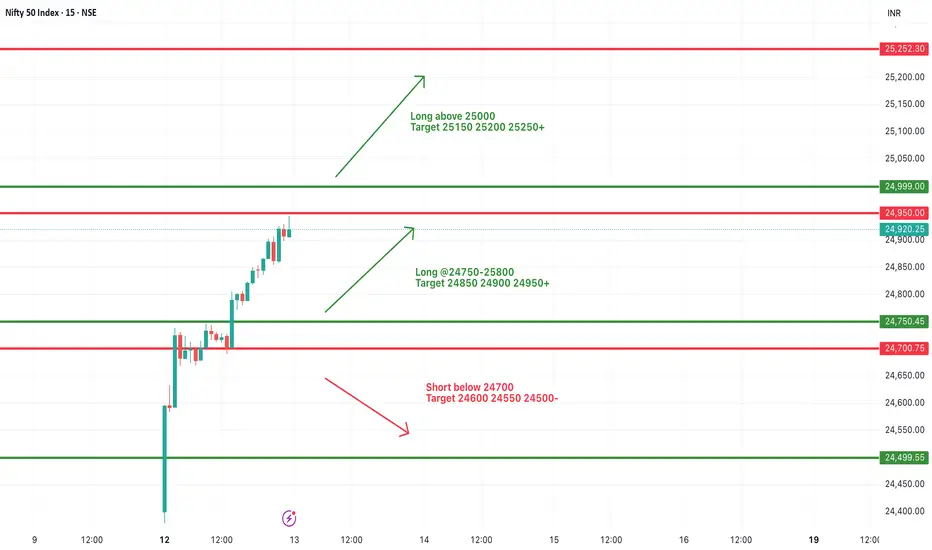
#NIFTY Intraday Support and Resistance Levels - 13/05/2025Gap up opening expected in nifty. After opening if nifty starts trading above 25000 level then possible strong upside rally upto 150-200+ points expected in index. 24750 level will act as a strong support for nifty. Any downside movement can reversal from this level. Now any major downside only expected below 24700 level.
Brahmos Candle took off today. The situation was delicate on Friday but weekend brought a news that was favorable for the market. The news related to Ceasefire always helps the business and give a relief to the investors. We are yet to see how things shape up when the 'war of fog' disperses but things are coming back on track it seems as of now. Trade talks between US and China are also yielding some positive vibes. Thus the market today took off like a BRAHMOS Missile and had given one of the strongest candles which is very rare to see. Things are looking very bullish as of now if everything remains calm.
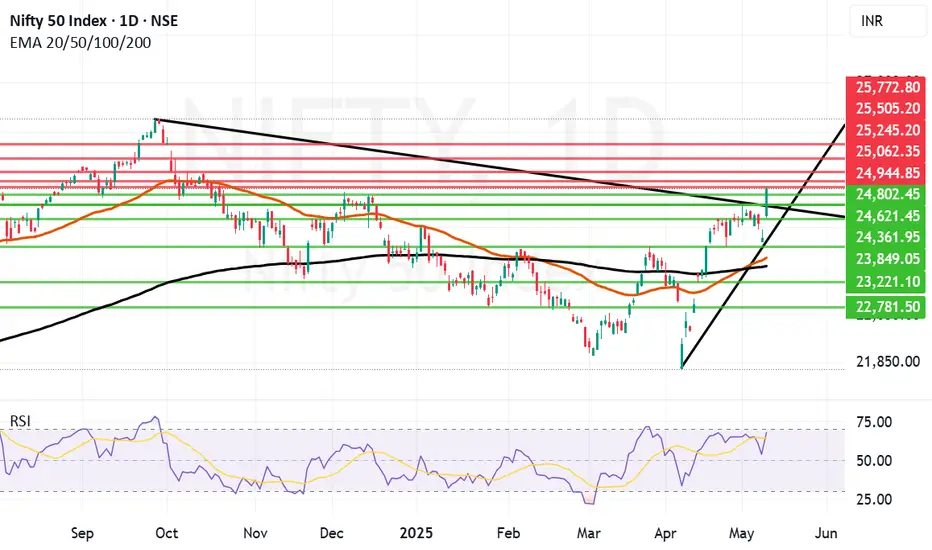
The Nifty supports right now seem to be near 24802, 24621 (Trend line Support) 24361, 23849, 23648 (Mother line on Daily chart) and 23498 (Father line on Daily chart).
The Nifty Resistances right now seem to be near 24944, 25062, 25245, 25505 and 25772. Once we close above 25772 if everything remain positive we can think of regaining even 26K levels and going deeper just like our missiles. But before we reach the Euphoria zone there are a lot of resistances to be crossed.
Shadow of the candle is Bullish however there can be chances of Profit booking as well where investors can tend to take their short / medium term profit.
Disclaimer: The above information is provided for educational purpose, analysis and paper trading only. Please don't treat this as a buy or sell recommendation for the stock or index. The Techno-Funda analysis is based on data that is more than 3 months old. Supports and Resistances are determined by historic past peaks and Valley in the chart. Many other indicators and patterns like EMA, RSI, MACD, Volumes, Fibonacci, parallel channel etc. use historic data which is 3 months or older cyclical points. There is no guarantee they will work in future as markets are highly volatile and swings in prices are also due to macro and micro factors based on actions taken by the company as well as region and global events. Equity investment is subject to risks. I or my clients or family members might have positions in the stocks that we mention in our educational posts. We will not be responsible for any Profit or loss that may occur due to any financial decision taken based on any data provided in this message. Do consult your investment advisor before taking any financial decisions. Stop losses should be an important part of any investment in equity.
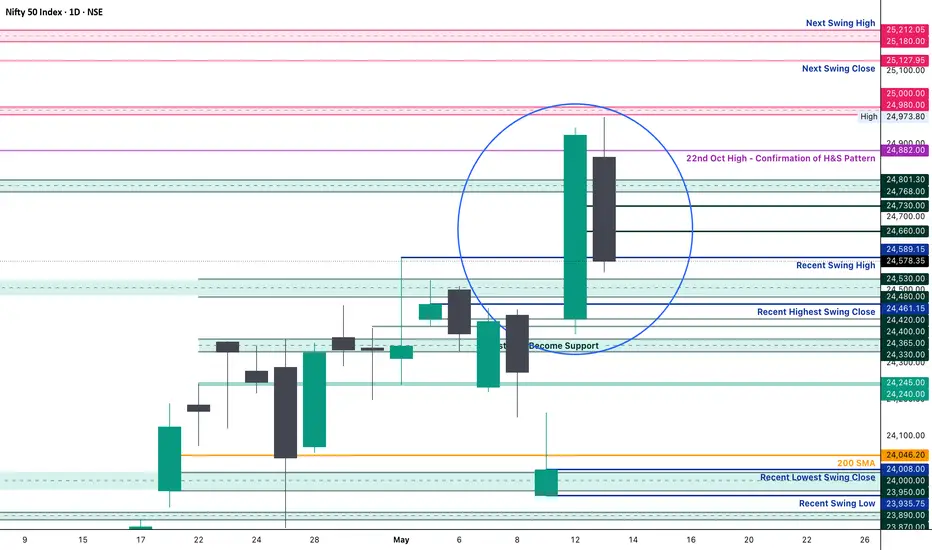
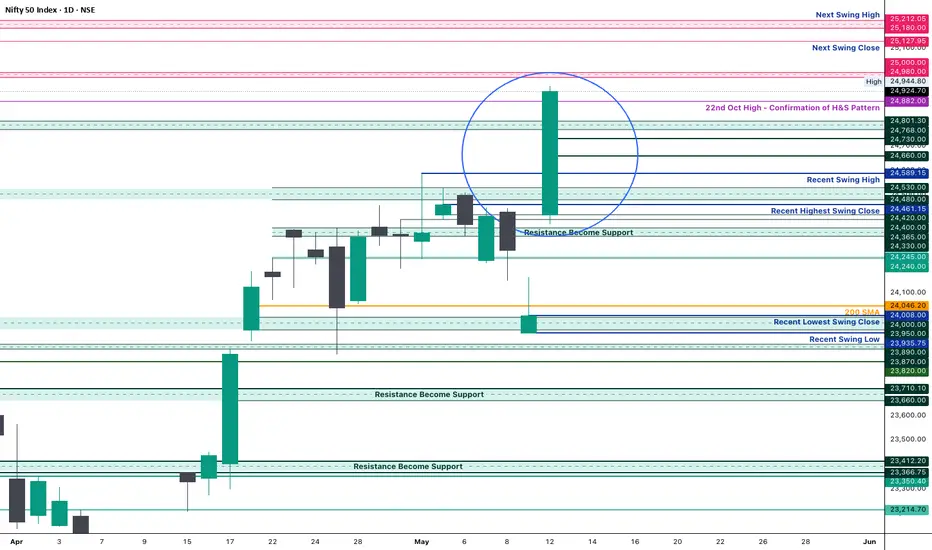
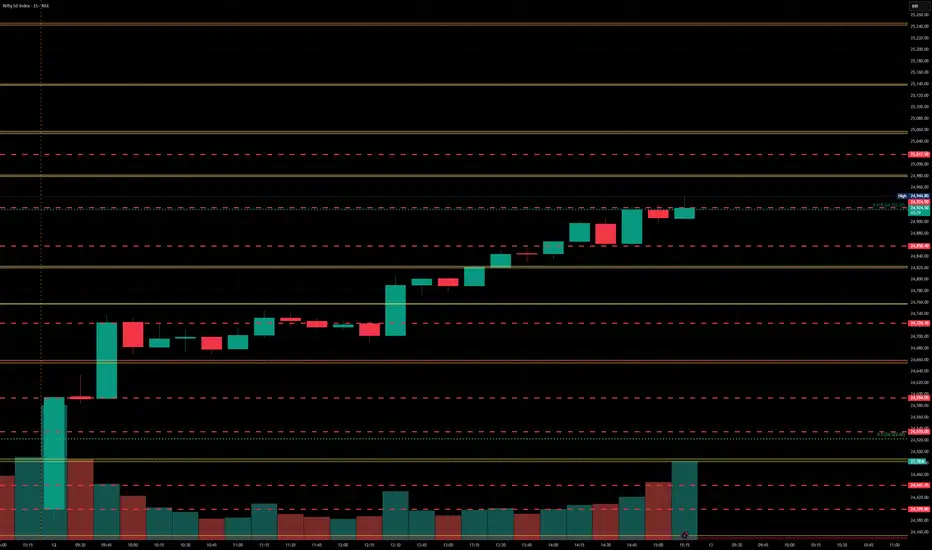
Nifty Analysis EOD - May 12, 2025 - Monday🟢 Nifty Analysis EOD - May 12, 2025 - Monday 🔴
🚀 Peace Talks & Policy Push – Bulls Break Chains, Nifty Soars to New Heights!
Opening Mood:
Relief from geopolitical tension and global trade optimism lit a fire under the bulls—marking one of the most powerful sessions in recent weeks.
🧭 Nifty Summary:
Following positive developments—ceasefire between India and Pakistan and trade policy easing between China and the US—Gift Nifty signaled a sharp gap-up.
Nifty opened at 24,420 (▲ 412 points | 1.72%), jumping above multiple resistance levels: 24,400~24,420 and 24,365~24,300. The first 5-minute candle alone posted a 184-point rally—and from there, bulls never looked back.
By breaching the 24,800 resistance and making a new swing high at 24,944.80, the day stamped bullish dominance. The close just 20 points below the high reflects strong buying interest and minimal profit booking.
🕯️ Daily Candle Breakdown:
Today’s Candle: Bullish Marubozu (full-bodied, tiny/no wicks) — high conviction buying
Close: 24,924.60 (Near day’s high)
Key Observations:
✅ Breakout above 24,800 resistance
✅ Closed above 22nd Oct 2024 candle high — a key Head & Shoulder confirmation level
✅ Strong volume and price confirmation
🔜 Watch for follow-through above 24,700–24,800 zone
What It Implies:
Clear strength from bulls with no hesitation. If follow-through sustains, we could be heading toward a fresh leg of upside—likely to test the psychological 25,000 mark and beyond.
⚔️ Gladiator Strategy Update
Strategy Parameters:
ATR: 355.76
IB Range: 358.95 → Extreme Large IB
Market Structure: ImBalanced
Trade Highlights:
Total Trades: 1
✅ Long Trigger @ 12:25 PM → Target 1:3.5 Achieved
📈 Intraday Walk (5-Min View):
Opened strong above multiple resistance zones
First candle: explosive 184-point rally
Smooth rally continued with no major retracement
A new swing high formed at 24,944.80
Day closed just shy of the high—strength intact
🔍 Support & Resistance Levels
🔼 Resistance Zones:
24,980 ~ 25,000
25,100 ~ 25,128
25,180 ~ 25,212
🔽 Support Zones:
24,882
24,800 ~ 24,768
24,730
24,660
24,590
24,530 ~ 24,480
📌 Final Thoughts:
"Markets love clarity. With news-driven fear subsiding, technicals are taking charge again. Follow momentum—but don't chase it blindly."
✏️ Disclaimer
This is just my personal viewpoint. Always consult your financial advisor before taking any action.
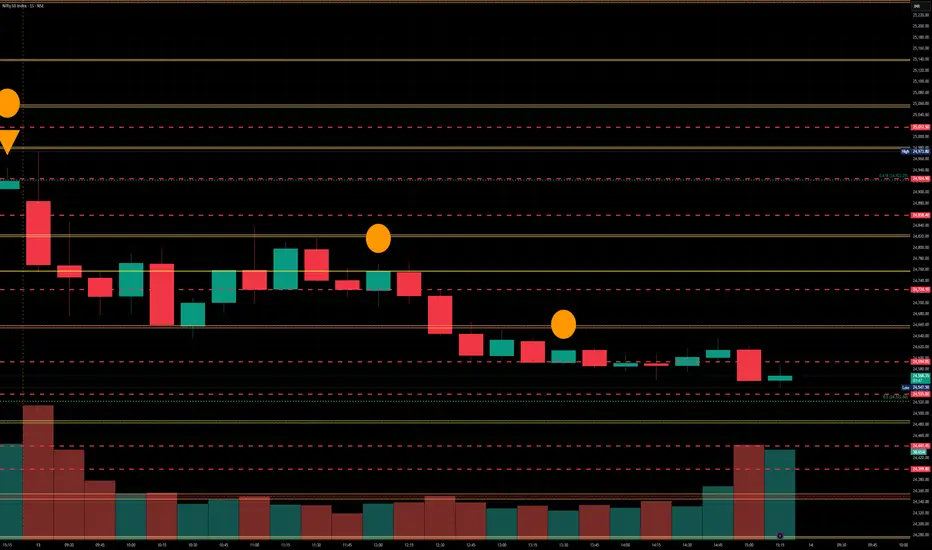
Nifty levels - May 13, 2025Nifty support and resistance levels are valuable tools for making informed trading decisions, specifically when combined with the analysis of 5-minute timeframe candlesticks and VWAP. By closely monitoring these levels and observing the price movements within this timeframe, traders can enhance the accuracy of their entry and exit points. It is important to bear in mind that support and resistance levels are not fixed, and they can change over time as market conditions evolve.
The dashed lines on the chart indicate the reaction levels, serving as additional points of significance to consider. Furthermore, take note of the response at the levels of the High, Low, and Close values from the day prior.
We hope you find this information beneficial in your trading endeavors.
* If you found the idea appealing, kindly tap the Boost icon located below the chart. We encourage you to share your thoughts and comments regarding it.
Wishing you success in your trading activities!
#NIFTY Intraday Support and Resistance Levels - 12/05/2025Gap up opening expected in nifty near 24500 level. After opening if nifty starts trading above 24550 level then expected this rally can extend upto 24750+ in today's session. Downside 24250 level will act as a strong support for today's session. Any downside movement can reversal from this level. Major downside only expected below 24200.

Nifty: Correction aheadNifty is likely to correct lower towards 23400-23000 zone before resuming up.
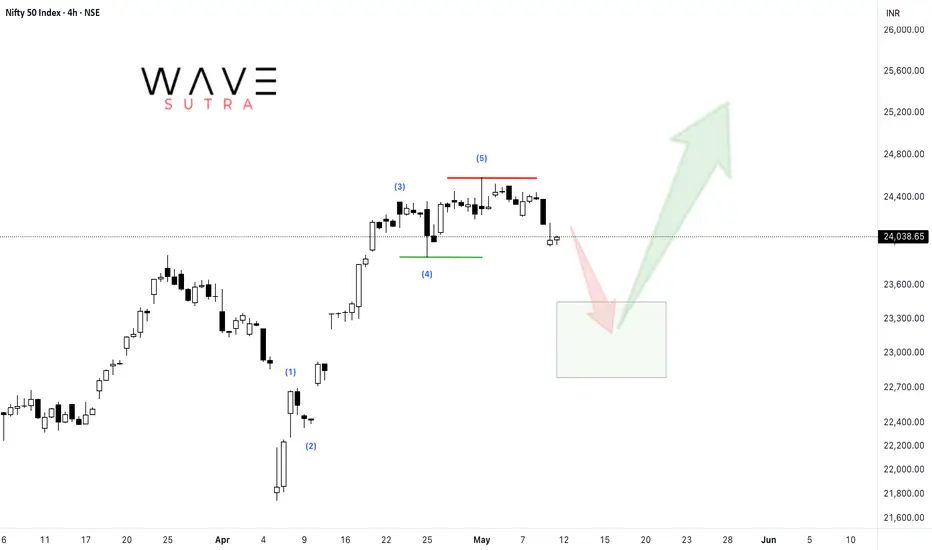
Ceasefire will pump Nifty till 24500As we all know, the market is highly sensitive and tends to react quickly to news events.
Currently, there is ongoing conflict between India and Pakistan, which has caused the markets to open with consistent gap-downs, followed by rangebound movement for the remainder of the trading session.
However, recent developments indicate that Pakistan has realized it cannot continue the conflict without risking severe consequences, including potential erasure from the global map. As a result, they are now showing readiness for a ceasefire.
Given the market's sensitive nature, we can expect a positive reaction to this news.
A strong gap-up opening is likely in the coming sessions.
Technically, the market has the potential to rally towards the 0.886 Fibonacci level, which corresponds to the 2400–2500 zone.
Traders should remain cautious but optimistic, and closely monitor key levels for confirmation of the trend.
#Nifty
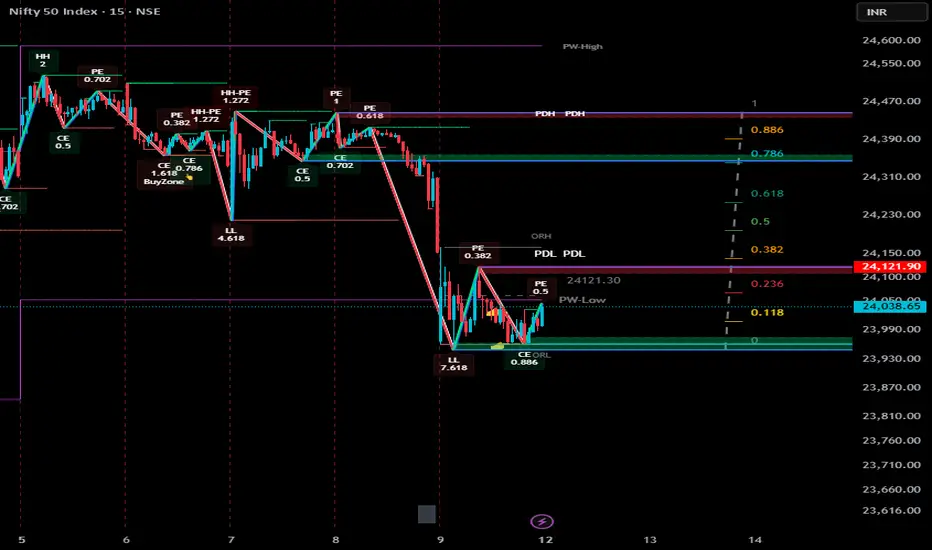
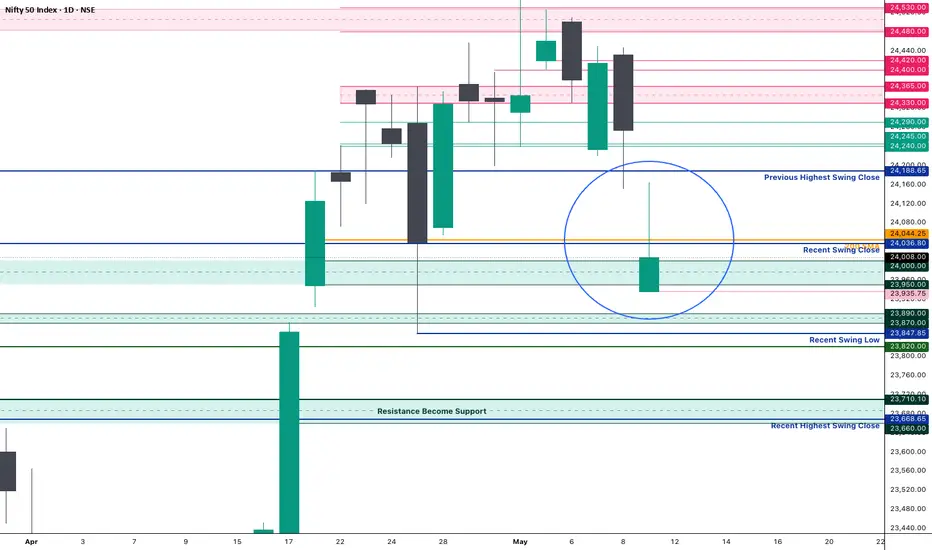
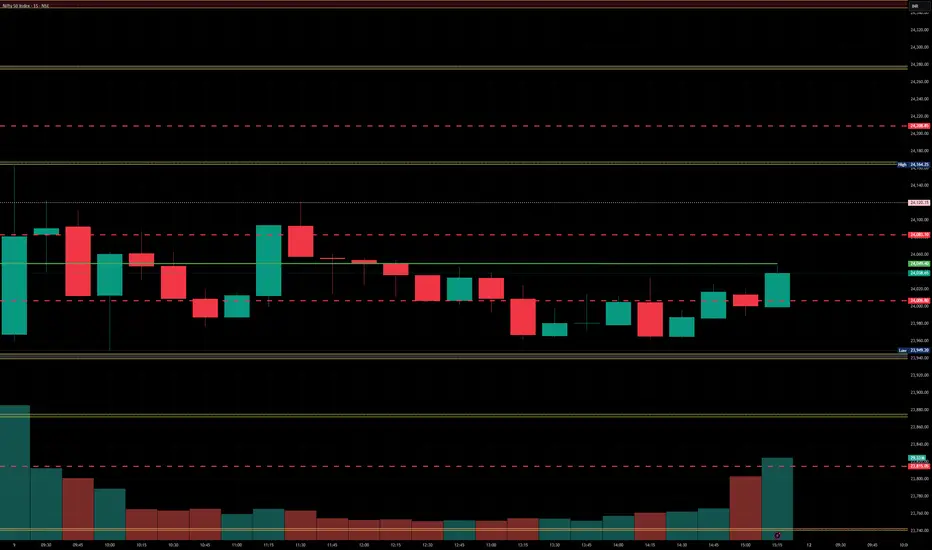
Nifty Analysis EOD - May 9, 2025 - Thursday🟢 Nifty Analysis EOD - May 9, 2025 - Thursday 🔴
🧨 Gap Down, Rebound & a Triangle Trap – Bulls Show Spine Amid Chaos
Opening Mood:
Overnight panic from geopolitical tensions shook the market’s foundation—but the bulls weren’t ready to surrender just yet.
🧭 Nifty Summary:
Gift Nifty had plunged to 23,760 late last night on news of escalating conflict—marking a 445-point fall. However, as the night wore on without further developments, markets began to stabilize. At the open, Nifty registered a gap-down of 338 points at 23,935, but the first 5-minute candle showed strength, racing to fill the gap.
After a brief attempt to break the Previous Day’s Low (PDL), Nifty failed to hold below and slid back to its origin. The rest of the day was a tug-of-war with sharp two-sided moves, eventually forming a descending triangle pattern—a sign of compression and directional indecision.
🕯️ Daily Candle Breakdown:
Today’s Candle: Wide-range doji with upper wick—signs of volatility and hesitation
Close: 24,008 (▲ Positive)
Key Observations:
✅ Above 24,000 Psychological Mark
✅ Held Support Zone: 24,000 ~ 23,950
✅ Above Recent Swing Low: 23,847.85
❌ Slightly Below Previous Week’s Low: 24,054.05
❌ Below Previous Swing Close: 24,036
What It Implies:
Buyers are stepping in at key supports, but conviction is still lacking. The market remains reactive to global cues, especially Mission Sindoor ones.
⚔️ Gladiator Strategy Update
Strategy Parameters:
ATR: 291.20
IB Range: 204.00 (Large IB)
Market Structure: ImBalanced
Trade Highlights:
Total Trades: 1
✅ Long Trigger @ 10:10 AM → Target 1:1.5 Achieved
📈 Intraday Walk (5-Min View):
Strong gap-fill in the first candle signaled bullish intent
Failed breakdown below PDL trapped weak shorts
Descending triangle emerged as price compressed
Market closed near resistance but above key support—neutral to slightly bullish tone
🔮 What’s Next?
This market is walking a tightrope between sentiment and structure. On one hand, technical levels are being respected—but on the other, global uncertainty is keeping participants hesitant.
“This is a news-driven market. Delivery trades are best avoided. Stay nimble, trade the levels, and protect capital. Remember, sometimes staying out is a profitable strategy.”
🔍 Support & Resistance Levels
🔼 Resistance Zones:
24,036 ~ 24,044
24,150 ~ 24,165
24,188 ~ 24,240
24,290
24,330 ~ 24,365
24,400 ~ 24,420
🔽 Support Zones:
24,000 ~ 23,950
23,935
23,890 ~ 23,870
23,848
23,820
23,710 ~ 23,660
📌 Final Thoughts:
“Structure is key. When levels work, respect them. When they break, adapt.”
In a market full of noise, discipline and level-based action is your edge.
✏️ Disclaimer
This is just my personal viewpoint. Always consult your financial advisor before taking any action.
So finally Nifty recedes a bit due to Indo-Pak tensions.Finally Nifty today receded a bit due to Indo-Pak tensions and war like situation/war between Indo-Pak. The support levels for Nifty now remains at 23924, 23809 important (Father line support of hourly chart), 23676 important mid channel support if this support is broken bears can drag Nifty further down to 23462, 23279, 22771 and finally 22579 which is the channel bottom support. If this level is broken there can be further free fall. Resistances on the upper side remain at 24111, 24247 (Mother Line resistance on the hourly chart), 24443, 24634 and 24892 (Channel top resistance). Situation remains fluid due to the Geo-Political situation no support can be very strong support as a lot can happen during the week end and no resistance can be a solid resistance if few things move in the anticipated direction.
Disclaimer:The above information is provided for educational purpose, analysis and paper trading only. Please don't treat this as a buy or sell recommendation for the stock or index. The Techno-Funda analysis is based on data that is more than 3 months old. Supports and Resistances are determined by historic past peaks and Valley in the chart. Many other indicators and patterns like EMA, RSI, MACD, Volumes, Fibonacci, parallel channel etc. use historic data. There is no guarantee they will work in future as markets are highly volatile and swings in prices are also due to macro and micro factors based on actions taken by the company as well as region and global events. Equity investment is subject to risks. I or my clients or family members might have positions in the stocks that we mention in our educational posts. We will not be responsible for any Profit or loss that may occur due to any financial decision taken based on any data provided in this message. Do consult your investment advisor before taking any financial decisions. Stop losses should be an important part of any investment in equity.

Nifty levels - May 12, 2025Nifty support and resistance levels are valuable tools for making informed trading decisions, specifically when combined with the analysis of 5-minute timeframe candlesticks and VWAP. By closely monitoring these levels and observing the price movements within this timeframe, traders can enhance the accuracy of their entry and exit points. It is important to bear in mind that support and resistance levels are not fixed, and they can change over time as market conditions evolve.
The dashed lines on the chart indicate the reaction levels, serving as additional points of significance to consider. Furthermore, take note of the response at the levels of the High, Low, and Close values from the day prior.
We hope you find this information beneficial in your trading endeavors.
* If you found the idea appealing, kindly tap the Boost icon located below the chart. We encourage you to share your thoughts and comments regarding it.
Wishing you success in your trading activities!
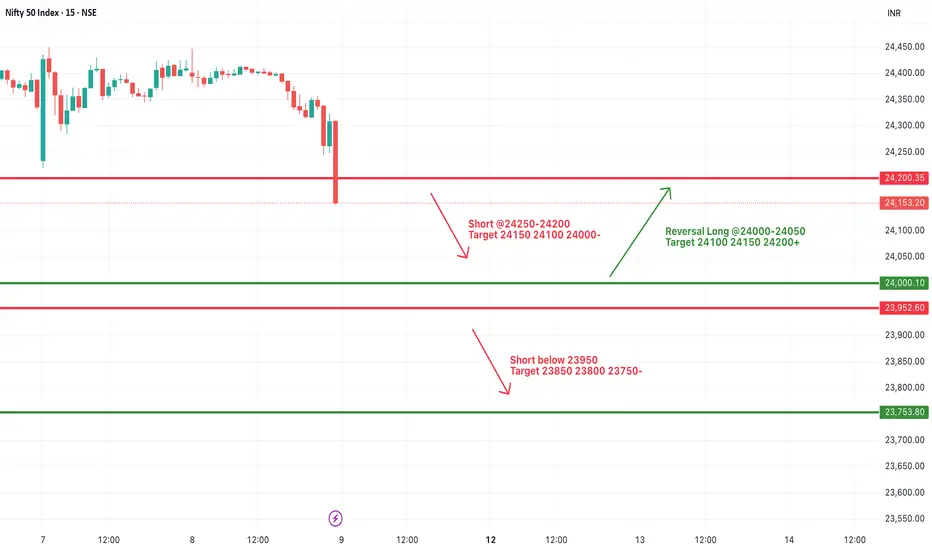
#NIFTY Intraday Support and Resistance Levels - 09/05/2025Gap down opening expected in nifty. After opening if nifty starts trading below 23950 level then possible further downside upto 23750. Any upside movement can possible if nifty sustain above 24000 level. Upside 24200-24250 zone act as a strong resistance for today's session. Any upside rally can reversal from this level.
Nifty levels - May 09, 2025Nifty support and resistance levels are valuable tools for making informed trading decisions, specifically when combined with the analysis of 5-minute timeframe candlesticks and VWAP. By closely monitoring these levels and observing the price movements within this timeframe, traders can enhance the accuracy of their entry and exit points. It is important to bear in mind that support and resistance levels are not fixed, and they can change over time as market conditions evolve.
The dashed lines on the chart indicate the reaction levels, serving as additional points of significance to consider. Furthermore, take note of the response at the levels of the High, Low, and Close values from the day prior.
We hope you find this information beneficial in your trading endeavors.
* If you found the idea appealing, kindly tap the Boost icon located below the chart. We encourage you to share your thoughts and comments regarding it.
Wishing you success in your trading activities!

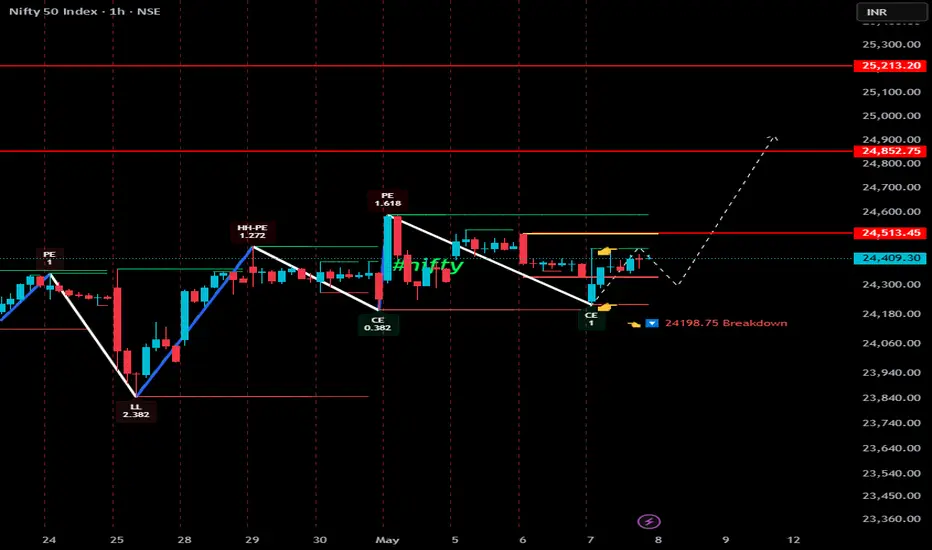
Surgical strike on Nifty call sellers at 24800-900Market Update: Nifty Outlook
Today, amid news of an Indian Army operation, Nifty opened with a significant gap down but swiftly recovered, showing strong upward momentum.
Currently, the chart structure indicates the need for a higher low to set the stage for the next leg of the uptrend towards the 24,800–24,900 zone. A flat opening in the next session could provide the ideal setup for a strong rally.
Notably, a sustained move above 24,500 could trigger a "surgical strike" on call sellers positioned at the 24,800–24,900 levels, potentially leading to sharp short-covering.
We recommend closely tracking price behavior near key support areas for confirmation of the next move.
Nifty Futures Intraday Trend Analysis for May 08, 2025Based on my analysis, Nifty Futures is likely to exhibit a bearish intraday trend tomorrow, with resistance around 24,500 and strong support near 24,260. This outlook does not factor in potential price gaps in either direction.
Traders are advised to conduct their own technical analysis before initiating any positions. Always trade with a well-defined stop-loss. This information is intended strictly for educational purposes.

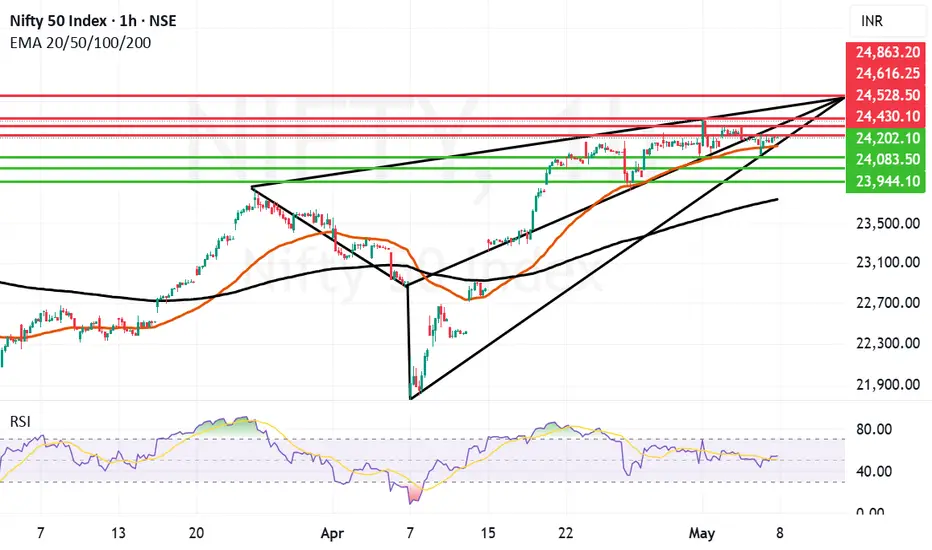
Very Strong performance by Nifty to close in Positive todayDespite the fear of escalation of tensions at Indo-Pak border and Indian carrying out Operation Sindoor Nifty closed in Green today. This signifies the strength of Indian market, India as an Economy and India as a country. Very few would have imagined that Indian markets will close in Green today when the market begun early morning. The situation still remains fluid/dynamic and explosive. so still investors should keep stop losses and trailing stop losses in place.
Supports for Nifty remain at: 24315 (Strong Mother line for hourly chart), 24202, 24083, 23944 and 23754 (Strong Father Line support). Below 23754 Bears can take control of the market and drag it towards 23K.
Resistances For Nifty remain at: 24430, 24528, 24616 and 24863. Closing above 24863 can empower Bulls in a big way to Pull Index towards 25K+ levels.
Disclaimer: The above information is provided for educational purpose, analysis and paper trading only. Please don't treat this as a buy or sell recommendation for the stock or index. The Techno-Funda analysis is based on data that is more than 3 months old. Supports and Resistances are determined by historic past peaks and Valley in the chart. Many other indicators and patterns like EMA, RSI, MACD, Volumes, Fibonacci, parallel channel etc. use historic data which is 3 months or older cyclical points. There is no guarantee they will work in future as markets are highly volatile and swings in prices are also due to macro and micro factors based on actions taken by the company as well as region and global events. Equity investment is subject to risks. I or my clients or family members might have positions in the stocks that we mention in our educational posts. We will not be responsible for any Profit or loss that may occur due to any financial decision taken based on any data provided in this message. Do consult your investment advisor before taking any financial decisions. Stop losses should be an important part of any investment in equity.
Nifty levels - May 08, 2025Nifty support and resistance levels are valuable tools for making informed trading decisions, specifically when combined with the analysis of 5-minute timeframe candlesticks and VWAP. By closely monitoring these levels and observing the price movements within this timeframe, traders can enhance the accuracy of their entry and exit points. It is important to bear in mind that support and resistance levels are not fixed, and they can change over time as market conditions evolve.
The dashed lines on the chart indicate the reaction levels, serving as additional points of significance to consider. Furthermore, take note of the response at the levels of the High, Low, and Close values from the day prior.
We hope you find this information beneficial in your trading endeavors.
* If you found the idea appealing, kindly tap the Boost icon located below the chart. We encourage you to share your thoughts and comments regarding it.
Wishing you success in your trading activities!
