Nifty Chart Analysis – Major Breakout or Breakdown Ahed
Assending Triangle Chart pattern in Nifty- Breakout Possible ?
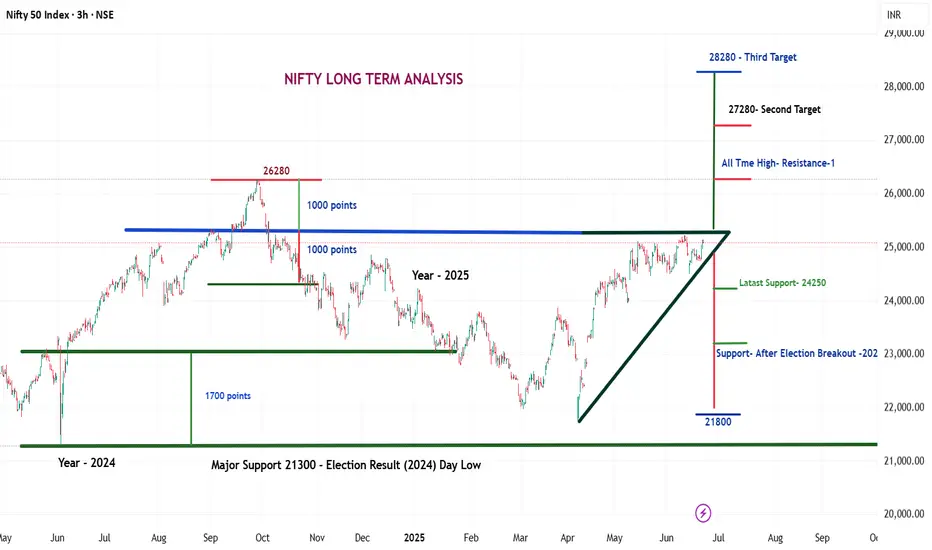
As of June 21, 2025, the Nifty 50 index is showing a strong and potentially decisive Ascending Triangle Pattern on the 3-hour time frame.
This formation typically indicates a bullish breakout if confirmed with volume. Let’s dive deep into the technical outlook and key levels that traders and investors should watch.
Current Market Overview
Current Nifty Level: ~25,080
Pattern Identified: Ascending Triangle
Time Frame: 3H (Medium-Term to Long-Term Insight)
An Ascending Triangle is a bullish continuation pattern formed by a horizontal resistance line and a rising trendline of higher lows.
Key Levels to Watch
Resistance Zone:
Immediate Resistance: 26,280 (All-Time High)
Breakout Target 2: 27,280
Breakout Target 3: 28000 (Long-Term)
If Nifty breaks above the 26,280 level with strong volume confirmation, the next upward targets will be 27,280 and possibly 28000 , based on the measured move from the triangle height.
Support Levels:
Latest Support: 24,250
Post-Election Breakout Support: 22,800
Major Support (Election Result Day Low): 21,300
If any major negative trigger (geopolitical or macroeconomic) occurs, a sharp correction can’t be ruled out. The levels mentioned will act as key demand zones.
Potential Global Risks
While the technical setup is bullish, external risks could spoil the party:
Geopolitical Conflicts:
Iran vs. Israel
India vs. Pakistan
China vs. US tensions
Macro-Economic Triggers:
Spike in Inflation or Crude Oil Prices
US Fed Rate Hike Surprises
Global Recession Fears
In such cases, a steep fall toward 22,800 or even 21,300 may occur.
✅ Conclusion & Strategy
The current Nifty setup presents a classic high-reward-low-risk opportunity for long-term traders if a breakout is confirmed. However, caution is advised if global uncertainties increase. Investors should:
Wait for a decisive breakout above 26,280 with volume.
Maintain a stop-loss around 24,250 on long positions.
Consider booking partial profits near resistance levels and re-entering on pullbacks.
How Traders Can Prepare for the Next Move
Whether a breakout or breakdown happens, traders must:
Use proper stop-loss and risk management
Wait for volume confirmation
Watch for FII/DII activity
Combine price action with Data Analysis
Important Note:
This analysis is based on current chart patterns and known global events. Always use proper risk management and consult with a financial advisor before taking investment decisions.
💬 Like the chart if you found it useful
🗣 Comment your views or questions
👤 Follow us for regular breakout updates
🔁 Share this chart with your trading community and friends who follow Nifty!
✅ Let’s grow together with smart chart analysis and technical strategies.