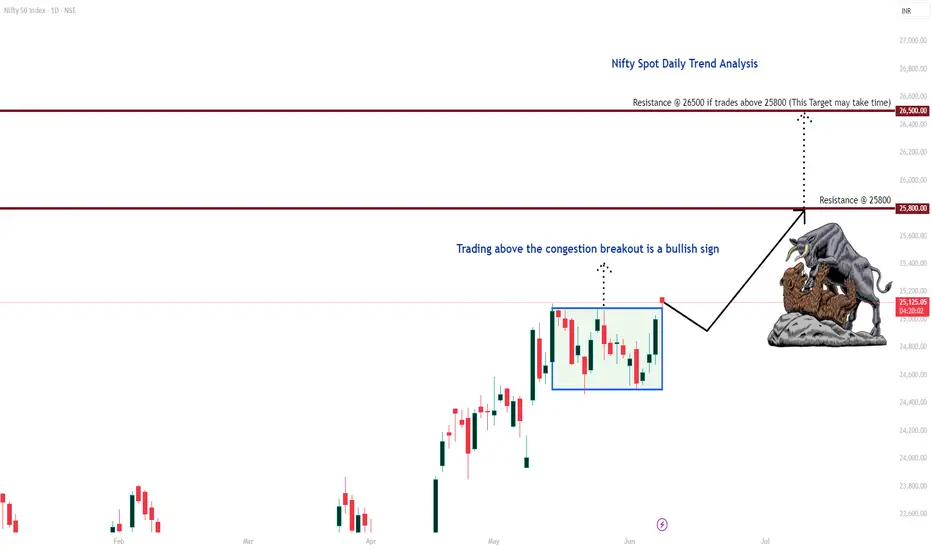
Nifty Daily Trend AnaysisMy Observation:
Nifty Spot had been consolidating within a range for 16 consecutive trading sessions. Today, it broke out decisively and is now trading above that range. If it sustains this breakout, it indicates bullish momentum and the index could potentially rally towards the targets of 25,800 and 26,500.
However, if the market slips back into the previous range, I anticipate support around 24,600—although this scenario seems less likely given the strength of today’s breakout.
Disclaimer: This is purely my personal view and is shared for educational purposes only. Please do your own analysis before making any trading decisions.
Niftyoutlook
Nifty Analysis EOD – June 6, 2025 – Friday🟢 Nifty Analysis EOD – June 6, 2025 – Friday 🔴
🎯 25K Now, What's Next?
Nifty opened on a neutral tone, cautiously awaiting the outcome of the RBI Monetary Policy. As the event unfolded and the repo rate cut of 0.5% was announced, the celebration began on Dalal Street—and the charts reflected it.
What followed was a clean, powerful rally, breaking through key levels and carrying the index all the way to the psychological milestone of 25,000, where it closed almost flat on the round number at 25,003.05.
Today’s close is just shy of the May 26th high, and a few hurdles still remain:👉 25,060–25,070👉 25,115–25,130👉 25,180–25,212
These levels will decide whether the breakout from the box range—which we’ve discussed in earlier reviews—truly sustains. As long as there’s no negative trigger over the weekend, bulls may carry the momentum into next week.
🛡 5 Min Chart with Levels
🕯 Daily Time Frame Chart
🕯 Daily Candle Breakdown
Open: 24,748.70
High: 25,029.50
Low: 24,671.45
Close: 25,003.05
Net Change: +252.15 (+1.02%)
📊 Candle Structure Breakdown
Real Body: 254.35 pts (Strong Green)
Upper Wick: 26.45 pts
Lower Wick: 77.25 pts
🔍 Interpretation
A session that began quietly turned into a bullish sprint.
The small upper wick shows there was minimal rejection at higher levels.
The lower wick reflects early dip buying.
The strong green body signals dominant intraday momentum, with bulls in charge from start to finish.
🔦 Candle Type
🟢 Bullish Marubozu–like candle– Almost a full body with small wicks, indicating powerful follow-through buying and confidence among bulls.
📌 Key Insight
25,000 breakout looks clean and technically sound.
Holding above 24,900–24,950 in the coming session could lead to further upside exploration.
All eyes on volume confirmation and whether we can conquer the next resistance band near 25,130+.
🛡 5 Min Intraday Chart
⚔️ Gladiator Strategy Update
ATR: 274.31
IB Range: 91.90 → Medium IB
Market Structure: Balanced
Trades:✅ 10:05 AM – Long Triggered → Target Achieved (1:1.4)✅ 10:40 AM – Long Triggered → Target Achieved (1:2)
📌 Support & Resistance Zones
Resistance Levels
25,062 ~ 25,070
25,116 ~ 25,128
25,180 ~ 25,212
Support Levels
24,972
24,920 ~ 24,894
24,800 ~ 24,768
24,727 ~ 24,737
24,660
💭 Final Thoughts
Momentum is back.Bulls not only broke free from consolidation—they made a statement. The RBI’s surprise move might just be the fuel Nifty needed to launch toward unexplored zones.
📌 “Big breakouts don’t ask for permission. They just happen—when doubt is highest.”
✏️ Disclaimer
This is just my personal viewpoint. Always consult your financial advisor before taking any action.
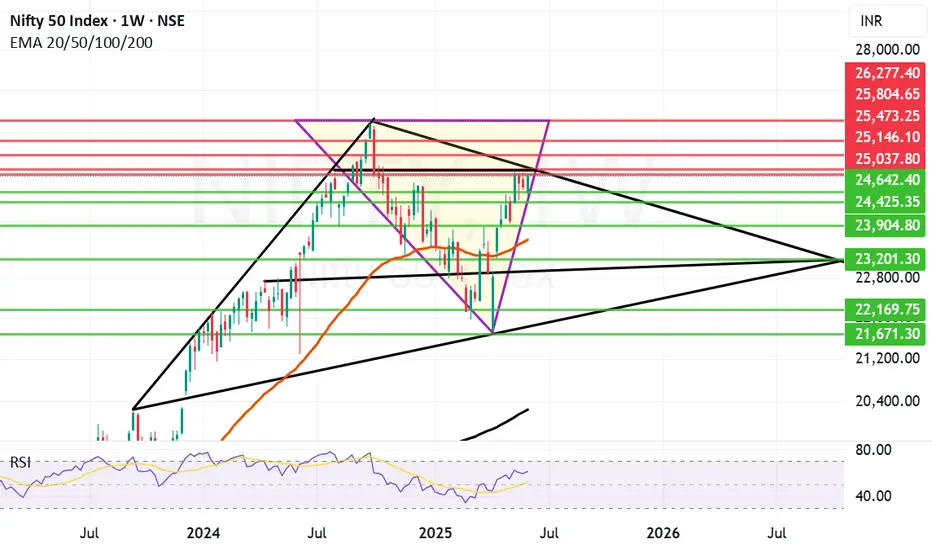
50 bps Repo Rate Cut boosts Nifty. Can it fly further now?The market was expecting a Repo Rate Cut From RBI. The expectation was for 25bps but what we got today from RBI was a bumper 50 bps rate cut. This propelled Nifty to close above much coveted level of 25K as Nifty managed to close at 25003. Now Nifty has entered a critical resistance zone. This zone starts from around 25037 to 25146. Closing above 25146 is mandatory for Nifty to fly further and gain further momentum. Last 4 weeks or so Nifty has been returning back from this zone. We can see this in the weekly chart of Nifty. With rate cut the chances for Nifty to fly above this most important levels has increased a lot.
The resistances for Nifty Now Remain at: 25037, 25146 (Important Trend line Resistance, Bulls will be very active above this level.), 25473, 25804 and 26277. Further levels will be given once we get a closing above 26277.
The supports for Nifty remain at: 24642, 24425, 23904, 23597 (Most important Mother Line of Weekly Candles). Below this level Nifty will become very week again and bears can drag Nifty further down towards 23201 (Important Trend Line Support). If this is broken in unlikely global or local geo-political event then Nifty can further fall to 22169 or even 21671 levels in unlikely scenario of major geo-political event unfolding.
Disclaimer: The above information is provided for educational purpose, analysis and paper trading only. Please don't treat this as a buy or sell recommendation for the stock or index. The Techno-Funda analysis is based on data that is more than 3 months old. Supports and Resistances are determined by historic past peaks and Valley in the chart. Many other indicators and patterns like EMA, RSI, MACD, Volumes, Fibonacci, parallel channel etc. use historic data which is 3 months or older cyclical points. There is no guarantee they will work in future as markets are highly volatile and swings in prices are also due to macro and micro factors based on actions taken by the company as well as region and global events. Equity investment is subject to risks. I or my clients or family members might have positions in the stocks that we mention in our educational posts. We will not be responsible for any Profit or loss that may occur due to any financial decision taken based on any data provided in this message. Do consult your investment advisor before taking any financial decisions. Stop losses should be an important part of any investment in equity.
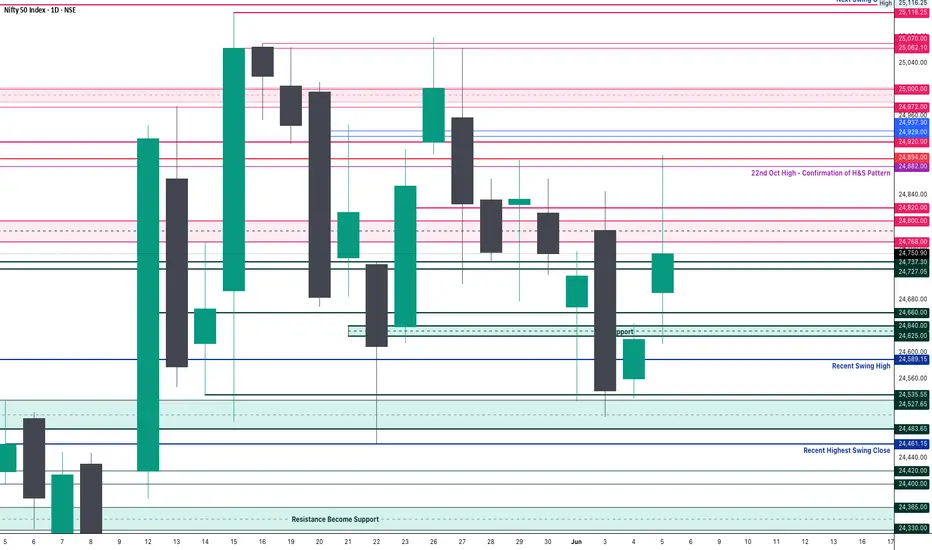
Nifty Analysis EOD – June 5, 2025 – Thursday🟢 Nifty Analysis EOD – June 5, 2025 – Thursday 🔴
🎭 Trap and Manipulation on Expiry Day
As discussed in yesterday’s note—a calm before the storm—today delivered the volatility, but not in the form anyone truly expected. Nifty opened with a 53-point gap-up, filled the gap in the first 5 minutes, and then marched upwards to hit a day high of 24,761.
But that wasn't the end…
Within just 20 minutes, Nifty spiked to 24,899—a sharp and unexpected move that defied recent technical context. Why?Because just two sessions ago (June 3), the 24,800 level was a clear rejection zone, yet today the price cut through that zone like butter, crossing the highs of the past 6 sessions—only to fall just as sharply.
📉 That’s not strength—it’s classic expiry day manipulation.
The past 16 sessions have shown candles with unusual shadows, and today added another one to the list. For swing traders, this market structure has been offering no clean entry triggers. The message is loud and clear: focus only on intraday setups and stay cautious.
🛡 5 Min Chart with Levels
🕯 Daily Time Frame Chart
🕯 Daily Candle Breakdown
Open: 24,691.20
High: 24,899.85
Low: 24,613.10
Close: 24,750.90
Net Change: +130.70 (+0.53%)
📊 Candle Structure Breakdown
Real Body: 59.70 pts (Green)
Upper Wick: 148.95 pts
Lower Wick: 78.10 pts
🔍 InterpretationThe candle paints a story of early optimism followed by profit booking or supply absorption near 24,900. Though the day closed green, the long upper shadow shows sellers dominating higher levels, leaving buyers with little to celebrate by the close.
🔦 Candle Type
🟢 Green Spinning Top with Long Upper Wick
Indicates indecision, with a bullish undertone that lacks conviction at higher levels.
📌 Key Insight
24,900 remains a psychological and technical barrier.
A bullish close above 24,900 might invite momentum traders, but until then—suspicion stays.
A breakdown below 24,600 may trigger downside interest again.
🛡 5 Min Intraday Chart
⚔️ Gladiator Strategy Update
ATR: 265.01
IB Range: 148.4 → Medium IB
Market Structure: imBalanced
Trades:✅ 11:00 AM – Long Triggered → Target Achieved (1:1.5)✅ 11:50 AM – Long Triggered → Trailing SL Hit, but Target Achieved (1:4.8)
📌 Support & Resistance Zones
Resistance Levels
24,768 ~ 24,800
24,820
24,882
24,894 (Strong Resistance)
Support Levels
24,727 ~ 24,737
24,660
24,625 ~ 24,640
24,600
24,530 ~ 24,480
24,460
💭 Final Thoughts
A day of deception more than direction.This expiry session was less about trend and more about clearing premiums, trapping both sides, and faking strength in the middle of a boxed consolidation.
📌 “Not every green candle is bullish. Some are just well-disguised traps.”
✏️ Disclaimer
This is just my personal viewpoint. Always consult your financial advisor before taking any action.
Nifty bounce between Trendline resistance and Mother lineWe Saw a jump of 130 points in Nifty today. The jump could have been higher if trend line resistance would not have come into play. This trend line resistance which came into effect is exactly around 24899 as it can be seen in the chart which was also the day's high. After making this high Nifty fell again until Mother line support present near 24706 again came into act for Nifty to close near 24750.
Thus the supports for Nifty now remain at: 24706 (Mother Line Support), 24613 (Low of today) and Father line Support near 24508. Below 24508 there will be further weakness and Bears will take control of the market.
The Resistances for Nifty now remain at: 24767, 24843, 24899 (trend line resistance), and 24971(Another Trend line resistance). Above 24971 closing Nifty will gain strength again and Bears can pull the market upwards towards 25074 or 25132. Closing above 25132 will be very good for the market as there seems to be a pure Bull territory above this zone.
Disclaimer: The above information is provided for educational purpose, analysis and paper trading only. Please don't treat this as a buy or sell recommendation for the stock or index. The Techno-Funda analysis is based on data that is more than 3 months old. Supports and Resistances are determined by historic past peaks and Valley in the chart. Many other indicators and patterns like EMA, RSI, MACD, Volumes, Fibonacci, parallel channel etc. use historic data which is 3 months or older cyclical points. There is no guarantee they will work in future as markets are highly volatile and swings in prices are also due to macro and micro factors based on actions taken by the company as well as region and global events. Equity investment is subject to risks. I or my clients or family members might have positions in the stocks that we mention in our educational posts. We will not be responsible for any Profit or loss that may occur due to any financial decision taken based on any data provided in this message. Do consult your investment advisor before taking any financial decisions. Stop losses should be an important part of any investment in equity.
Nifty Analysis EOD – June 3, 2025 – Tuesday🟢 Nifty Analysis EOD – June 3, 2025 – Tuesday 🔴
Opening Sentiment vs. Reality: A Day of Dual Personality
Nifty opened with a 70-point gap-up above the previous day’s high, carrying a positive vibe. In just one minute, it surged another 57 points, marking the day’s high at 24,845. However, that bullish momentum didn’t last. The index faced strong resistance, leading to a sharp 243-point drop within 15 minutes, breaching CPR and the previous swing low to hit the first Current Day Low (CDL) at 24,601.30.
Despite the jolt, Nifty showed resilience—bounced back from the 24,625–24,640 zone, recovered to VWAP, and even retested the PDH. Yet again, it failed to hold above 24,700, echoing the morning's rejection. A second wave of selling took Nifty to a fresh low of 24,502.15 mid-session.
The closing wasn’t any better. Nifty quietly slid again, retested the breakout zone, and closed at 24,542.50, nearly at the intraday low—a day that started with hope ended on a pessimistic note.
Interestingly, India VIX also dropped, despite the downward market move—signalling premium crush and a double whammy for option buyers who got the direction right but profits wrong.
🛡 5 Min Chart with Levels
📊 Daily Summary Highlights
✅ Gap-up Start but sharp reversal
📉 Both PDH and PDL tested intraday
📉 Marubozu Engulfing Candle
⚠️ Closed below Higher Swing Low – a potential trend-shift signal
🕯 Daily Time Frame Chart
🕯 Daily Time Frame Chart
🕯 Daily Candle Breakdown
Open: 24,786.30
High: 24,845.10
Low: 24,502.15
Close: 24,542.50
Net Change: −174.10 (−0.70%)
🕯 Candle Structure
Real Body: 243.80 pts (Big red candle)
Upper Wick: 58.80 pts
Lower Wick: 40.35 pts
Interpretation
A classic bearish reversal day. Price opened higher, reached a new high, but was aggressively sold off, closing near the day’s low. This large-bodied red candle with small wicks shows clear control by the bears.
Candle Type
🟥 Bearish Marubozu-like Candle
Strong rejection at highs
Bearish dominance confirmed
Lower close signals momentum continuation to the downside
Key Insight
24,845 now acts as a firm resistance.
Break below 24,500 could accelerate correction.
Bulls need to defend 24,500–24,520 zone decisively to avoid further weakness.
🛡 5 Min Intraday Chart
⚔️ Gladiator Strategy Update
ATR: 279.13
IB Range: 243.80 → Medium IB
Market Structure: Balanced
Trades:
🔻 12:50 PM – Short Triggered → 📍 1:1 Target Achieved, but timeout
📌 Support & Resistance Zones
Resistance Levels
24,600
24,625 ~ 24,640
24,660
24,727 ~ 24,737
24,768 ~ 24,800
24,820
24,882
24,894 (Strong Resistance)
Support Levels
24,530 ~ 24,480
24,460
24,420 ~ 24,400
24,365 ~ 24,330
24,245 ~ 24,240
💭 Final Thoughts
The market showcased a classic reversal and punished emotional entries. Despite the gap-up euphoria, technical levels reigned supreme. The break below swing low could signal caution for bulls in the coming sessions.
📌 "Respect the levels, not the emotions. Every bounce is not a bottom; every fall isn’t a crash."
✏️ Disclaimer
This is just my personal viewpoint. Always consult your financial advisor before taking any action.

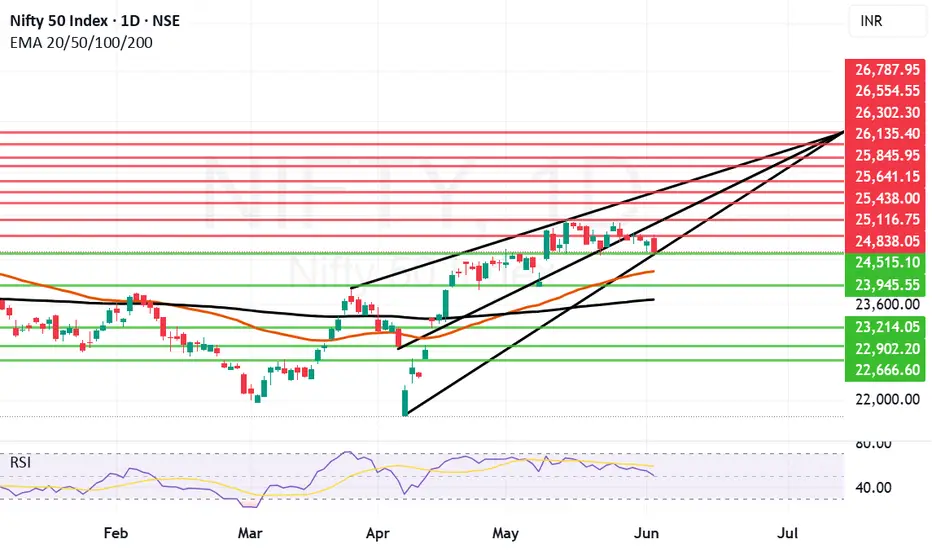
Bull Rally Losing steam as international factors weigh in. The Bull rally that we saw in Nifty in the last one month or so is losing a little steam as international factors related to escalating Russia and Ukraine war and International Tariff war start to weigh in. This made it difficult for Nifty to hold on to levels above 25000 after making a high of 25116 in the current rally. After making a high it is any substantial rally would try to consolidate and find a reasonable bottom from where it can launch again. Verifying a solid support is necessary for rally to move forward.
The supports for Nifty currently are at: 24515, 24185 (Mother line important support), 23945, 23689 (Father line important support). If 23689 is broken the bears will be very active again and can potentially drag down nifty to 23214, 22902 or even 22666. So 24185 and 23689 are important levels for Nifty to hold.
The Resistances for Nifty currently are at: 24838, 25116 (Important Resistance level, recent high). Sustaining above 25116 and Nifty closing above it can enable next leg of the rally which can take us in future to next resistance levels of 25438, 25641, 25845 and 26K+ levels.
The market might be speculating Russian response to Ukraine Drone attack. The scale of Russian attack if it happens will determine the movement of market. The local factors are mostly in favour of Indian markets. So long term investors should not worry. Traders and short term investors should avoid taking unnecessary risk as situation on international front. Geo-Political risk in the subcontinent, at Israel front and Between Russia and other EU nations should be on the hindsight of any decision making. Additionally there are rising number of COVID cases in India which can also become a factor which can effect market sentiment.
Disclaimer: The above information is provided for educational purpose, analysis and paper trading only. Please don't treat this as a buy or sell recommendation for the stock or index. The Techno-Funda analysis is based on data that is more than 3 months old. Supports and Resistances are determined by historic past peaks and Valley in the chart. Many other indicators and patterns like EMA, RSI, MACD, Volumes, Fibonacci, parallel channel etc. use historic data which is 3 months or older cyclical points. There is no guarantee they will work in future as markets are highly volatile and swings in prices are also due to macro and micro factors based on actions taken by the company as well as region and global events. Equity investment is subject to risks. I or my clients or family members might have positions in the stocks that we mention in our educational posts. We will not be responsible for any Profit or loss that may occur due to any financial decision taken based on any data provided in this message. Do consult your investment advisor before taking any financial decisions. Stop losses should be an important part of any investment in equity.
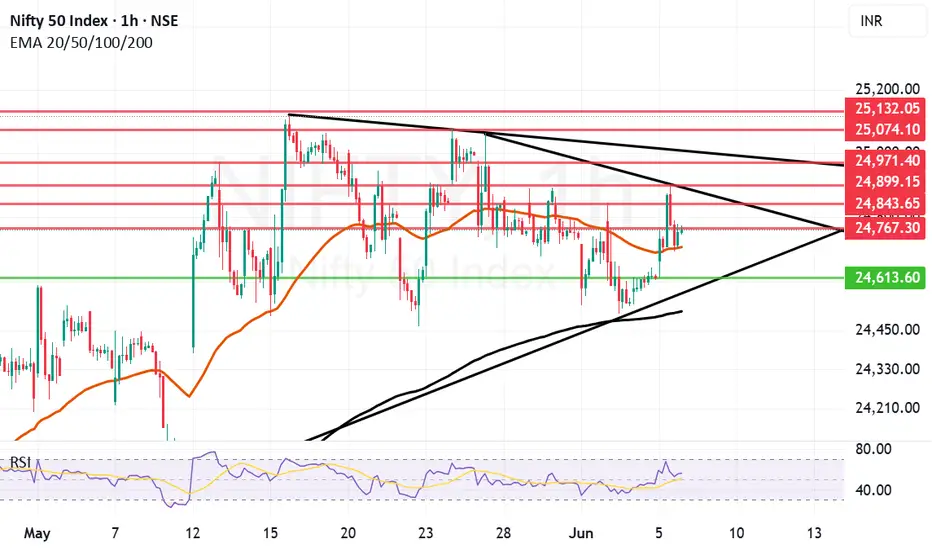
Nifty Bounces from Channel Bottom. Amidst escalation in Ukraine and Russia tussle with Ukraine going on major Drone offensive and Russia likely to respond anytime this week. The escalation can lead to NATO involvement and this can spell a major downside for Global market. The above is just speculation and things can take a different trajectory as well. During such global negative news Indian markets made a low of 24526 but recovered 190 points to close near 24716. This shows the strength of Indian market and shows that we are quiet buoyant.
Resistance for Nifty Remain near: 24763 (Mother Line of Hourly Chart), 24887, 25041 (Mid channel resistance and 25151.
Supports For Nifty Currently remain at: 24637, 24519 (Parallel Channel Bottom) and 24474 (Father Line of Hourly Chart).
If we get a closing below 24474 Bears will have an upper hand and can drag market further down we give the downside levels if we reach there. If we get a closing above 25151 Bulls Will have an Upper hand and can pull the index further upwards we give further upside levels once we reach there.
Disclaimer: The above information is provided for educational purpose, analysis and paper trading only. Please don't treat this as a buy or sell recommendation for the stock or index. The Techno-Funda analysis is based on data that is more than 3 months old. Supports and Resistances are determined by historic past peaks and Valley in the chart. Many other indicators and patterns like EMA, RSI, MACD, Volumes, Fibonacci, parallel channel etc. use historic data which is 3 months or older cyclical points. There is no guarantee they will work in future as markets are highly volatile and swings in prices are also due to macro and micro factors based on actions taken by the company as well as region and global events. Equity investment is subject to risks. I or my clients or family members might have positions in the stocks that we mention in our educational posts. We will not be responsible for any Profit or loss that may occur due to any financial decision taken based on any data provided in this message. Do consult your investment advisor before taking any financial decisions. Stop losses should be an important part of any investment in equity.
Nifty Analysis EOD – June 2, 2025 – Monday🟢 Nifty Analysis EOD – June 2, 2025 – Monday 🔴
“Relaxed day... if you forget the first and last 20 minutes!”
Nifty opened flat with a slightly negative tone and, within the first 20 minutes, collapsed over 200 points, hitting an intraday low of 24,526. However, the day had other plans. A slow and steady recovery followed, with Nifty reclaiming almost all its losses by mid-session. But just when things looked stable, the index shed 88 points in the final 20 minutes, eventually closing at 24,716.60, just 34 points lower than the previous close.
If you ignore the volatility of the first and last few minutes, the day felt calm—almost deceptive. Small and mid-cap stocks, along with Bank Nifty, saw a positive day, showcasing broad market strength despite Nifty’s indecisiveness.
🛡 5 Min Chart with Levels
📌 Diamond Pattern BreakoutAs discussed in yesterday’s note, the diamond pattern on the daily and 5-min chart finally saw a breakout today—and yes, the target was achieved. But let’s be real: with all the action packed into the opening move, most traders (including me) missed the train. A frustratingly textbook pattern—but a tricky execution.
🕯 Daily Time Frame Chart
📊 Daily Candle Breakdown
Open: 24,669.70
High: 24,754.40
Low: 24,526.15
Close: 24,716.60
Change: −34.10 (−0.14%)
Candle Structure:
🟩 Green Candle: Close > Open (46.90 pts body)
🔻 Lower Wick: 143.55 pts – Strong buying at the dip
🔺 Upper Wick: 37.80 pts – Limited rejection from top
Interpretation:Despite closing slightly lower, the candle reflects strong intraday buying after a deep dip. The long lower shadow shows support around 24,520–24,550 is active. Close near the top half signals buyers held their ground after early weakness.
Candle Type:🔨 Hammer-like: Bullish sentiment hidden in the chaos.
Key Insight:
Holding above 24,755 can trigger a fresh bullish leg.
Breach of 24,520 may invite more selling pressure.
🛡 5 Min Intraday Chart
⚔️ Gladiator Strategy Update
ATR: 272.03
IB Range: 191.40 → 🔴 Wide IB
Market Structure: ImBalanced
Total Trades: 0
12:35 – Long signal came, but entry didn’t trigger. No trades taken.
🧭 Support & Resistance Levels
📈 Resistance Zones:
24,727 ~ 24,737
24,768 ~ 24,800
24,820
24,882
24,894
24,920
24,972 ~ 25,000
25,062 ~ 25,070 (5th rejection!)
25,116 ~ 25,128
25,180 ~ 25,212
25,285 ~ 25,399
📉 Support Zones:
24,700
24,660
24,640 ~ 24,625
24,590
24,530 ~ 24,480
24,460
🧠 Final Thoughts
"Structure se hi samjho... market bhale chhup jaye, lekin footprint chhod deta hai."Diamond breakout ho gaya, lekin execution ne dhoka diya. Lesson? Stay ready—patterns repeat, but you only profit if you’re prepared.
✏️ DisclaimerThis is just my personal viewpoint. Always consult your financial advisor before taking any action.
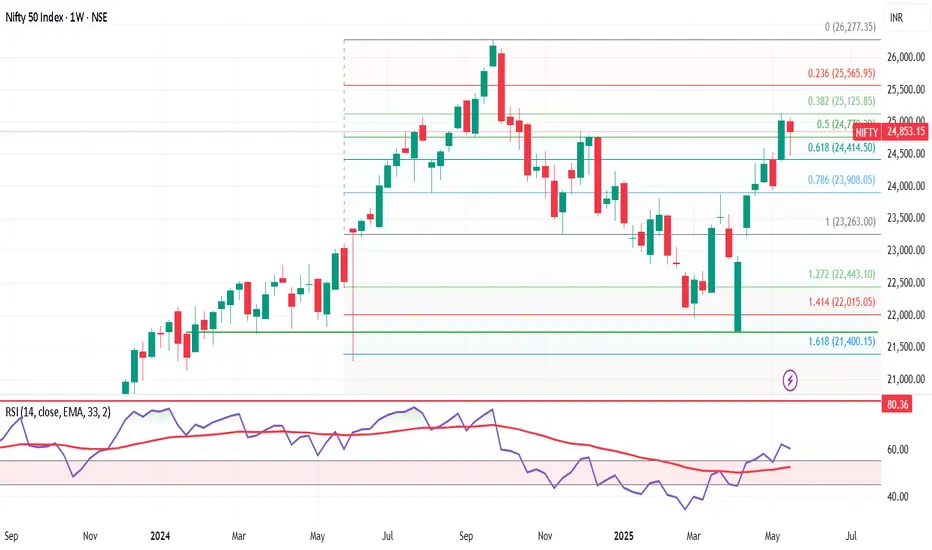
Fibonacci Supports and Resistances Medium to Long term Outlook.Here we have tried to show you Fibonacci supports and resistances for Nifty on Monthly chart with Medium to Long term outlook. Fibonacci retracement suggests the nearby major resistances at 25233.
Crossing this zone and closing above this zone is imperative for proper bull market to return. In such a scenario the next resistances will be at 26277 (Previous All Time high). Closing above 26277 will open the door for the targets of 27K+. The Golden ratio of Fibonacci suggest the cap near 29540 within next 13 to 21 months. Supports for Nifty remain at 24443, 23903, 23375.
Below 23375 Bear market can return and can drag Nifty towards unlikely levels of 22737 or 21743. (This looks unlikely as of now but you can never say never looking at the Tariff wars and not so conducive Geo-Political situation of the subcontinent, Russia-Ukraine, Israel and other factors.)
So one eye of investors should be on macro factors also while looking at rosy micro factors related to Indian markets. While we look forward to making new highs in the next 1 or 2 years. Never forget Stop losses / Trailing stop Losses are best friends of investors. Stop losses protect your capital and trailing stop losses protect your profits.
Disclaimer: The above information is provided for educational purpose, analysis and paper trading only. Please don't treat this as a buy or sell recommendation for the stock or index. The Techno-Funda analysis is based on data that is more than 3 months old. Supports and Resistances are determined by historic past peaks and Valley in the chart. Many other indicators and patterns like EMA, RSI, MACD, Volumes, Fibonacci, parallel channel etc. use historic data which is 3 months or older cyclical points. There is no guarantee they will work in future as markets are highly volatile and swings in prices are also due to macro and micro factors based on actions taken by the company as well as region and global events. Equity investment is subject to risks. I or my clients or family members might have positions in the stocks that we mention in our educational posts. We will not be responsible for any Profit or loss that may occur due to any financial decision taken based on any data provided in this message. Do consult your investment advisor before taking any financial decisions. Stop losses should be an important part of any investment in equity.

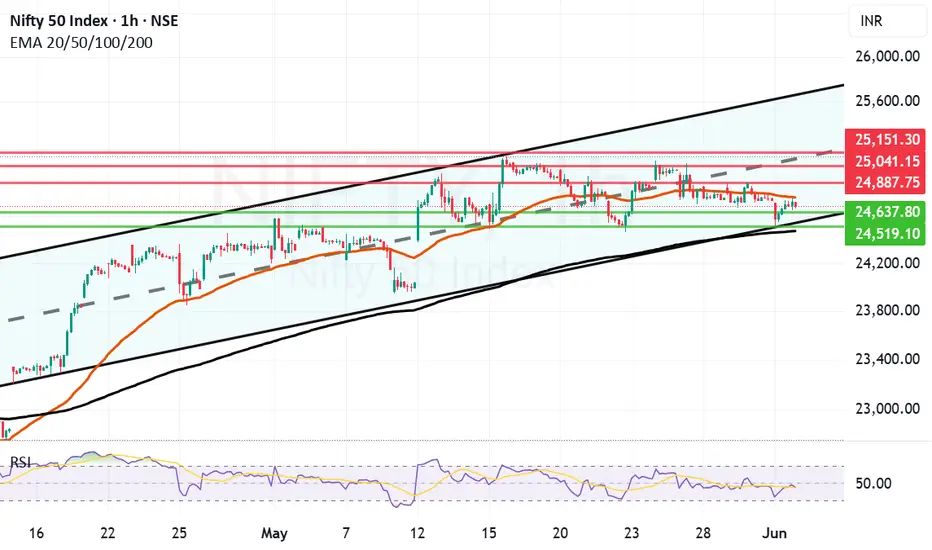
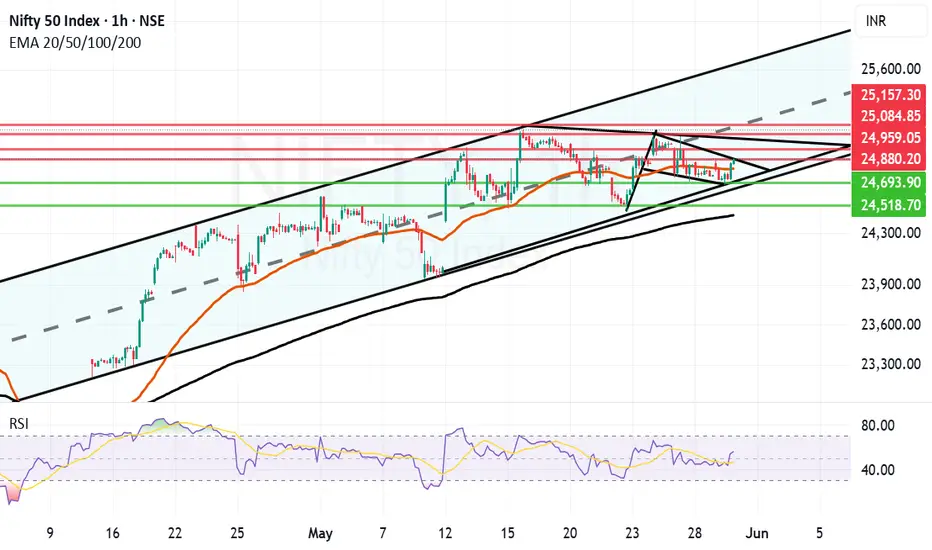
Flag and Pole kind of structure forming in Nifty. There is a very positive looking flag and pole kind of structure forming in Nifty hourly chart. This is within a parallel channel which Nifty has been following since April 15th 2025. This Flag and Pole breakout will come into effect if and only if we get a closing above 24880.
In case of flag and pole breakout happening the future resistances will be near 24959, 25084 and 25157. 25157 again will be a major resistance as it will be the mid of the channel.
The supports for Nifty in case the flag and pole breakout does not take effect are at 24804 (Mother line of hourly chart) 24693, 24518 and finally 24439.
Below 24439 bears can take over the market. Above 25157 Bulls can take over the market. Shadow of the candle is effectively neutral to positive.
Disclaimer: The above information is provided for educational purpose, analysis and paper trading only. Please don't treat this as a buy or sell recommendation for the stock or index. The Techno-Funda analysis is based on data that is more than 3 months old. Supports and Resistances are determined by historic past peaks and Valley in the chart. Many other indicators and patterns like EMA, RSI, MACD, Volumes, Fibonacci, parallel channel etc. use historic data which is 3 months or older cyclical points. There is no guarantee they will work in future as markets are highly volatile and swings in prices are also due to macro and micro factors based on actions taken by the company as well as region and global events. Equity investment is subject to risks. I or my clients or family members might have positions in the stocks that we mention in our educational posts. We will not be responsible for any Profit or loss that may occur due to any financial decision taken based on any data provided in this message. Do consult your investment advisor before taking any financial decisions. Stop losses should be an important part of any investment in equity.
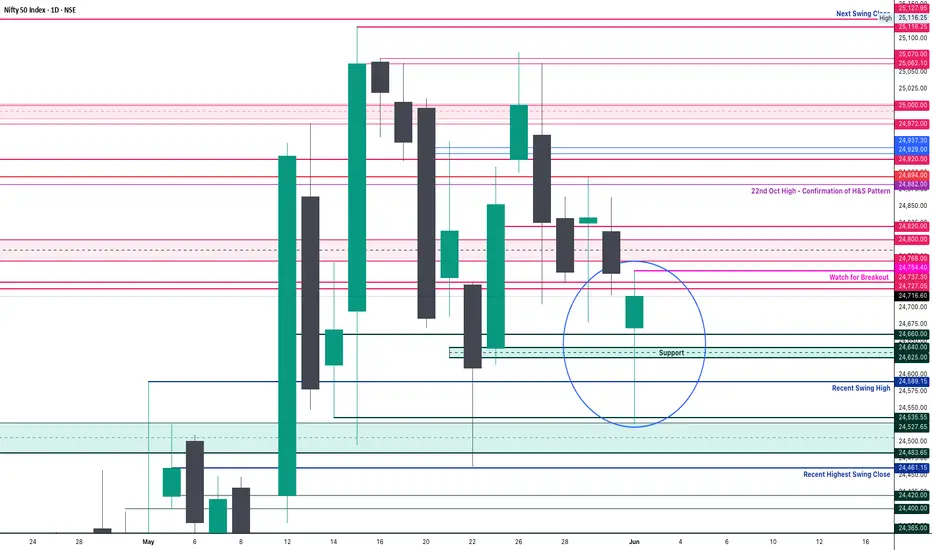
Important Level For Nifty.Here in one hour time frame nifty is coming to get some liquidity as you can see, after getting liquidity nifty may again go higher and make a new high.
Nifty feeling pressure, unable to sustain above 25K levels.Nifty not able to sustain levels above 25K is not a good news. Nifty has to sustain above 25094 level on daily and 25208 on weekly closing for further upward move. Market is not showing confidence due to daily tariff related news coming for global Power house US. So Volatility will remain for a while till everything falls in place.
Right now Nifty is resting near trend line support levels of 24731. If 24731 is broken Bears can drag Nifty towards 24469, 24067 (Mother line Support), 23899 or even 23637 (Father line support). If Nifty can sustain above 25094 then there is a possibility for up move towards 25208 or even 25446 levels. Things are delicately poised right now and proper Bear Vs Bull Tussle is going on.
Shadow of the candle is neutral to negative but any positive news on global front can change the tide in favour of Bulls.
Disclaimer: The above information is provided for educational purpose, analysis and paper trading only. Please don't treat this as a buy or sell recommendation for the stock or index. The Techno-Funda analysis is based on data that is more than 3 months old. Supports and Resistances are determined by historic past peaks and Valley in the chart. Many other indicators and patterns like EMA, RSI, MACD, Volumes, Fibonacci, parallel channel etc. use historic data which is 3 months or older cyclical points. There is no guarantee they will work in future as markets are highly volatile and swings in prices are also due to macro and micro factors based on actions taken by the company as well as region and global events. Equity investment is subject to risks. I or my clients or family members might have positions in the stocks that we mention in our educational posts. We will not be responsible for any Profit or loss that may occur due to any financial decision taken based on any data provided in this message. Do consult your investment advisor before taking any financial decisions. Stop losses should be an important part of any investment in equity.
Nifty50 Market Update – Resistance AlertMy proprietary option pricing model, OptionSigma , identifies 25,200 as a key resistance level in the Nifty50 Index. Until this barrier is decisively broken, I won’t adopt a bullish stance.
🚨 Disclaimer: This is not a trade recommendation. Always conduct thorough research before making any trading decisions.
#nifty

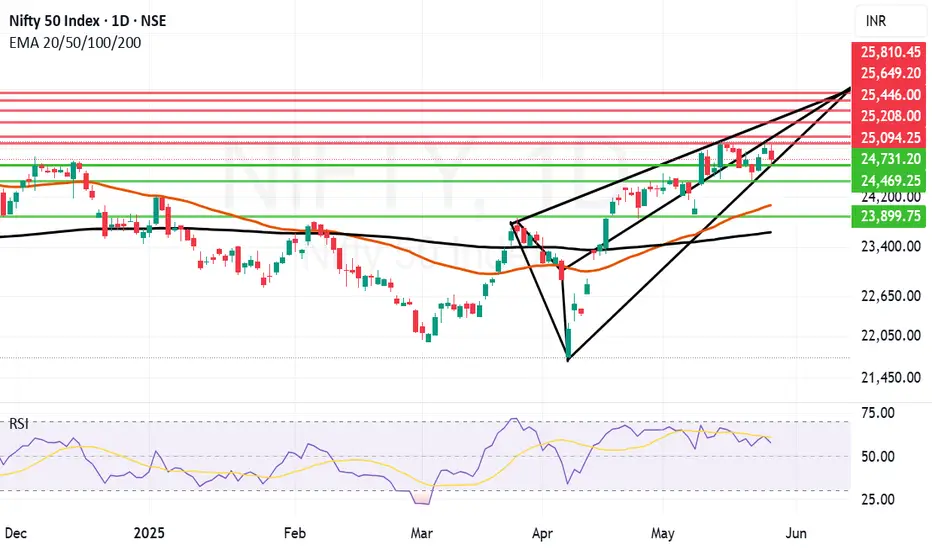
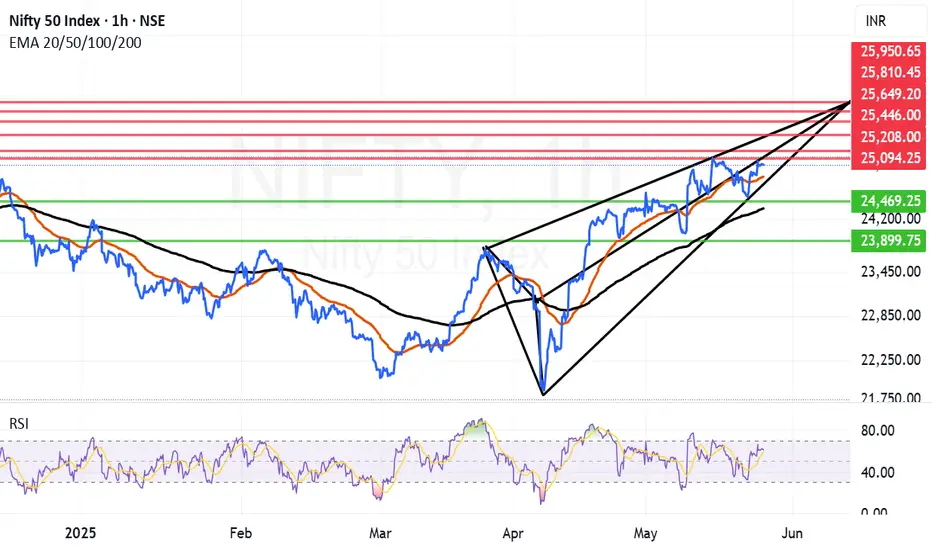
Nifty Trying to Forge ahead after taking Mother Line Support.Nifty is trying to move upwards after taking Mother line support. However there are strong resistances which Nifty needs to conquer in order to move ahead substantially. These resistances are near 25094 and 25208.
Closing above 25208 will confirm the current trend which can tae Nifty close to 26K with other resistances at 25446, 25649 and 25810. Supports for Nifty currently are near 24820 (Mother line support), 24469, 24356 (Father line support) and 23899.
The direction of arrow is clear for medium term unless the arrow is broken on the down side. Nifty is currently forming a positive higher highs, higher lows pattern which is again a positive sign.
Disclaimer: The above information is provided for educational purpose, analysis and paper trading only. Please don't treat this as a buy or sell recommendation for the stock or index. The Techno-Funda analysis is based on data that is more than 3 months old. Supports and Resistances are determined by historic past peaks and Valley in the chart. Many other indicators and patterns like EMA, RSI, MACD, Volumes, Fibonacci, parallel channel etc. use historic data which is 3 months or older cyclical points. There is no guarantee they will work in future as markets are highly volatile and swings in prices are also due to macro and micro factors based on actions taken by the company as well as region and global events. Equity investment is subject to risks. I or my clients or family members might have positions in the stocks that we mention in our educational posts. We will not be responsible for any Profit or loss that may occur due to any financial decision taken based on any data provided in this message. Do consult your investment advisor before taking any financial decisions. Stop losses should be an important part of any investment in equity.
NIFTY : Trading levels and plan for 26-May-2025📊 Nifty Trading Plan – 26-May-2025
Timeframe: 15 Min | Reference Spot Price: 24,845
Gap Opening Threshold: 100+ Points
🚀 Gap-Up Opening (Above 24,974) – 100+ Points
If Nifty opens above the Opening Resistance level of 24,974, it enters a critical resistance zone that may trigger two-sided moves. The area between 25,195 – 25,294 is marked as the Profit Booking Zone / Last Intraday Resistance .
🟥 This zone has historically seen supply, and sharp up-moves may get trapped without strength in broader participation.
✅ Plan of Action:
– Avoid initiating long trades immediately post gap-up unless price shows strong bullish candles above 25,195.
– For intraday buying, wait for a clean 15-min candle close above 25,294 with strength in heavyweights.
– Ideal entry would be on a retest of the 25,195–25,294 zone if price holds.
– Reversal patterns (like Shooting Star / Bearish Engulfing) near 25,195 – 25,294 can offer sell-on-rise opportunities toward 24,974, then 24,845.
– Watch for volume confirmation – avoid shorting just because price is high.
🎓 Educational Note: Gap-ups into strong resistance zones require caution. Momentum without volume and market-wide confirmation often leads to failed breakouts. Let structure confirm before jumping in.
📈 Flat Opening (Between 24,790 – 24,974)
This places Nifty inside the No Trade Zone defined between 24,790 – 24,974.
🟧 This range is uncertain – the index may move sideways with choppy price action and lack of conviction from buyers or sellers.
✅ Plan of Action:
– Stay on the sidelines in the first 15–30 mins.
– Only consider long trades if price breaks and sustains above 24,974, then aim for 25,195 – 25,294.
– For short trades, wait for a clean breakdown below 24,790 with a bearish candle close to ride down to 24,684 and then 24,558.
– Risk reward is best outside this zone, not inside. Patience is key.
🎓 Educational Note: Flat openings in mid-range zones often cause emotional trades. Use this time to assess volume trends, sectoral strength, and structure. Most clean entries happen post-10:15 AM.
📉 Gap-Down Opening (Below 24,684) – 100+ Points
A gap-down below 24,684 pushes Nifty near its immediate supports at 24,558 (Last Intraday Support) and 24,250 – 24,190 (Buyer’s Zone).
🟩 This is a sensitive area where smart money may attempt reversals, especially near 24,250 – 24,190.
✅ Plan of Action:
– Watch for reversal signs (Hammer, Bullish Engulfing) around 24,558 and especially in the Buyer’s Support Zone: 24,250 – 24,190.
– If price finds footing and sustains above 24,558, reversal trades can be initiated with a target back to 24,684 – 24,790.
– A strong breakdown below 24,190 would confirm bearishness – in that case, avoid catching falling knives.
– Only go short below 24,190 on breakdown candle with next target open toward swing lows.
🎓 Educational Note: Gap-downs into major demand areas offer some of the best R:R setups—but only if there's evidence of absorption and reversal structure. Never go long just because price is “low”.
🛡️ Options Trading – Risk Management Tips
✅ Use slightly In-the-Money (ITM) options for better delta movement and less time decay.
✅ Avoid trading in No Trade Zones; theta will eat up your premiums.
✅ Follow the 1–2% capital risk rule – don’t over-leverage in anticipation of a breakout.
✅ Always define your stop loss using the underlying spot level, not just option premium.
✅ Book partial profits once price moves in favor and trail SL for the rest.
✅ If you hit 2 stop-losses in a row, take a break and re-assess the trend.
✅ Monitor OI data and sectoral strength—don’t blindly follow index candles.
📌 Summary & Conclusion
🔹 No Trade Zone: 24,790 – 24,974
🔹 Profit Booking / Resistance Zone: 25,195 – 25,294
🔹 Opening Supports: 24,684 & 24,558
🔹 Strong Buyer’s Support: 24,250 – 24,190
📈 For Gap-Ups, avoid early longs into resistance zones unless breakout is confirmed.
📉 For Gap-Downs, prepare for potential reversal from Buyer’s Support Zone.
🕒 In Flat Openings, wait 15–30 mins to avoid whipsaws inside No Trade Zone.
⚖️ Best trades occur outside the No Trade Zone with price + structure + volume alignment.
⚠️ Disclaimer:
I am not a SEBI-registered analyst. This trading plan is purely for educational purposes. Please conduct your own analysis or consult a SEBI-registered advisor before taking trades.

Weekly Market Wrap: Nifty & S&P 500 Outlook The Nifty closed the week at 24,853, down 166 points from the previous week's close. It traded within a range of 25,062 (high) and 24,462 (low) — perfectly aligning with our forecasted zone of 24,450 – 25,600. On the weekly chart, the index formed an inside candle pattern, signaling consolidation.
Positives: Despite the dip, Nifty continues to hold above the critical support level of 23,800, keeping the medium-term bullish structure intact.
Key Levels to Watch for Next Week:
High/Low to mark: 25,116 – 24,378
Breakout above 25,116 can lead to tests of 25,329 and 25,500 (resistance zones).
Breakdown below 24,378 could retest 23,800 and 23,600.
A weekly close below 23,800 could spell trouble for bulls, opening doors for deeper correction towards 22,800 and 22,100.
Trend Analysis:
Monthly Timeframe: Bearish
Daily Timeframe: Turned Bearish
Weekly Timeframe: Still Bullish
Conclusion: Stay cautious below 24,378 — volatility may rise if this level is breached.
S&P 500 Weekly Snapshot:
The S&P 500 ended the week at 5,802, down 156 points. Once again, it faced stiff resistance around the 5,980 mark — a historically significant level where the index began its downward move in March 2025.
Geopolitical Impact: Markets remain jittery amid escalating global trade tensions and Trump’s tariff war, likely keeping volatility high over the next 2–3 weeks.
Key Support Zones:
Immediate support at 5,700
Close below 5,700 may trigger declines to 5,551, 5,458 (key Fibonacci support), and 5,392
Bullish Breakout Scenario:
Sustained close above 6,000 is required to resume bullish momentum
Upside targets: 6,013, 6,082, 6,147 (All-Time High), and potentially 6,225
Final Takeaway:
Both Nifty and S&P 500 are at critical junctures. With technical patterns pointing to mixed signals and geopolitical events adding fuel to volatility, traders should stay alert and focus on key breakout and breakdown levels.
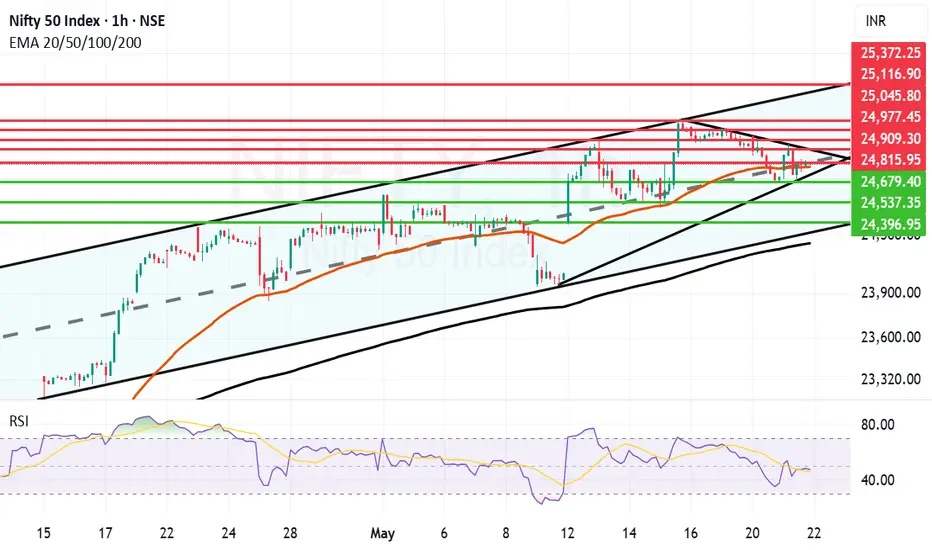
Parallel Channel and other Technicals Explained on a Nifty ChartWe have tried to draw a parallel channel on Nifty hourly chart. The chart indicates that we are just below the mid channel line. The mid channel line will act as a resistance if the price is below the same and will act as a support if the price is above it. Right now it is acting as a resistance. Top of the channel always acts as a resistance and bottom of the channel always acts as a support. Additionally there are historic resistances and supports which indicate the other levels which may act as support or resistance. There are also Mother and Father lines (50 and 200 EMA)(EMA = Exponential Moving Average).
To understand in detail how parallel channel works or how supports and resistance are derived or what is Mother, Father and Small Child theory. I would recommend you my book The Happy Candles Way to Wealth creation. By reading this book you can understand all these concepts with ease. You can additionally understand what is fundamental and technical analysis and how to do it. You will also get to understand the dos and the don'ts of investment in equity by reading various chapters on Behavioural Finance. Overall it is a value for money book available on Amazon in Paperback and Kindle version. The book is also available on Google play book and other E-book stores. You can also contact us for getting the copy of it. The Happy Candles way is one of the highest rated books in the category and you can go through the reviews of the book on Amazon before purchasing it.
Based on Parallel Channel, Supports and Resistances, Mother Father and Small child theory resistances and supports of Nifty remain at.
Nifty Resistances Remain at: 24815, 24909, 24977, 25045 and 25116. The channel top resistance for the current parallel channel is around 25372.
Nifty Supports Remain at: 24780 (Mother Line Support), 24679 and 24537. The Channel Bottom support is currently around 24396. 24247 is the most important Father line support.
Shadow of the candles currently is neutral. Indicating Nifty can still go in any direction. A pennant like structure (Triangle is also formed). This indicates that Breakout or Breakdown of this triangle or pennant can take Nifty a long way on either side. Nifty is currently squeezing in the pennant with limited space. Usually when the space is limited a Breakout can happen in either direction.
Disclaimer: The above information is provided for educational purpose, analysis and paper trading only. Please don't treat this as a buy or sell recommendation for the stock or index. The Techno-Funda analysis is based on data that is more than 3 months old. Supports and Resistances are determined by historic past peaks and Valley in the chart. Many other indicators and patterns like EMA, RSI, MACD, Volumes, Fibonacci, parallel channel etc. use historic data which is 3 months or older cyclical points. There is no guarantee they will work in future as markets are highly volatile and swings in prices are also due to macro and micro factors based on actions taken by the company as well as region and global events. Equity investment is subject to risks. I or my clients or family members might have positions in the stocks that we mention in our educational posts. We will not be responsible for any Profit or loss that may occur due to any financial decision taken based on any data provided in this message. Do consult your investment advisor before taking any financial decisions. Stop losses should be an important part of any investment in equity.
Nifty Analysis EOD – May 20, 2025 – Tuesday🟢 Nifty Analysis EOD – May 20, 2025 – Tuesday 🔴
Breakout Denied. Breakdown Delivered.
📈 Nifty SummaryAfter two sessions of tight-range traps, the long-awaited move finally played out today—and it was all about the bears.
Despite a 50-point gap-up start at 24,996 (just shy of the psychological 25,000 level), Nifty quickly reversed. The open was inside the resistance zone (24,980–25,000), and ignoring a minor 15-point wick, it resembled a classic Open = High (OH) trap.
By 35 minutes into the session, the index had already broken PDL and S1, hitting a low of 24,863, only to bounce 100+ points back toward 24,967—again rejected from just below 25K. This rejection triggered a sharp vertical fall, with a steep 35° downward slope, showing no pause, no VWAP reversion—just pure directional intent.
The downside breach hit multiple key levels:✅ 24,920✅ PDL✅ 24,882✅ 24,800–24,768 zone✅ and finally marked a low of 24,669, right at our 24,660 support level from yesterday’s map.
In yesterday’s report, we noted:
“A move below 24,882 could accelerate downside momentum. All eyes on 24,800 next.”✅ Targets 24,800 and 24,732 both achieved today.
🕯 Daily Time Frame Chart
🕯 Daily Candle Breakdown
Candle Type: Strong Bearish (near Marubozu)
Intraday Range: 340 points
Upper Wick: ~15 pts (negligible)
Lower Wick: ~44 pts (also insignificant vs range)
Candle Interpretation: Textbook bearish Marubozu-type (near full-body)
📉 Closing Concerns:
🔻 Below 24,732, the 0.618 Fib of May 15th candle
🔻 Below May 15 Open
❌ No retracement or end-of-day bounce
These signals point to a structurally weak close and increase the probability of further downside extension.
📊 Bias Going ForwardAs of today, there are no signs of buyers stepping in. If 24,670 (today's low) breaks, it could open the gates to test:
🧨 24,640–24,625 zone (watch closely during IB)
🧨 Below that → 24,535 / 24,500 / 24,480
On the upside, any pullback will face hurdles at:
🛑 24,768–24,800 (strong resistance zone)
🛑 24,882 / 24,920
Let the first half of tomorrow's session guide the tone. Any sustained hold above 24,800 might stall the fall. Else, the drift may continue.
🛡 25 Min Time Frame Chart
🛡 5 Min Intraday Chart
🛡 Gladiator Strategy Update
Strategy Parameters
ATR: 331.49
IB Range: 146.95 → 🟡 Medium IB
Market Structure: ⚖️ Balanced
Trade Highlights
🔻 1st Short Trigger: 11:55 – Trapped, Loss Booked
✅ 2nd Short Trigger: 12:45 – Target Achieved (Risk:Reward 1:3.5)
📊 Total Trades: 2
📍 Support & Resistance Levels
🟩 Resistance Zones:
24,768 ~ 24,800
24,882
24,920
24,980 ~ 25,000
25,062 ~ 25,070
🟥 Support Zones:
24,660
24,640 ~ 24,625
24,590
24,530 ~ 24,480
24,460
🔮 What’s Next?The market has broken key fib and candle support zones from the May 15th rally. If there's no defence early tomorrow, the fall may intensify.
Keep an eye on 24,640–24,625 during IB. Holding above could invite some short covering. But failure here can extend toward 24,500 and below.
🧠 Final ThoughtsThe market gave us what it hinted at yesterday—a fast break once 24,882 gave way. But with no bounce, no defence, and a full-body bear candle—the pressure is still on.
“Markets don't always roar before falling. Sometimes, they whisper, then collapse.”
✏️ DisclaimerThis is just my personal viewpoint. Always consult your financial advisor before taking any action.

Nifty Still near the top of Parallel Channel. Nifty is consolidating near the top of the parallel channel and searching for momentum for getting a clear breakout. Till it regains the momentum and Mojo the upside looks limited. The current resistances it is facing is near 25068. Once we get a closing above the same there is possibility of some upside. In case we get a closing above 25068 the next resistances will be near 25134 and 25290. 25290 is the point above which we have a clear channel top Breakout. We will wait for that to happen for giving further resistances. The supports for Nifty are currently near 24924, 24761 (Mother Line Support of Hourly chart). If we get a closing below 24761 the bears will come back into the game and can drag the Nifty further towards the levels of 24647, 24509, 24259 or even 24162. 24162 is a Father line support of hourly chart. A closing below this levels can bring Bears in a total action mode. We will comment about further supports if by chance we get a closing below this level.
Disclaimer: The above information is provided for educational purpose, analysis and paper trading only. Please don't treat this as a buy or sell recommendation for the stock or index. The Techno-Funda analysis is based on data that is more than 3 months old. Supports and Resistances are determined by historic past peaks and Valley in the chart. Many other indicators and patterns like EMA, RSI, MACD, Volumes, Fibonacci, parallel channel etc. use historic data which is 3 months or older cyclical points. There is no guarantee they will work in future as markets are highly volatile and swings in prices are also due to macro and micro factors based on actions taken by the company as well as region and global events. Equity investment is subject to risks. I or my clients or family members might have positions in the stocks that we mention in our educational posts. We will not be responsible for any Profit or loss that may occur due to any financial decision taken based on any data provided in this message. Do consult your investment advisor before taking any financial decisions. Stop losses should be an important part of any investment in equity.

Nifty Analysis EOD – May 19, 2025 – Monday🟢 Nifty Analysis EOD – May 19, 2025 – Monday 🔴
Silence Before the Storm? A “Double Distribution” Kind of Day
📈 Nifty Summary
Another quiet yet deceptive start to the week as Nifty opened flat-to-negative (-14 points) but quickly formed a 92-point wide 5-minute candle at the open. That set the tone for the entire day—a tight, trapped market trading within this early range until post-2 PM.
Things got interesting later, as Nifty breached its IB Low, Previous Day Low (PDL), and closed decisively below key support zones, finally taking support near 24,920 (day’s low: 24,916.65).
The structure fits the classic textbook term—a “Double Distribution Day”, where the index transitions into a new value area in the second half. Option writers erased premiums on both sides, frustrating breakout traders and intraday scalpers alike.
25Min Time Frame Chart:
Daily Time Frame Chart:
🕯 Daily Candle Breakdown
Candle Type: Bearish with late-session breakdown
Day Type: 📘 Double Distribution Day
Key Breakdown Levels: IB Low, CDL, PDL
Support Held: 24,920 zone
🕵️♂️ Observation of the Day
Is this just a pause… or the calm before a storm?
Though there's no strong reversal signal yet, subtle clues emerge:
🔎 On the 25-minute chart, the 13:25 candle was the first to close below the 24,980–25,000 support zone.
📉 Post-PDL breakdown, the retracement attempt was shallow, and price remained under S1 and PDL levels, which hints at weak buying interest.
📊 Bias Going Forward
No reversal yet. Trend watchers should stay patient.
But given price action and weak retracements, the bias tilts toward a deeper retracement, possibly toward the 24,800 zone in the next session. Until strong bullish follow-through is seen, expect continued corrective movement.
5 Min Time Frame Chart:
🛡 Gladiator Strategy Update
Strategy Parameters
ATR: 330.48
IB Range: 92.9 → 🟠 Small IB
Market Structure: ⚖️ Balanced
Trade Highlights
⏰ 1st Short Trigger: 14:00
❌ Trade Timed Out → Loss Booked
📊 Total Trades: 1
📍 Support & Resistance Levels
🟩 Resistance Zones:
24,980 ~ 25,000
25,062 ~ 25,070
25,116 ~ 25,128
25,180 ~ 25,212
25,285
25,399
25,485 ~ 25,511
🟥 Support Zones:
24,920
24,882
24,800 ~ 24,768
24,660
24,590
24,530 ~ 24,480
🔮 What’s Next?
No storm yet, but the structure is weakening quietly. Until the bulls reclaim 25,000 decisively, the short-term path of least resistance appears lower.
A move below 24,882 could accelerate downside momentum. All eyes on 24,800 next.
🧠 Final Thoughts
Markets aren’t always noisy when they turn. Watch the subtle signs. For now, retracement bias stays—but don’t front-run reversals.
“Strong trends may pause quietly. It’s the silence that often precedes the sharpest moves.”
✏️ Disclaimer
This is just my personal viewpoint. Always consult your financial advisor before taking any action.

18.5.25 NIFTY Bullish18.5.25
NIFTY
CMP: 25019.80
BUY Above: 25120
Sl: 24494
Tgt: 25116 / 26275
I am not SEBI registered analyst. Views expressed here are for educational purposes only. Please consult your professional financial advisor before investing. We are not responsible for your profits / gains if any.

Weekly Market Wrap: Nifty Surges Past 25,000 – What's Next? The Nifty 50 index closed the week at 25,019, posting an impressive 1,000-point rally from the previous week’s close. The index made a high of 25,116 and a low of 24,378. The rally was driven by short covering and a surprise truce between India and Pakistan, which injected a wave of optimism into the market.
More importantly, Nifty broke out of the consolidation range of 23,200–24,600, closing strong above the psychologically significant 25,000 mark – a clear sign of bullish sentiment.
What to Expect Next Week (Outlook May 20–24)
Expected Range: 24,450 – 25,600
A breakout above 25,600 could open the doors for a retest of the all-time high (ATH) at 26,277.
As long as Nifty trades above 23,800, the broader trend remains intact.
Monthly Chart Patterns to Watch
A bullish "W" pattern could be forming, which ideally would require a pullback from current levels before resuming upward.
On the flip side, a bearish "M" pattern may emerge if the index tests ATH and faces rejection, which could trigger a sharp correction of 2,500–2,600 points.
For now, I remain cautious until the monthly time frame confirms a clear bullish breakout.
Global Markets Check: S&P 500 Eyes Key Resistance
The S&P 500 closed at 5,958, gaining 300 points week-on-week. As anticipated, a breakout above 5,770 propelled the index to meet all short-term targets of 5,821 / 5,850 / 5,900.
Key Level to Watch: 6,013
This is a major Fibonacci resistance — the same level where the market started correcting back on March 3, 2025.
A weekly close above 6,013 would be bullish, potentially triggering rallies toward 6,091 / 6,142 / 6,225.
However, a breakdown below this week’s low of 5,786 would confirm a failed breakout, with downside targets at 5,637 / 5,551 / 5,458.
Momentum traders, get ready – sharp moves are coming either way!
