Good turnaround by market as expected from the channel bottom.We had given a message that the market was nearing the bottom and there can be a turnaround sooner than later and market turned around today. This bounce can be currently seen as a technical bounce but it can become a full fledged fightback by bulls if it crosses key resistance levels of Mother line, Father line and Mid-channel resistance. These are the 3 key resistances in front of us currently. All eyes on the important trade deal announcements and with US and China which are on going any news on that from can disrupt the market proceedings in either way. Support and resistance levels for Nifty are as under:
Key Nifty Resistances: 24849 (Trend line resistance), 24922 (Motherline Resistance of hourly chart), 25028, 25070 (Father line resistance), 25189 (Mid-channel resistance), 25243 (Very important resistance for Bulls to conquer). Above 25243 Bulls can gain control of Nifty.
Key Support levels: 25741, 25627 (Channel bottom Support), 24519.
Disclaimer: The above information is provided for educational purpose, analysis and paper trading only. Please don't treat this as a buy or sell recommendation for the stock or index. The Techno-Funda analysis is based on data that is more than 3 months old. Supports and Resistances are determined by historic past peaks and Valley in the chart. Many other indicators and patterns like EMA, RSI, MACD, Volumes, Fibonacci, parallel channel etc. use historic data which is 3 months or older cyclical points. There is no guarantee they will work in future as markets are highly volatile and swings in prices are also due to macro and micro factors based on actions taken by the company as well as region and global events. Equity investment is subject to risks. I or my clients or family members might have positions in the stocks that we mention in our educational posts. We will not be responsible for any Profit or loss that may occur due to any financial decision taken based on any data provided in this message. Do consult your investment advisor before taking any financial decisions. Stop losses should be an important part of any investment in equity.
Niftyparallelchannel
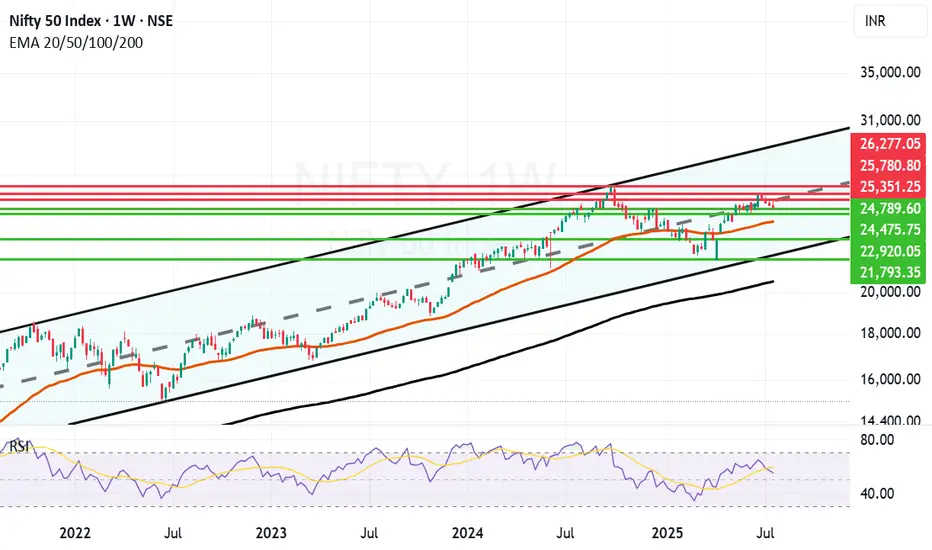
Long term Nifty Outlook Still upbeat. Long term outlook of Nifty is still upbeat. As you can see in the parallel channel in the weekly chart of Nifty. As you can see in the weekly chart Nifty attempted to break free above the Mid-Channel resistance went above it briefly but due to various geopolitical, Tariff and earning related concerns has not yet been successful. In a few years time the channel top can be around 30K and channel bottom seems to be around 21K. Supports for Nifty currently are near 24789, 24475, 23969 (Mother Line support of Weekly chart), 22920 and 21793 (Channel Bottom.) Below that 200 Weeks EMA ot the Father line is at 20577. Resistances for Nifty with long term perspective remain at 25351, 25780 and previous All time high of 26277. Once we get a weekly or monthly closing above 26277 the doors towards 27K+ will open.
Disclaimer: The above information is provided for educational purpose, analysis and paper trading only. Please don't treat this as a buy or sell recommendation for the stock or index. The Techno-Funda analysis is based on data that is more than 3 months old. Supports and Resistances are determined by historic past peaks and Valley in the chart. Many other indicators and patterns like EMA, RSI, MACD, Volumes, Fibonacci, parallel channel etc. use historic data which is 3 months or older cyclical points. There is no guarantee they will work in future as markets are highly volatile and swings in prices are also due to macro and micro factors based on actions taken by the company as well as region and global events. Equity investment is subject to risks. I or my clients or family members might have positions in the stocks that we mention in our educational posts. We will not be responsible for any Profit or loss that may occur due to any financial decision taken based on any data provided in this message. Do consult your investment advisor before taking any financial decisions. Stop losses should be an important part of any investment in equity.
Can Reliance and Banks turn Nifty around? do or die Monday. Nifty as of now has taken support at Mother line in daily chart. As expected in my Yesterday's message. So Hopefully if Big Banks Results are in line tomorrow we might see Nifty going upwards from Monday.
Mota Bhai just announced the results. EBITDA is slightly less than expected but Net Profit and Revenue is much better than Market expectation. In my view market should react positively to this result.
Supports For Nifty remain at 24932 (Mother line), 24759, 24503. As indicated earlier if we get a closing below 24503 we may see a Fall towards 24106 or 23929 (In unlikely circumstances).
Nifty Resistances remain at: 25035, 25248, 25400 and 25613 (Channel top Resistance).
Results for tomorrow
HDFC BANK
ICICIBANK
AUSMALL BANK
RBL BANK
UNION BANK
YES BANK
CENTR BANK
PUNJA BANK
CENTR BANK
So it seems like a Do or Die Monday on cards. Shadow of the candle looks neutral as of now.
Disclaimer: The above information is provided for educational purpose, analysis and paper trading only. Please don't treat this as a buy or sell recommendation for the stock or index. The Techno-Funda analysis is based on data that is more than 3 months old. Supports and Resistances are determined by historic past peaks and Valley in the chart. Many other indicators and patterns like EMA, RSI, MACD, Volumes, Fibonacci, parallel channel etc. use historic data which is 3 months or older cyclical points. There is no guarantee they will work in future as markets are highly volatile and swings in prices are also due to macro and micro factors based on actions taken by the company as well as region and global events. Equity investment is subject to risks. I or my clients or family members might have positions in the stocks that we mention in our educational posts. We will not be responsible for any Profit or loss that may occur due to any financial decision taken based on any data provided in this message. Do consult your investment advisor before taking any financial decisions. Stop losses should be an important part of any investment in equity.
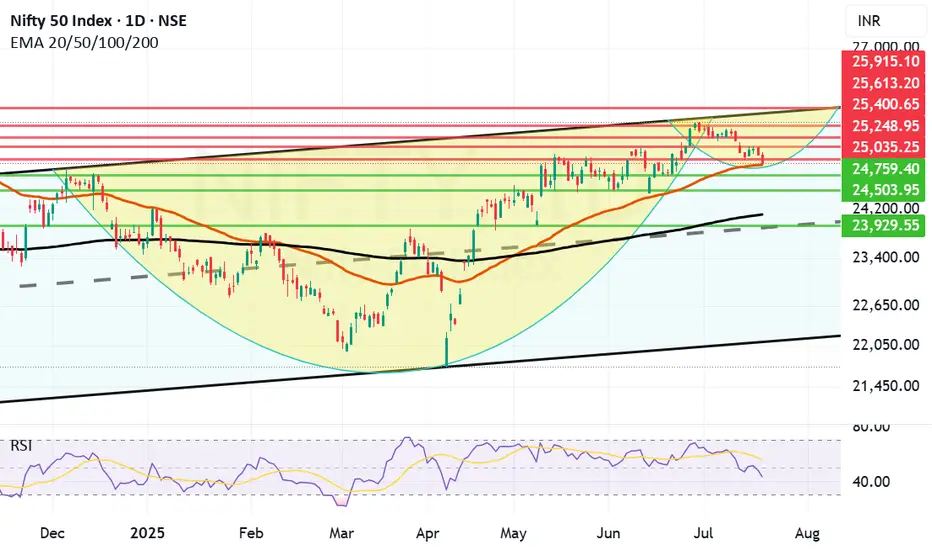
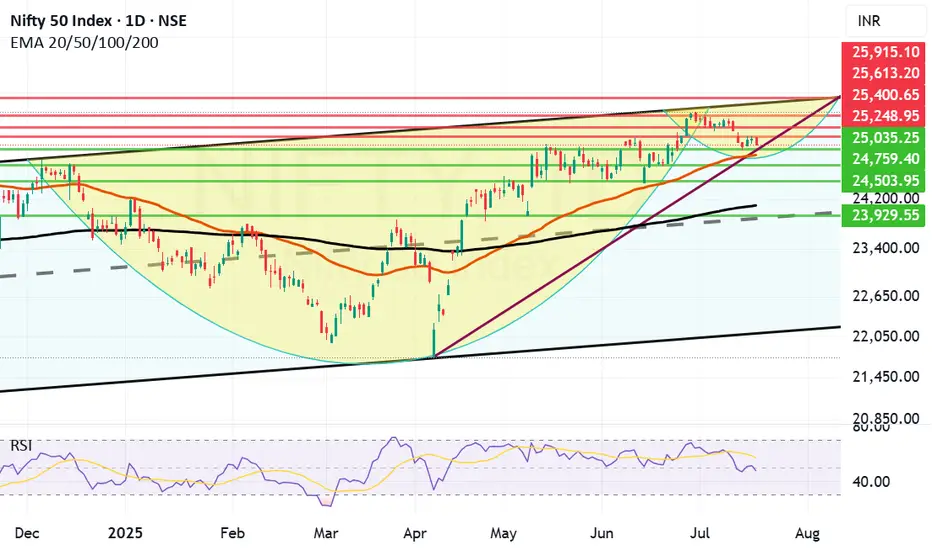
If Mother Line Support will hold, we might see a C&H formation. Although we saw a negative closing today, the chart suggests that if Mother line support will hold we might see a reversal and a Cup and Handle Formation in the near future. Cup and Handle formation is a great pattern which can help us reach the previous high and surpass it. If it happens or not only time can tell.
Supports For Nifty right now remain at: 25035, 24930 (Important Mother Line Support of Daily chart), 24759 and 24503. If 24503 is broken then there will be overall weakness in the market and we can see Nifty plummeting to 24097 (Father Line Support of Daily chart). Just below 24907 there will also be the mid channel support of 23929. (Just in case we reach there).
Resistances For Nifty Remain at: 25248, 25400, 25613 and 25915 seems to be the channel top as of now.
Nifty is delicately placed and the support of 24930 and Resistance of 25248 are the key levels to be watched. Above 25248 Bulls become strong. Below 24930 Bears become strong. Right now we are in no man's land with shadow of the candle slightly negative. If we see a bounce tomorrow or from the Mother line the shadow will has potential to turn positive later in the day tomorrow or next week.
Short term Outlook: Neutral to negative.
Medium Term Outlook: Neutral to Positive.
Long Term Outlook: Positive.
Disclaimer: The above information is provided for educational purpose, analysis and paper trading only. Please don't treat this as a buy or sell recommendation for the stock or index. The Techno-Funda analysis is based on data that is more than 3 months old. Supports and Resistances are determined by historic past peaks and Valley in the chart. Many other indicators and patterns like EMA, RSI, MACD, Volumes, Fibonacci, parallel channel etc. use historic data which is 3 months or older cyclical points. There is no guarantee they will work in future as markets are highly volatile and swings in prices are also due to macro and micro factors based on actions taken by the company as well as region and global events. Equity investment is subject to risks. I or my clients or family members might have positions in the stocks that we mention in our educational posts. We will not be responsible for any Profit or loss that may occur due to any financial decision taken based on any data provided in this message. Do consult your investment advisor before taking any financial decisions. Stop losses should be an important part of any investment in equity.
Nifty has taken support at 25K but can the support hold?Nifty today took a meaningful support at 25001 and bounced close to 25082. However ending the was in the negative by 67.55 points. RSI today went as low as 13.52 indication of oversold market. IT was a major drag after result that market did not like.
Now the resistances in front of Nifty are at 25106, Father Line Resistance at 25106, 25234, Mother Line Resistance at 25297, 25403 and finally 25543. Supports for Nifty remain at 25K, 24866 Chanel Bottom support and finally 24752. Below 24752 Bears can totally take control of the market if we reach there.
Things are in balance right now with Mid-cap, Small-cap starting to see some buying. If IT can hold the levels we will see growth from here. If IT index further caves in and other indices do not support we can see a down side. Shadow of the candle right now is neutral to negative.
Disclaimer: The above information is provided for educational purpose, analysis and paper trading only. Please don't treat this as a buy or sell recommendation for the stock or index. The Techno-Funda analysis is based on data that is more than 3 months old. Supports and Resistances are determined by historic past peaks and Valley in the chart. Many other indicators and patterns like EMA, RSI, MACD, Volumes, Fibonacci, parallel channel etc. use historic data which is 3 months or older cyclical points. There is no guarantee they will work in future as markets are highly volatile and swings in prices are also due to macro and micro factors based on actions taken by the company as well as region and global events. Equity investment is subject to risks. I or my clients or family members might have positions in the stocks that we mention in our educational posts. We will not be responsible for any Profit or loss that may occur due to any financial decision taken based on any data provided in this message. Do consult your investment advisor before taking any financial decisions. Stop losses should be an important part of any investment in equity.
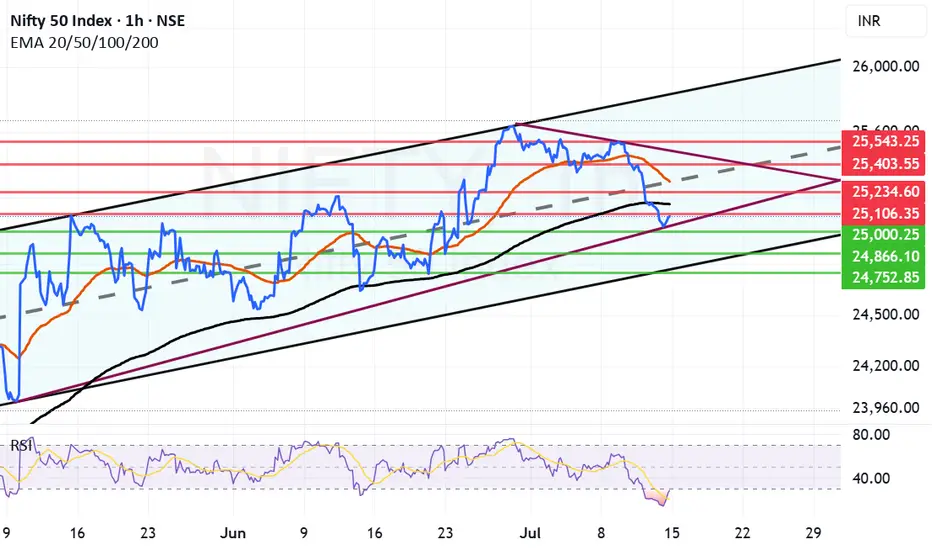
Nifty approaching Mid-channel support zone now. Nifty after a 120 point negative closing is entering an important support zone. This support zone has 3 layers. The First of the support lies at 25322 which is just above the mid-channel. The second for Nifty is near 25222 which is just below the mid channel support.
There is a possibility of bounce either from the current level or either of these 2 levels. If we get a closing below 25322 then there is a possibility that bears might try to pull Nifty down towards 25167 which is the Father line or 200 Hours EMA.
The resistances for Nifty remain at 25404, 25437 which is the Mother line or 50 hours EMA. Post that there are resistances at 25477, 25551 and 25641. Closing above 25641 is required for Nifty to fly towards 26K levels.
Disclaimer: The above information is provided for educational purpose, analysis and paper trading only. Please don't treat this as a buy or sell recommendation for the stock or index. The Techno-Funda analysis is based on data that is more than 3 months old. Supports and Resistances are determined by historic past peaks and Valley in the chart. Many other indicators and patterns like EMA, RSI, MACD, Volumes, Fibonacci, parallel channel etc. use historic data which is 3 months or older cyclical points. There is no guarantee they will work in future as markets are highly volatile and swings in prices are also due to macro and micro factors based on actions taken by the company as well as region and global events. Equity investment is subject to risks. I or my clients or family members might have positions in the stocks that we mention in our educational posts. We will not be responsible for any Profit or loss that may occur due to any financial decision taken based on any data provided in this message. Do consult your investment advisor before taking any financial decisions. Stop losses should be an important part of any investment in equity.
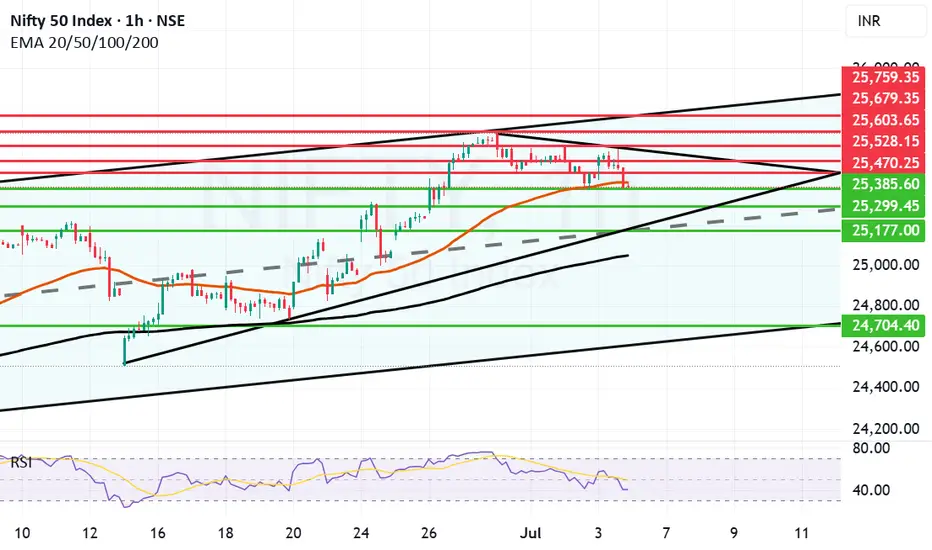
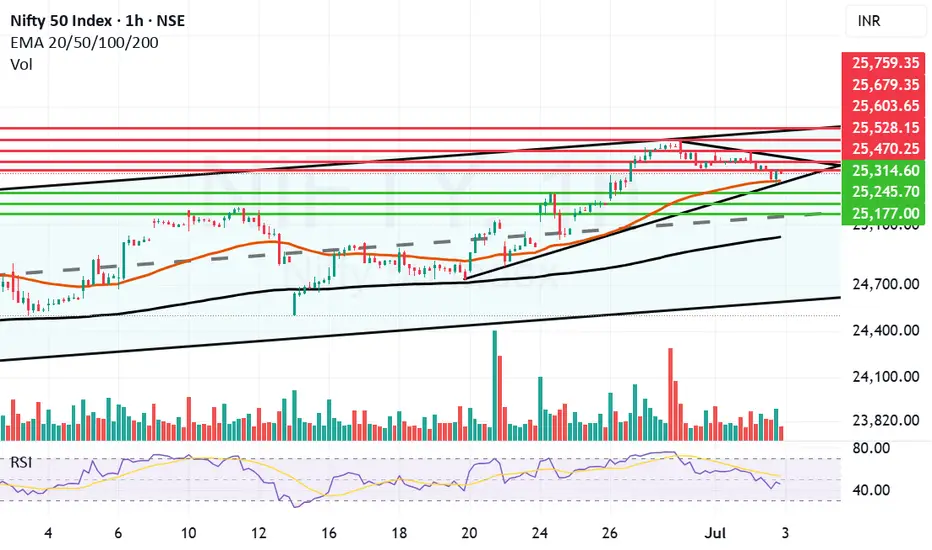
Nifty facing strong resistance between 25587 and 25500. Nifty today again failed to hold levels above 25500 as it made a high of 25587 and closed at 25405. Closing almost 182 point from its high today and 48 points down from yesterday. This is a worrying sign even if just slightly as for moving towards 26K we need a strong closing of the week at least above the Mother line. Nifty closed just below Motherline today which is showing some weakness in the rally which seems to be losing direction. The fear of Tariffs seems to be taking toll on Bulls whereas bears are currently gaining strength. The closing we get tomorrow will indicate a definitive direction to Nifty.
The Supports for Nifty currently remain at: 25385, 25299, 25177 (strong trend line support) and finally we will have Father line support of Hourly candles which is at 25050. Closing 25050 below will have potential to drag Nifty further down towards 24700 which is again a strong Channel bottom support.
The Resistances for Nifty currently remain at: 25416 (Mother line Resistance), 25470, The zone between 25500 and 25587 is a strong Trend line resistance. A closing above 25587 will have potential to take Nifty towards 25603, 25679 or even 25759 (Which is again a strong Channel top resistance).
Disclaimer: The above information is provided for educational purpose, analysis and paper trading only. Please don't treat this as a buy or sell recommendation for the stock or index. The Techno-Funda analysis is based on data that is more than 3 months old. Supports and Resistances are determined by historic past peaks and Valley in the chart. Many other indicators and patterns like EMA, RSI, MACD, Volumes, Fibonacci, parallel channel etc. use historic data which is 3 months or older cyclical points. There is no guarantee they will work in future as markets are highly volatile and swings in prices are also due to macro and micro factors based on actions taken by the company as well as region and global events. Equity investment is subject to risks. I or my clients or family members might have positions in the stocks that we mention in our educational posts. We will not be responsible for any Profit or loss that may occur due to any financial decision taken based on any data provided in this message. Do consult your investment advisor before taking any financial decisions. Stop losses should be an important part of any investment in equity.
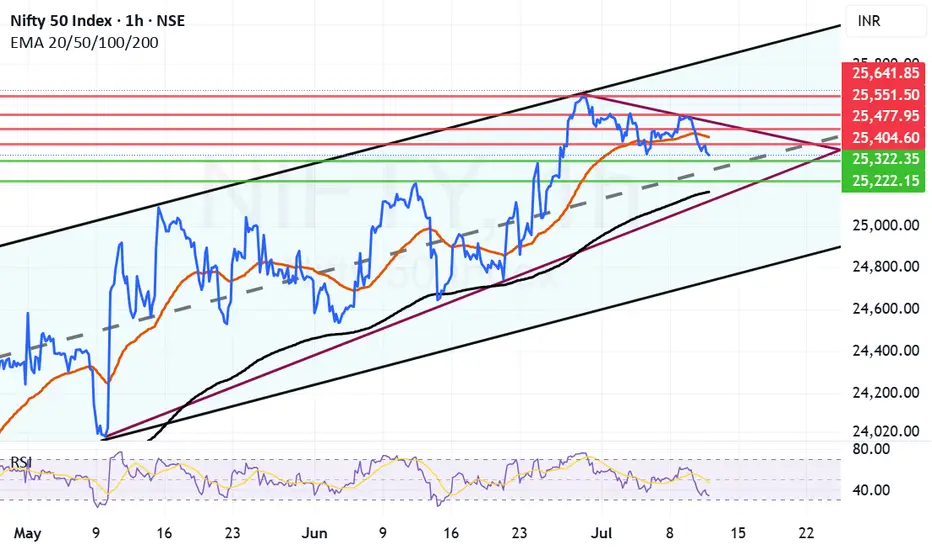
Nifty took support at the Mother line and trying to recoverNifty has taken support at the Mother line today and tried to post a recovery. Again proving our Mother, Father and small Child theory correct. To know more about the Mother father and small Child theory of stock market. Read my book THE HAPPY CANDLES WAY TO WEALTH CREATION. Nifty during the day made a low of 25378 and closed the day at 25453. It is not a strong recovery nevertheless the recover of 75 points recovery which makes shadow of the candle neutral to positive. Let us see if Nifty can recovery fully tomorrow or Friday to close the week in positive.
Nifty Supports remain at: 25396 (Mother Line Support which is also near the trend line support at 25378), there there is a support at 25245 and finally mid channel support near 25177. Closing below 25177 will make the Bears more powerful and they can drag the index further down towards Father line support near 25108.
Nifty Resistances remain at: 25470, 25528 (Trend line resistance), 25603 and finally 25679. 25759 seems to be the channel top currently in the hourly parallel channel.
Disclaimer: The above information is provided for educational purpose, analysis and paper trading only. Please don't treat this as a buy or sell recommendation for the stock or index. The Techno-Funda analysis is based on data that is more than 3 months old. Supports and Resistances are determined by historic past peaks and Valley in the chart. Many other indicators and patterns like EMA, RSI, MACD, Volumes, Fibonacci, parallel channel etc. use historic data which is 3 months or older cyclical points. There is no guarantee they will work in future as markets are highly volatile and swings in prices are also due to macro and micro factors based on actions taken by the company as well as region and global events. Equity investment is subject to risks. I or my clients or family members might have positions in the stocks that we mention in our educational posts. We will not be responsible for any Profit or loss that may occur due to any financial decision taken based on any data provided in this message. Do consult your investment advisor before taking any financial decisions. Stop losses should be an important part of any investment in equity.
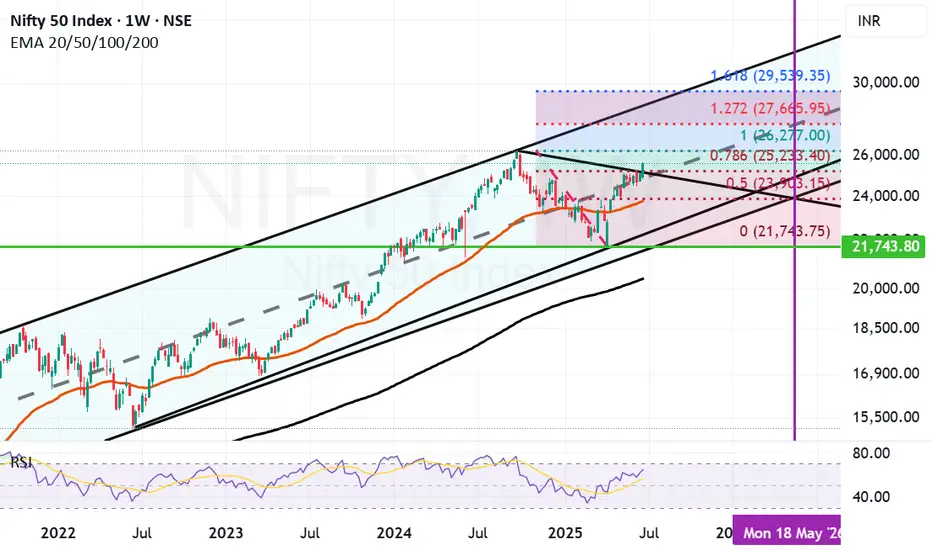
Medium to long term targets for Nifty. We have used parallel channel and Fibonacci retracement on Nifty weekly chart to gauge medium to long term targets for Nifty.
The Fibonacci retracement points out that the support for Nifty will remain at 25233(Fibonacci Support and mid channel support), 23903 (Important Fibonacci support), 23774 (Important Mother line support or 50 weeks EMA, channel bottom support). Nifty can go below these levels only in situation of another major global event or some major local event. If we get a closing below 23774 the Bear will be in commanding situation and will have the power to take Nifty further down towards 21743 which was the recent low we reached during Indo-Pak conflict.
The resistances for Nifty now are at 26277 (Major Resistance, Previous All Time high of Nifty), The next leap of faith for Nifty can be towards 27665 after we get a closing above 26277. (This will be a major hurdle and in next 1 year or so it is highly unlikely that we will cross this level unless we hit a euphoria zone.) This zone is also the current channel top zone. In very unlikely circumstance of Nifty crossing 27665 the next target for Nifty will be at 29539. (This looks possible in 18 to 24 months). We will be very lucky to reach this zone earlier. You never say never in the market.
As of now the local factors remain optimistic but there is a concern by experts related to valuation of market. As the Nifty PE currently is around 23. The results in the next couple of quarters will determine if Bull market stays active.
Disclaimer: The above information is provided for educational purpose, analysis and paper trading only. Please don't treat this as a buy or sell recommendation for the stock or index. The Techno-Funda analysis is based on data that is more than 3 months old. Supports and Resistances are determined by historic past peaks and Valley in the chart. Many other indicators and patterns like EMA, RSI, MACD, Volumes, Fibonacci, parallel channel etc. use historic data which is 3 months or older cyclical points. There is no guarantee they will work in future as markets are highly volatile and swings in prices are also due to macro and micro factors based on actions taken by the company as well as region and global events. Equity investment is subject to risks. I or my clients or family members might have positions in the stocks that we mention in our educational posts. We will not be responsible for any Profit or loss that may occur due to any financial decision taken based on any data provided in this message. Do consult your investment advisor before taking any financial decisions. Stop losses should be an important part of any investment in equity.
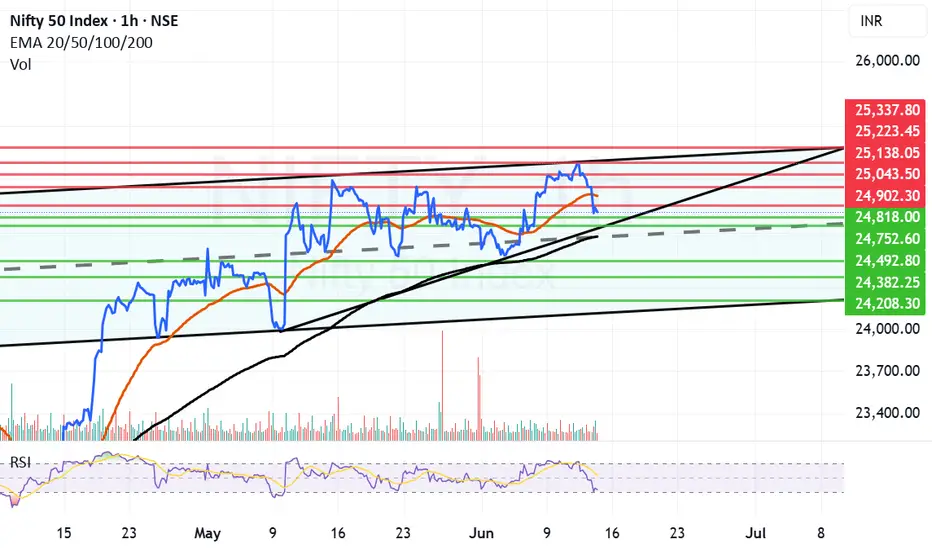
Things heating up between Iran and US. Market takes a nose dive.There is a news of things heating up between Iran and US with regards to Nuclear negotiations. It seems US has asked for reduction of staff at few embassies across the Middle East. In addition to the tragic plane crash in Ahmedabad also might have affected the sentiment. Market had already nosedived before the tragedy struck so it is hard to say it had any effect. Only logical explanation seems to be the Iran related escalation. On the technical Nifty was not able to hold above 25200 levels even after multiple attempts. This suggests upside-down there were currently no takes for the upside such scenario only leads to a correction and market diving to find a concrete bottom before beginning the next upward movement. The geo-political developments should be closely watched to speculate about further moves of market.
The zone between 24818 to 24672 has multiple supports including trend line support and mid-channel support and Father line support at 24672 as it can be seen in the chart. A closing below 24672 will only give the advantage to the bears who can further drag the Nifty towards 24492, 24382 or 24208 (Channel bottom support). Things get worse beyond this point but we will only talk about it if we get a closing below this level.
Resistance on the upside remain at 24902, 24974 (Mother line Resistance), 25043, 25138 and 25223. If we get a closing above 25223 then the channel top will be around 25337. Regarding the levels above 25337 we will post once we reach that stage.
Disclaimer: The above information is provided for educational purpose, analysis and paper trading only. Please don't treat this as a buy or sell recommendation for the stock or index. The Techno-Funda analysis is based on data that is more than 3 months old. Supports and Resistances are determined by historic past peaks and Valley in the chart. Many other indicators and patterns like EMA, RSI, MACD, Volumes, Fibonacci, parallel channel etc. use historic data which is 3 months or older cyclical points. There is no guarantee they will work in future as markets are highly volatile and swings in prices are also due to macro and micro factors based on actions taken by the company as well as region and global events. Equity investment is subject to risks. I or my clients or family members might have positions in the stocks that we mention in our educational posts. We will not be responsible for any Profit or loss that may occur due to any financial decision taken based on any data provided in this message. Do consult your investment advisor before taking any financial decisions. Stop losses should be an important part of any investment in equity.
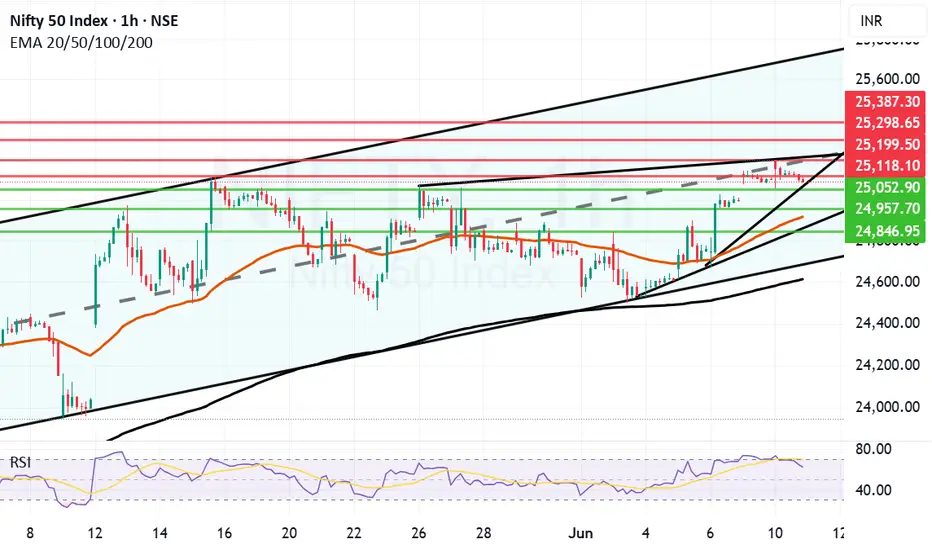
Nifty facing trendline resistance and RSI cooling down. Nifty had come close to overbought zone. Not that it was immensely overbought. It is also facing a trendline resistance which is hampering it's further progress. Bears are trying their best to bring it down while Bulls are trying to pull it above the trend line. The trade is in perfect balance right now. Once during the day Nifty had broken the trendline resistnace too as it made a high of 25199 but could not sustain the levels and was pulled down immediately. 25055 provided support and kept it Flat.
Supports for Nifty now remain at 25052, 24957, 24917 (Mother line of hourly chart), 24846 is another trend line support. Father line support is at 24614. Below this level bears will take over.
Resistances for Nifty remain at 25118, 25199 (Trend line resistance), A closing above 25199 will enable and empower bears as this will be a closing above mid channel resistance too. In such a scenario Bulls can further full Nifty upwards towards 25298 and 25387 levels.
Disclaimer: The above information is provided for educational purpose, analysis and paper trading only. Please don't treat this as a buy or sell recommendation for the stock or index. The Techno-Funda analysis is based on data that is more than 3 months old. Supports and Resistances are determined by historic past peaks and Valley in the chart. Many other indicators and patterns like EMA, RSI, MACD, Volumes, Fibonacci, parallel channel etc. use historic data which is 3 months or older cyclical points. There is no guarantee they will work in future as markets are highly volatile and swings in prices are also due to macro and micro factors based on actions taken by the company as well as region and global events. Equity investment is subject to risks. I or my clients or family members might have positions in the stocks that we mention in our educational posts. We will not be responsible for any Profit or loss that may occur due to any financial decision taken based on any data provided in this message. Do consult your investment advisor before taking any financial decisions. Stop losses should be an important part of any investment in equity.
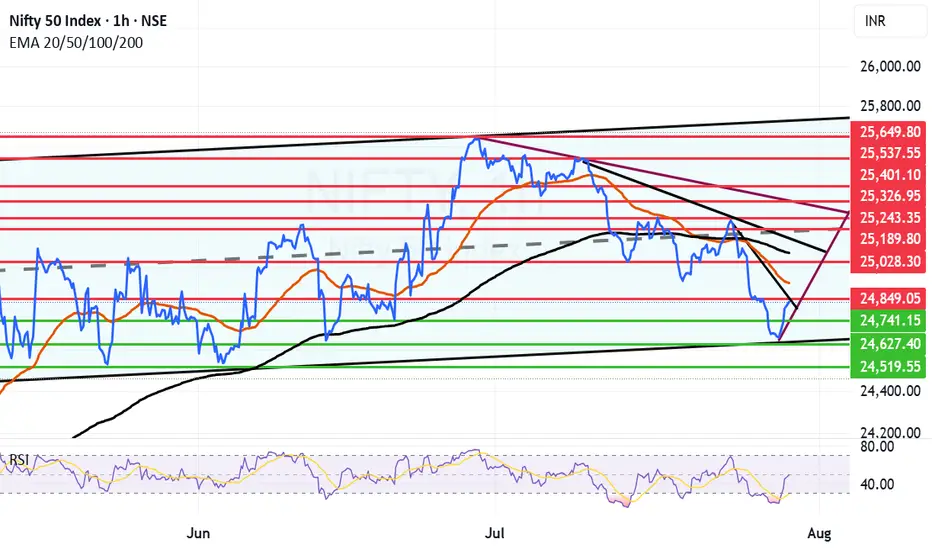
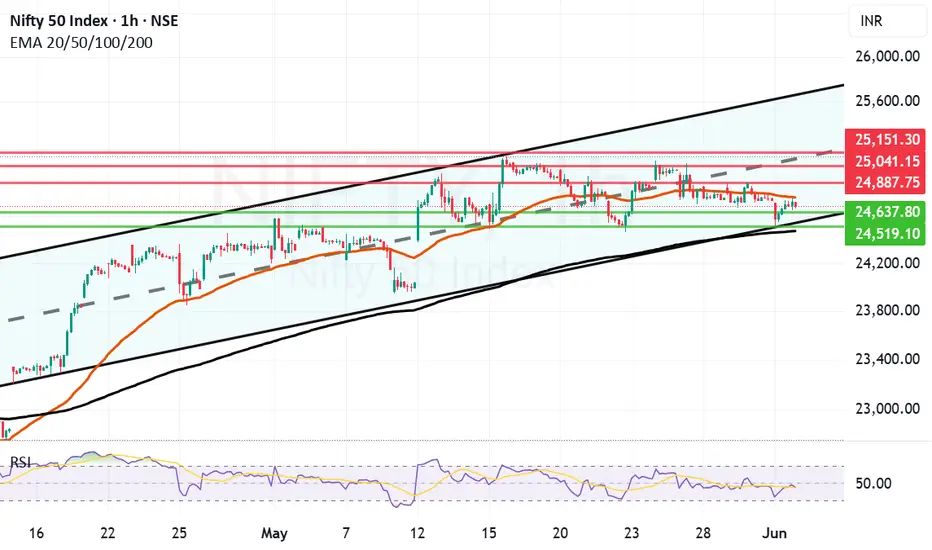
Nifty Bounces from Channel Bottom. Amidst escalation in Ukraine and Russia tussle with Ukraine going on major Drone offensive and Russia likely to respond anytime this week. The escalation can lead to NATO involvement and this can spell a major downside for Global market. The above is just speculation and things can take a different trajectory as well. During such global negative news Indian markets made a low of 24526 but recovered 190 points to close near 24716. This shows the strength of Indian market and shows that we are quiet buoyant.
Resistance for Nifty Remain near: 24763 (Mother Line of Hourly Chart), 24887, 25041 (Mid channel resistance and 25151.
Supports For Nifty Currently remain at: 24637, 24519 (Parallel Channel Bottom) and 24474 (Father Line of Hourly Chart).
If we get a closing below 24474 Bears will have an upper hand and can drag market further down we give the downside levels if we reach there. If we get a closing above 25151 Bulls Will have an Upper hand and can pull the index further upwards we give further upside levels once we reach there.
Disclaimer: The above information is provided for educational purpose, analysis and paper trading only. Please don't treat this as a buy or sell recommendation for the stock or index. The Techno-Funda analysis is based on data that is more than 3 months old. Supports and Resistances are determined by historic past peaks and Valley in the chart. Many other indicators and patterns like EMA, RSI, MACD, Volumes, Fibonacci, parallel channel etc. use historic data which is 3 months or older cyclical points. There is no guarantee they will work in future as markets are highly volatile and swings in prices are also due to macro and micro factors based on actions taken by the company as well as region and global events. Equity investment is subject to risks. I or my clients or family members might have positions in the stocks that we mention in our educational posts. We will not be responsible for any Profit or loss that may occur due to any financial decision taken based on any data provided in this message. Do consult your investment advisor before taking any financial decisions. Stop losses should be an important part of any investment in equity.
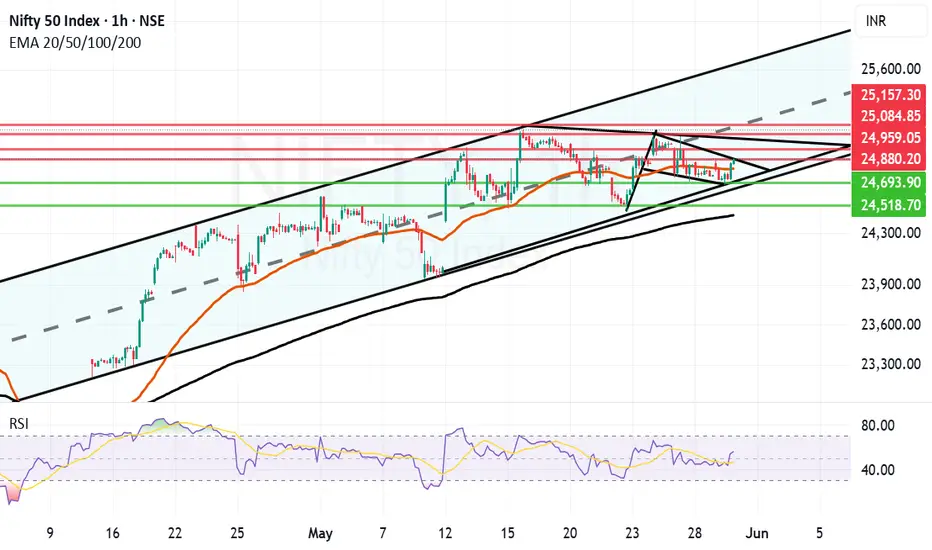
Flag and Pole kind of structure forming in Nifty. There is a very positive looking flag and pole kind of structure forming in Nifty hourly chart. This is within a parallel channel which Nifty has been following since April 15th 2025. This Flag and Pole breakout will come into effect if and only if we get a closing above 24880.
In case of flag and pole breakout happening the future resistances will be near 24959, 25084 and 25157. 25157 again will be a major resistance as it will be the mid of the channel.
The supports for Nifty in case the flag and pole breakout does not take effect are at 24804 (Mother line of hourly chart) 24693, 24518 and finally 24439.
Below 24439 bears can take over the market. Above 25157 Bulls can take over the market. Shadow of the candle is effectively neutral to positive.
Disclaimer: The above information is provided for educational purpose, analysis and paper trading only. Please don't treat this as a buy or sell recommendation for the stock or index. The Techno-Funda analysis is based on data that is more than 3 months old. Supports and Resistances are determined by historic past peaks and Valley in the chart. Many other indicators and patterns like EMA, RSI, MACD, Volumes, Fibonacci, parallel channel etc. use historic data which is 3 months or older cyclical points. There is no guarantee they will work in future as markets are highly volatile and swings in prices are also due to macro and micro factors based on actions taken by the company as well as region and global events. Equity investment is subject to risks. I or my clients or family members might have positions in the stocks that we mention in our educational posts. We will not be responsible for any Profit or loss that may occur due to any financial decision taken based on any data provided in this message. Do consult your investment advisor before taking any financial decisions. Stop losses should be an important part of any investment in equity.
Nifty Still near the top of Parallel Channel. Nifty is consolidating near the top of the parallel channel and searching for momentum for getting a clear breakout. Till it regains the momentum and Mojo the upside looks limited. The current resistances it is facing is near 25068. Once we get a closing above the same there is possibility of some upside. In case we get a closing above 25068 the next resistances will be near 25134 and 25290. 25290 is the point above which we have a clear channel top Breakout. We will wait for that to happen for giving further resistances. The supports for Nifty are currently near 24924, 24761 (Mother Line Support of Hourly chart). If we get a closing below 24761 the bears will come back into the game and can drag the Nifty further towards the levels of 24647, 24509, 24259 or even 24162. 24162 is a Father line support of hourly chart. A closing below this levels can bring Bears in a total action mode. We will comment about further supports if by chance we get a closing below this level.
Disclaimer: The above information is provided for educational purpose, analysis and paper trading only. Please don't treat this as a buy or sell recommendation for the stock or index. The Techno-Funda analysis is based on data that is more than 3 months old. Supports and Resistances are determined by historic past peaks and Valley in the chart. Many other indicators and patterns like EMA, RSI, MACD, Volumes, Fibonacci, parallel channel etc. use historic data which is 3 months or older cyclical points. There is no guarantee they will work in future as markets are highly volatile and swings in prices are also due to macro and micro factors based on actions taken by the company as well as region and global events. Equity investment is subject to risks. I or my clients or family members might have positions in the stocks that we mention in our educational posts. We will not be responsible for any Profit or loss that may occur due to any financial decision taken based on any data provided in this message. Do consult your investment advisor before taking any financial decisions. Stop losses should be an important part of any investment in equity.

Volatile day where Mother line gave support to NiftyIt was a volatile day on browsers where Mother line of hourly chart gave support to Nifty and helped it close in Green. after opening in Green Nifty and making a high of 24767 Nifty saw selling pressure which took it to as low as 24535 losing over 232 points. There Nifty found the support of Mother line and rose 141 points closing at 24666 which is 88 points hig from yesterdays close. Further volatility cant be ruled out as Nifty is facing the resistance of the trend line at 24684. If this level is crossed Nifty can find further resistance at 24852 and 25012. 25012 seems to be a Channel top resistance which will be little difficult to cross. Supports for Nifty remain at 24505 (Mother Line Support), 24374, 24165 and 23979 (Father Line Support). If Father line support is broken by chance bears can drag Nifty further down to 23786 levels. Around this zone we will also have mid channel support of the parallel channel. Thigs are delicately poised with positive shadow of the candle.
Disclaimer: The above information is provided for educational purpose, analysis and paper trading only. Please don't treat this as a buy or sell recommendation for the stock or index. The Techno-Funda analysis is based on data that is more than 3 months old. Supports and Resistances are determined by historic past peaks and Valley in the chart. Many other indicators and patterns like EMA, RSI, MACD, Volumes, Fibonacci, parallel channel etc. use historic data which is 3 months or older cyclical points. There is no guarantee they will work in future as markets are highly volatile and swings in prices are also due to macro and micro factors based on actions taken by the company as well as region and global events. Equity investment is subject to risks. I or my clients or family members might have positions in the stocks that we mention in our educational posts. We will not be responsible for any Profit or loss that may occur due to any financial decision taken based on any data provided in this message. Do consult your investment advisor before taking any financial decisions. Stop losses should be an important part of any investment in equity.

Nifty cooled down from the overbought zone. The correction in Nifty we saw today in most likelihood seems like a correction from overbought zone. The indicator for this is RSI which had reached 77.09 yesterday in the hourly chart. After the correction today it is back to 53.28 after reaching 51.5 earlier today. Another reason can be US and China agreeing to a trade deal which might also be seen as a negative for Indian markets. whether it will have very negative impact and send market further down is there to be seen. IT, Metals, Infra, MNC, Pvt Banking and Finance stocks were laggard. The indices that were positive today are Midcap, Small cap, Psu Banks, CG, Media and Pharma.
Supports for Nifty remain at: 24450 (Mother line of Hourly chart), 24374, 24165, 23929 (Father line of Hourly chart) and Mid channel support at 23786.
Resistances for Nifty remain at: 24642, 24797 and 25012 (Channel top resistance).
Shadow of the candle looks neutral as of now.
Disclaimer: The above information is provided for educational purpose, analysis and paper trading only. Please don't treat this as a buy or sell recommendation for the stock or index. The Techno-Funda analysis is based on data that is more than 3 months old. Supports and Resistances are determined by historic past peaks and Valley in the chart. Many other indicators and patterns like EMA, RSI, MACD, Volumes, Fibonacci, parallel channel etc. use historic data which is 3 months or older cyclical points. There is no guarantee they will work in future as markets are highly volatile and swings in prices are also due to macro and micro factors based on actions taken by the company as well as region and global events. Equity investment is subject to risks. I or my clients or family members might have positions in the stocks that we mention in our educational posts. We will not be responsible for any Profit or loss that may occur due to any financial decision taken based on any data provided in this message. Do consult your investment advisor before taking any financial decisions. Stop losses should be an important part of any investment in equity.

Another remarkable leap by Nifty. Channel top approaching. Nifty gained some serious ground again today closing 273.9 points up from previous close. The zone between 24202 and 24479 is the zone which stand between full blown Bull rally and some consolidation. The regressing parallel channel which started after Nifty made a high 26277 can be overcome if we get a closing above 24366. Immediate resistance is near 24202 before we reach there. Once we get a weekly closing above 24479 Bulls will take total control of the market. In such a scenario the Nifty can find resistance near 24830 before it can regain 25K levels.
If Nifty fails to conquer 24202, 24366 or 24479 then the supports will be near 23786. Bears can come back in picture if we get a closing above 23786. In such a scenario Mother and Father lines of hourly chart will play the supporting role at 23411 and 23101. Again near 23101 in addition to the Father line there is also Mid-Channel support thus this level should be considered a major support zone.
Since RSI of hourly chart is above 80 there is a chance of slight correction and consolidation which should also be looked at while taking fresh positions. RSI above 80 indicates that the positions might be just slightly be in the overbought zone.
Disclaimer: The above information is provided for educational purpose, analysis and paper trading only. Please don't treat this as a buy or sell recommendation for the stock or index. The Techno-Funda analysis is based on data that is more than 3 months old. Supports and Resistances are determined by historic past peaks and Valley in the chart. Many other indicators and patterns like EMA, RSI, MACD, Volumes, Fibonacci, parallel channel etc. use historic data which is 3 months or older cyclical points. There is no guarantee they will work in future as markets are highly volatile and swings in prices are also due to macro and micro factors based on actions taken by the company as well as region and global events. Equity investment is subject to risks. I or my clients or family members might have positions in the stocks that we mention in our educational posts. We will not be responsible for any Profit or loss that may occur due to any financial decision taken based on any data provided in this message. Do consult your investment advisor before taking any financial decisions. Stop losses should be an important part of any investment in equity.

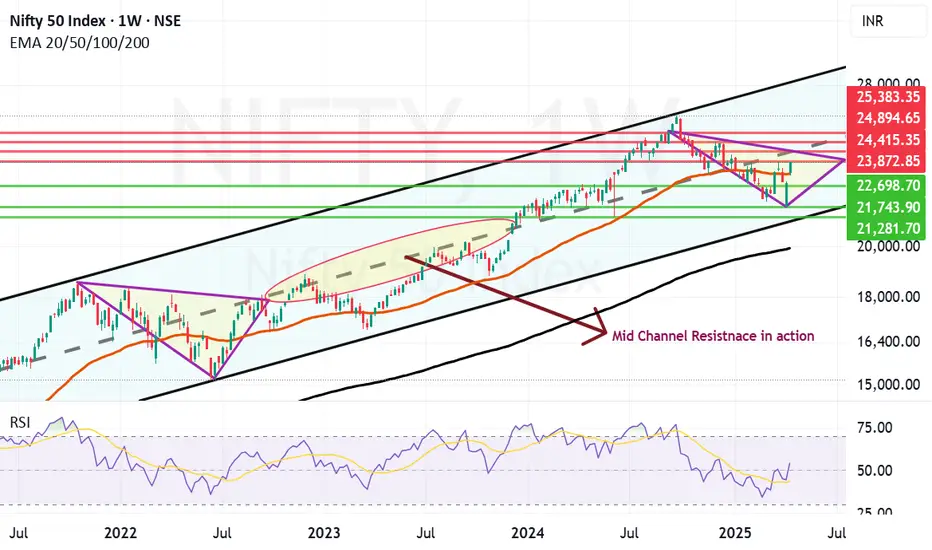
Nifty Parallel Channel and how things are shaping up. Nifty has closed strongly above the Mother line of Weekly chart this week. This should be considered a solid come back by Indian markets after the Trump Tariff induced fall. Indian economy is showing it's capability to bounce back on the back of strong rally in most of the sectors other than IT. Uncertainty in IT still looms as below par results that have started coming for might TCS and INfosys. We have a long weekend and uncertainties due to various announcements by global leaders regarding Tariffs can still spoil the party so one needs to be cautious in carrying huge positions over night and over the week especially in F&O trades.
Nifty travelling in a Parallel channel depicted above since 2020 is just below its Mid channel resistance at 24415. If you want to see the power of Mid Channel resistnace look at how it stopped Nifty between August 22 to December 23 below it. So Mid-channel resistnace should never be taken lightly. The area is depicted in the chart for your better understanding. Even before we reach that point of major resistance, Nifty has to counter strong resistance which was high of today and this week at 23872. Closing above 24415 can enable and empower Bulls to further push Nifty towards 24894, 25K and 25383 levels if the rally continues.
To know more about Parallel channel and how this Technical tool can be used to create wealth in stock market , you need to read my book The Happy Candles Way To Wealth creation. It is a highly rated book have a look at various reviews of the readers on Amazon. Both paperback and Kindle versions of the same are available on Amazon.
Nifty supports in case it is not able to cross and close above the resistnace zone of 23872 and 24415 will be 23272 (Strong Mother Line Weekly Support or 50 Weeks EMA) and 22698. A closing below 22698 in case of some adverse news or global development can empower the bears and can have potential to drag Nifty towards recent low of 21743 or 52 week low of 21281.
As of now things looking good but we have to wait and see the global and local developments over the weekend.
Disclaimer: The above information is provided for educational purpose, analysis and paper trading only. Please don't treat this as a buy or sell recommendation for the stock or index. The Techno-Funda analysis is based on data that is more than 3 months old. Supports and Resistances are determined by historic past peaks and Valley in the chart. Many other indicators and patterns like EMA, RSI, MACD, Volumes, Fibonacci, parallel channel etc. use historic data which is 3 months or older cyclical points. There is no guarantee they will work in future as markets are highly volatile and swings in prices are also due to macro and micro factors based on actions taken by the company as well as region and global events. Equity investment is subject to risks. I or my clients or family members might have positions in the stocks that we mention in our educational posts. We will not be responsible for any Profit or loss that may occur due to any financial decision taken based on any data provided in this message. Do consult your investment advisor before taking any financial decisions. Stop losses should be an important part of any investment in equity.
Nifty Trapped in Downward Parallel Channel. Fear grips D-street.Nifty post today's closing just above 23K has officially closed below Mid Channel within the downward channel. This is not a great news for bulls. The only silver lining in the cloud is that the closing is above 23K at 23024.
Bollinger band is suggesting a support near it's lower band width that is 22936. Other supports for Nifty will be at 22785, 22465, 21886(Bottom of Parallel Channel) and 21232. Resistance on the upper side seem to be at 23355, 23542 (Mid-Bollinger band level), 23662 Father Line resistance of daily chart, 23878 Father line resistance of daily chart and finally 24148 (Channel top and Bollinger band top resistance). When channel top will be crossed and we get a closing above the same the next resistances will be at 24799 and 25134. Thus signs are looking ominous with RSI at 35.37. RSI support will be near 30 range.
Nifty has once again entered Extreme Fear zone on Ticker tape index which shows it currently at 27.21. The zone below 30 is Extreme fear zone and long term investors tend to make much profit when they invest in these Extreme fear zone. The budget is around the corner.
Donald Trump has taken oath and is taking decisions in a fast-forward T-20 mode. The momentum can shift any time. Global peace is also seeing green shoots with Israel and Palestine conflict ceasefire deal taking shape. We hope that Ukraine and Russia will also see a peaceful resolution. The hour before the dawn is the darkest. This looks like that zone for Global markets including India. Yes hardball tactics will be played by Trump and things will not come as easily as they were coming for India. We had once said that Trump will be good for the world as Biden was softer towards India on the outer surface.
In the long run we will soon begin to see light at the end of the tunnel. Little more pain may be left for Indian indices. Result season so far has been a mixed bag that is adding fuel to the wild-fire set by bears. Budget/ Quad meeting later this year and world moving towards peace can set the ball rolling for Bulls sooner than later. Once again I emphasize that sensibel investments done in the extreme fear zone yield to the best results in the long run.
Disclaimer: The above information is provided for educational purpose, analysis and paper trading only. Please don't treat this as a buy or sell recommendation for the stock or index. We do not guarantee any success in highly volatile market or otherwise. Stock market investment is subject to market risks which include global and regional risks. I or my clients might have positions in the stocks that we mention in our posts. We will not be responsible for any Profit or loss that may occur due to any financial decision taken based on any data provided in this message. Do consult your investment advisor before taking any financial decisions. Stop losses should be an important part of any investment in equity.

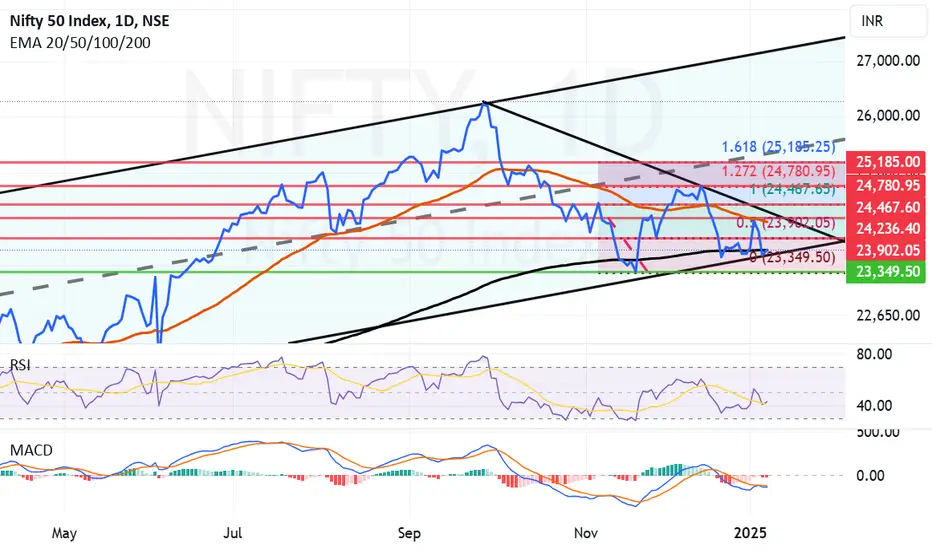
Fibonacci Support & Resistances for Nifty (Medium term outlook).Important Fibonacci support for Nifty drawn on daily line chart of Nifty is at 23349. Below 23349 closing bears can have a field day and can create havoc but that looks less likely as of now. The closing today is 23207 which is just above 200 days EMA or the father line which is a good sign. Father line was at 23700. On the upside the Fibonacci resistance for Nifty seem to be at 23902, 24170 (Important Mother line Resistance) 24236, 24467, 24780 and finally Fibonacci Golden ratio from the current levels is at 25185. It will take some doing from the Bulls to close above this level. This presents the medium time frame outlook for the Nifty.
RSI indicator also seems to have taken an upward swing but mid level is yet to be crossed for that indicator.
MACD indicator suggests that Moving averages are fighting hard to converge and bring back some bullish momentum into the market to infuse some life into the Bull who are trying to come out of comma.
Disclaimer: The above information is provided for educational purpose, analysis and paper trading only. Please don't treat this as a buy or sell recommendation for the stock. We do not guarantee any success in highly volatile market or otherwise. Stock market investment is subject to market risks which include global and regional risks. We will not be responsible for any Profit or loss that may occur due to any financial decision taken based on any data provided in this message.
Nifty searching for upward momentum. Nifty has again held on to the Motherline support of 50 Hours EMA today and if it is able to cross the resistance of 24698 more upside can be on the cards. In such a scenario the resistances on the upside in addition to 24698 will be at 24775, 24852, 24975 and finally 25147.
The supports for Nifty on the lower side seem to be at Mother line of 50 Hours EMA which is at 24852, 24398 Father line support of 200 hours EMA, Mid channel support at 24290 and finally the support is at 24174. Below 24174 Nifty become very weak. Above 25147 there will be a parallel channel breakout and Bulls will become very powerful. The signs are positive and despite a negative day on the browsers shadow of the candle is neutral to positive for tomorrow.
Disclaimer: The above information is provided for educational purpose, analysis and paper trading only. Please don't treat this as a buy or sell recommendation for the stock. We do not guarantee any success in highly volatile market or otherwise. Stock market investment is subject to market risks which include global and regional risks. We will not be responsible for any Profit or loss that may occur due to any financial decision taken based on any data provided in this message.

Long Term Analysis of Nifty my observations and a conclusion.The chart above is the chart of Nifty 50 since 1991. This chart here tells a few stories. I will tell you my version of these stories or observations you can derive your own conclusions from them:
1) India is a continuous bull market. There are blips due to Micro and Macro reasons but the chart keeps moving forward in the parallel channel. We are in the upper half of the channel since 2005 indicative of an economy that is moving forward and GDP that is continuously growing. There are couple of times when the market went into the lower half of the channel once was during the 2008 Sub-prime crisis and once during the COVID19 global crisis. Lot of countries of the world have still not come out of the trauma but we bounce back each time. This tells us about strength of our nation and our economy.
2) There is lot more room to grow before we hit the channel top resistance. Even in case of some major political event or market correction. We can get the mid channel support and the support of Mother line 50 Months EMA.
3) Relative Strength index is a lagging indicator used by a lot of analyst to check if the market is overbought or oversold. As per my observation over the years. We start to enter the overbought territory once the index is above 70. RSI above 80 is indicative of a market that is overbought. Similarly when the RSI levels are below 30 we enter the oversold territory and When RSI is below 20 we are in the highly oversold territory. Now if you look at the chart carefully each time monthly RSI of Nifty has gone near / above / substantially above 80 levels there has been a correction in the market. Some corrections have been large some not so substantial but inevitably market has corrected. Right now RSI of Nifty is 78.94. The levels to watch out for reversal / Consolidation / correction in my opinion can be anywhere between 79.88 and 91.35. I am not trying to scare you or predict a doomsday scenario, I am just presenting historic data in front of you.
4) Market can remain irrational for period of time beyond human comprehension. Market can remain irrational more than an investor can remain rational. So while we ride the upwave changing sectors and changing our stories and choices shuffling between small and mid and large caps do not forget to put in your stop losses and trailing stop losses. Stop losses are our friends that protect our capital and trailing stop losses are our friends that protect our profits. While we use them it can happen that a stock takes your trailing stop loss and again bounces back to huge upside but it is fine, either we learn or we win. If you have the capital you can invest again. If you will not have the capital it is an irreversible loss.
Conclusion: Stay Positive but be cautious. Use stop losses with discipline and trailing stop losses generously. The chart shows that history repeats. The chart shows that India is a continuous bull market. The chart shows that long term investor will always win if he has discipline and follows a process in stock selection, profit booking and staying vigilant.

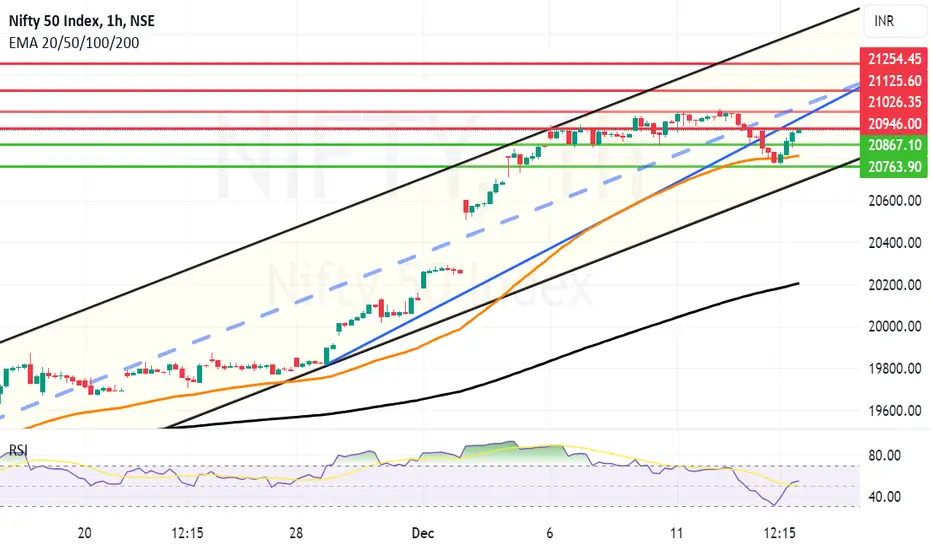
Nifty has taken support at 50EMA and can go towards new ATHIt looks Like RSI on Nifty Hourly chart has cooled down and is set for another rally. Once the Nifty and if the Nifty is able to cross 20946 and close above it on hourly candle, we may see Nift rise towards 21026, 21125 or even 21254 within a short span of time. Supports for Nifty on the lower side are 20867, 20813 and 20763.