Nifty Review & Analysis - DailyNifty opened Gap up 150 points following Global Cues and saw surge throughout the day making a high of 22857 and closing at 22834 +1.45%
Price Action : - Bullish
Nifty closed 1.5% in positive.
Candle Pattern:
Formed a Big Green candle with a small wick on upside.
Daily EMA Positioning:
10dEMA 22540
20dEMA 22623
50dEMA 22992
200dEMA 23404
EMA Trend:
Closed above 10dEma and 20dEma,
Daily MA suggests Buy
Hourly suggests Buy
15mins Suggests Strong Buy
The momentum indicator, RSI - Relative Strength Index at 54
Momentum gaining towards Upside
Support/Resistance Levels:
Major Support 22750
Immediate Support 22500
Immediate Resistance 22900
Major Resistance 23000
Trend:
Short Term Trend is Slight Bullish
Daily Options Activity:
Highest CE OI was at 23000 with highest addition at 23000 - Resistanc
Highest CE unwinding see at 22700 - Support
Highest PE OI was at 22500, highest Put addition seen at 22600, 22700 - support
PCR is 1.4 indicating Bullishness
Daily Futures Activity FII + Pro F&O Data:
FII Long/Short ratio at 24%/76% indicating slowly addition of Longs by FIIs - Bullish
Change in Futures OI:
FII Future positions saw little addition in longs +7K with -2K change in shorts -Bullish
Nifty Futures price was higher with 0.7% OI addition - Bullish
Observation:
Overall looks a positive breakout above 22600, with good PE addition at 22600 & 22700 levels can see
higher levels if 22850 taken out for targets 23000 in shortterm
Overall Trend:
Sideways consolidating turning positive
Outlook for Next Session:
Nifty looks strong above 22700, untill breakout above 23000 it might consolidate
Approach & Strategy:
Wait and watch as last 2 day’s strategy worked perfectly and Nifty has given around 500 points in 2 days, i would wait till 22900-23000 taken out for further Longs
My Trades & Positions:
Closed Long positions at 22800+ held from 22340.
Niftyprediction

#NIFTY Intraday Support and Resistance Levels - 18/03/2025Gap up opening expected in nifty. Expected opening near 22700 level. After opening if nifty starts trading above 22750 level then possible strong upside rally upto 22950+ in today's session. Any downside or reversal expected near a 22700 level. Downside 22550 level will act as a strong support for today's session. Major downside only expected below 22500 level.

NIFTY : Intraday Trading Levels and Plan for 18-Mar-2025📅 NIFTY INTRADAY TRADING PLAN – 18th March 2025 (Tuesday)
🕒 Timeframe: 15 Min | 📍Reference Closing: 22,515
📉 CHART STRUCTURE EXPLAINED:
Nifty closed near the middle of the Opening Resistance / Support Zone (22,508–22,547). There are clearly defined areas of support and resistance on both sides that help frame our intraday plan. Price action around these zones will provide direction for high-probability trades.
🟩 GAP-UP OPENING (100+ points): Above 22,617
If Nifty opens above the Last Intraday Resistance (22,617), it enters a potential breakout zone.
Avoid entering trades immediately after a GAP-UP above 22,617. Let the index retest this level for confirmation. If the price sustains above 22,617 for 15 minutes with higher volume, expect a continuation rally towards the Profit Booking Zone (22,727–22,801). Wait for a dip near 22,617 or even the upper band of 22,547. If the retest holds, go long with SL below 22,547. Profit booking is advised near 22,727–22,801 as this zone is likely to attract selling. Avoid fresh longs near 22,800 unless there’s a consolidation breakout.
🧠 Educational Note: Chasing GAP-UPs leads to poor entries. The best trades happen when price retests a broken resistance and confirms support.
🟨 FLAT OPENING (Within 22,508–22,547 Zone)
This is the Opening Resistance / Support Zone — a tricky area that demands patience.
Avoid trading in the first 15–30 minutes if price opens inside the 22,508–22,547 zone. It’s a chop zone, prone to false breakouts. A breakout above 22,547 with volume gives a long opportunity towards 22,617, and eventually 22,727. A breakdown below 22,508 brings the price into the Opening Support Zone (22,403–22,420). Watch for reversal signs here for possible bounce trades. Only consider directional trades once Nifty decisively exits this range.
🧠 Tip: In tight ranges, option premiums decay faster. Avoid entering trades without confirmation.
🟥 GAP-DOWN OPENING (100+ points): Below 22,403
If Nifty opens below the Opening Support Zone, volatility increases and levels become more critical.
Support is visible at the Buyers' Zone (22,210–22,247). If the index opens around this zone, wait for a reversal pattern like bullish engulfing or double bottom on 15-min chart. If 22,210 holds with a strong bounce, a long can be initiated targeting 22,403–22,508 with SL below 22,210. However, if 22,210 breaks with conviction, bears may drag the index to 21,950–22,000 levels. Avoid shorts immediately at open—wait for either breakdown retest or confirmation below 22,210.
🧠 Insight: Panic gap-downs often trigger short-covering rallies. Watch how price behaves in the first hour.
📘 RISK MANAGEMENT TIPS FOR OPTION TRADERS:
🛡️ Risk management is your ultimate edge in the market. Follow these key principles:
Never trade options without a stop loss. Monitor levels, not just premium prices. Avoid selling far OTM options when market structure is trending. It’s a trap during sharp moves. If market is inside range, go with spreads instead of naked options to reduce Theta burn. Size your positions wisely—don’t risk more than 1–2% of total capital on a single trade. Always book partial profits at target zones and trail the rest with a stop.
🧠 Options are like ice—they melt fast in choppy markets. Patience and timing are key!
📌 SUMMARY & CONCLUSION:
✅ Resistance Levels: 22,617 / 22,727 / 22,801
✅ Support Levels: 22,403 / 22,210
✅ Critical Zones:
⚠️ 22,508–22,547 (Opening Decision Zone)
✅ 22,403–22,420 (Support)
🛑 22,727–22,801 (Profit Booking Zone)
👉 Wait for confirmation before entering. Let market structure guide your direction, not emotions.
❗ Disclaimer: I am not a SEBI registered analyst. This plan is shared purely for educational purposes. Please consult with your financial advisor before making any trading decisions.

#NIFTY Intraday Support and Resistance Levels - 17/03/2025Expected gap up opening in nifty near 22500 level. After opening this is an important level for nifty. If nifty starts trading and sustain above 22550 level then expected upside rally upto 22700+ level. Downside reversal expected if nifty not sustain above level and starts trading below 22500. Downside 22350 level will act as a strong support for today's session.

Our view on nifty is on upside We are bullish in nifty till our target is achieved
Buy nifty at 22300
Target 22660 22784 23178
Sl 22105
If nifty close below 22080 thn we see 10% downside in it ..

NIFTY : Intraday Trading levels and Plan for 17-Mar-2025📊 NIFTY Trading Plan – 17-Mar-2025
Nifty is currently hovering near the Opening Support Zone: 22,351 – 22,378, with a key resistance at 22,442 and profit booking zone near 22,617. Depending on how the market opens, we will plan our trades accordingly.
💡 Let’s analyze different scenarios:
🔥 Scenario 1: Gap-Up Opening (100+ Points)
If Nifty opens above 22,442, the index will test the last intraday resistance at 22,551. A decisive breakout above 22,617 may trigger strong bullish momentum.
✅ Plan of Action:
If Nifty sustains above 22,551, look for bullish price action and enter longs with targets of 22,617 and 22,680+.
If a sharp rejection occurs near 22,617, consider booking partial profits and trail SL.
Avoid chasing longs if Nifty starts showing weakness near resistance. Wait for a pullback.
📌 Key Levels to Watch: 22,442 (Support) | 22,551 (Breakout Zone) | 22,617+ (Profit Booking Zone).
📢 Tip: In case of a fake breakout above 22,617, selling pressure may drag Nifty back to 22,442. Watch for reversal patterns before taking aggressive trades.
📉 Scenario 2: Flat Opening (Within 50 Points)
If Nifty opens near 22,383 – 22,434, we will monitor price action near the Opening Support/Resistance Zone. The first 30 minutes will be crucial for direction confirmation.
✅ Plan of Action:
If Nifty bounces from 22,351 – 22,378, look for long opportunities targeting 22,442 and 22,551.
If Nifty struggles to hold 22,442, expect sideways action. Trade only near major levels.
A breakdown below 22,351 will indicate weakness, leading to a test of 22,296 and 22,208.
📌 Key Levels to Watch: 22,351 – 22,378 (Support Zone) | 22,442 (Resistance) | 22,551 (Breakout Confirmation).
📢 Tip: Use a wait-and-watch approach in the first 30 minutes. Let the market establish direction before making big trades.
🛑 Scenario 3: Gap-Down Opening (100+ Points)
A gap-down below 22,351 could push Nifty towards the last intraday support of 22,296. If the selling extends, watch the golden retracement zone at 22,114, which is a high-probability demand zone.
✅ Plan of Action:
If Nifty stabilizes at 22,296, expect a recovery towards 22,351 – 22,378. Scalping opportunities exist.
If selling pressure continues below 22,296, expect a further slide to 22,114, which will be a must-watch area for buyers.
Only consider fresh longs at 22,114 if strong reversal signs appear. Else, avoid catching falling knives.
📌 Key Levels to Watch: 22,296 (Support) | 22,208 (Breakdown Confirmation) | 22,114 (Golden Buy Zone).
📢 Tip: Avoid aggressive longs in a gap-down scenario unless a clear reversal is seen at major supports. Watch for confirmation before entering any trade.
⚡ Risk Management Tips for Options Traders
🔹 Premium Decay Alert: If Nifty consolidates, avoid buying OTM options. Time decay will erode premiums.
🔹 Hedge Positions: If selling options, hedge using spreads to reduce risk.
🔹 Exit at SL: Do not hold options hoping for reversals. Stick to the predefined SL.
🔹 Avoid Trading the First 5-Minutes: Market volatility is high; let a pattern form.
🔹 Size Appropriately: If uncertain, reduce lot size and wait for confirmation.
📌 Summary & Conclusion
✅ If Nifty Opens Gap-Up: Watch for 22,551 – 22,617 resistance zones. A breakout can trigger further upside.
✅ If Nifty Opens Flat: First 30 minutes are crucial. Support at 22,351 – 22,378 should hold for longs.
✅ If Nifty Opens Gap-Down: Watch 22,296 for a reaction. If broken, 22,114 is a key buy zone.
📢 Final Note: The best trades come when price action confirms levels. Avoid emotional trading and respect stop losses.
📜 Disclaimer
I am not a SEBI-registered analyst . All views are for educational purposes only. Traders should conduct their own analysis or consult a financial advisor before making any investment decisions.

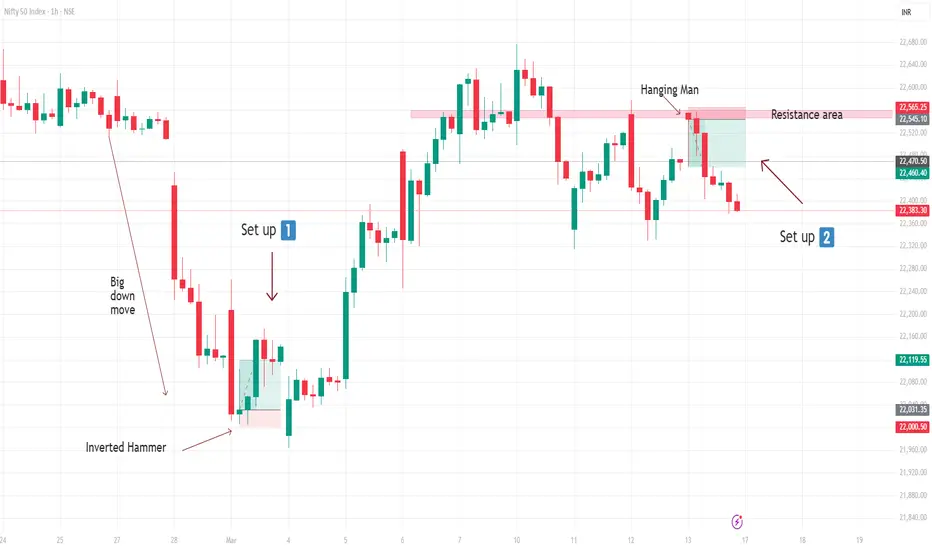
Nifty, BNifty, Stock 1hrs Trade SetupFollow Time frame 1hr, identify candle Hanging man on resistance and Inverted hammer on support, entry after candle closed, and enjoy the profit.. look at setup in picture....
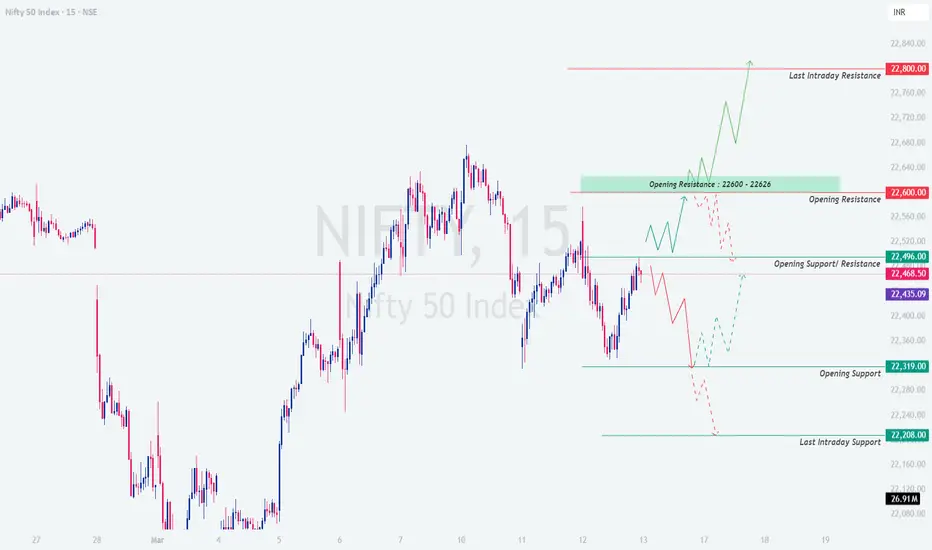
#NIFTY Intraday Support and Resistance Levels - 13/03/2025Flat opening expected in index. After opening if nifty starts trading above 22500 level then expected upside rally upto 22650+ in today's session. 22650 level will act as an immediate upside resistance. Expected reversal from this level. Major downside expected if nifty not sustain above 22500 and starts trading below 22450 level.

NIFTY : Intraday Trading levels and Plan for 13-Mar-2025📘 NIFTY Trading Plan for 13-Mar-2025
Chart Reference: Nifty is currently trading near 22,468, with price showing rejection from near-term resistance. Multiple levels such as 22,435, 22,496, and 22,600 are key zones to watch.
Let’s break down the trading approach into opening scenarios 👇
✅ 1. GAP-UP OPENING (100+ points above previous close)
If NIFTY opens near or above the Opening Resistance Zone – 22,600 to 22,626 :
📍 This zone has acted as a supply area earlier, and a gap-up into this area could trap late buyers if not sustained.
🟧 Scenario 1 – Rejection at Resistance:
🔻 If NIFTY opens within this resistance zone and shows early weakness (such as a bearish engulfing, evening star, or rejection wick), short trades can be considered.
🎯 Targets:
➤ 22,496 (Initial Support)
➤ 22,435 (Next Support)
🟩 Scenario 2 – Breakout Above 22,626:
✅ A strong 15-min bullish candle above 22,626 with volume confirmation can trigger a long entry.
🎯 Targets:
➤ 22,680
➤ 22,800 (Last Intraday Resistance)
🧠 Tip: In gap-up opens, avoid immediate entries. Wait 15–30 mins for the market to establish direction. If upside sustains with strength, trail using VWAP or 5-min EMA.
⚖️ 2. FLAT OPENING (within ±100 points)
If NIFTY opens between 22,435 – 22,496:
This region is the Opening Support/Resistance Zone , meaning both bulls and bears will be active here. The key is to observe who dominates.
🟩 Long Setup:
If NIFTY holds above 22,496 and gives a breakout above 22,600, it will confirm bullish strength.
🎯 Upside Targets:
➤ 22,680
➤ 22,800
🟥 Short Setup:
If price fails to hold above 22,435 and breaks below it with momentum:
🎯 Downside Targets:
➤ 22,319 (Opening Support)
➤ 22,208 (Last Intraday Support)
🧠 Tip: Use option strategies like straddles or strangles near this flat zone if expecting a breakout or expansion in volatility. Avoid naked directional trades unless there is strong confirmation.
🔻 3. GAP-DOWN OPENING (100+ points below previous close)
If NIFTY opens near or below 22,319 (Opening Support):
📍 The area between 22,319 – 22,208 is critical for support. Watch closely for price action.
🟩 Reversal Setup:
If NIFTY opens near 22,208–22,319 and holds this support with signs of strength (bullish pin bar, morning star, or strong bullish volume), a reversal trade can be taken.
🎯 Targets:
➤ 22,435
➤ 22,496
🟥 Breakdown Setup:
If support at 22,208 breaks with a large red candle and follow-through, short trades can be initiated.
🎯 Targets:
➤ 22,140–22,100 Zone (Intraday Expansion Move)
🧠 Tip: Gap-downs can lead to high implied volatility. Be cautious of IV crush if reversal happens. Consider bear put spreads to manage premium risk.
💡 Risk Management Tips for Options Traders
Avoid buying deep OTM options post 12 PM unless there is strong trend confirmation. Always trade with a defined stop-loss. Use 15-min closing basis for better validation. Consider spreads (bull call, bear put) to reduce the impact of theta decay. On volatile days, reduce position size and hedge your trades. Don’t trade immediately after a gap — let the first 15–30 mins settle to avoid traps.
📌 Summary & Conclusion
✅ Key Resistance Zones:
➤ 22,600–22,626 (Opening Resistance)
➤ 22,800 (Last Intraday Resistance)
✅ Key Support Zones:
➤ 22,435 (Pivot Zone)
➤ 22,319 (Opening Support)
➤ 22,208 (Last Support Zone)
🎯 Let price action guide your trade around these key levels. Remember — reacting to the market is better than predicting it.
⚠️ Disclaimer
I am not a SEBI registered analyst. This trading plan is shared purely for educational purposes. Please do your own research or consult your financial advisor before making any investment or trading decisions.
Nifty 50 Forecast by NEoWaveOn the 2H timeframe, the recent price correction appears to be a diametric one. When a Diametric Zigzag forms, it usually forms a combination pattern, so we consider 2 scenarios:
Scenario 1
Diametric wave-(g) ends in the range of 21050 – 21473 or even higher and the upward movement begins
Scenario 2
a- Wave-(g) continues to the range of 21050 – 21473 and then, in order to complete the time correction, a combination pattern of Diametric – X – Triangle is formed on the support range.
b- Wave-(g) continues to the range of 21050 – 21473 and then a small X wave is formed, but the price crosses the support range of 21050 – 21473, in this case, the combination pattern will still form, but the price can decrease to 19993 or the price range of 18993-18744 according to the second pattern.
The second scenario is more likely to form.

#NIFTY Intraday Support and Resistance Levels - 12/03/2025Flat opening expected in nifty. After opening if nifty sustain above 22500 level then possible upside rally upto 22750+ level in today's session. Any major downside only expected if nifty not sustain above level and starts trading below 22450. This downside rally can goes upto 22300 level after the breakdown.

NIFTY : Intraday Trading Levels and Plan for 12-Mar-2025📅 NIFTY Trading Plan – 12-Mar-2025
(Timeframe: 15-min | Chart structure based on demand/supply and price action)
Opening Scenarios 📈📉
Gap-Up Opening (📍+100 Points or more)
If Nifty opens above the 22,598 resistance zone, price may initially test this level as support.
🔹 A successful hold here can trigger a bullish rally toward the last intraday resistance at 22,800, with intraday targets around 22,700+.
🔸 However, if Nifty fails to sustain above 22,598 and slips back inside the orange resistance zone, a corrective dip back to 22,496–22,482 may occur.
📌 Plan of Action:
✅ Buy on retest & strength above 22,598
❌ Avoid fresh longs if candles close back below 22,598
Flat Opening (±100 Points)
If Nifty opens near 22,520–22,482, this range becomes a decision-making zone.
🔹 Holding above 22,520 can provide a quick upside move toward 22,598+.
🔸 On the other hand, weakness below 22,482, especially on hourly close, can open downside toward the Opening Support Zone: 22,358–22,415.
📌 Plan of Action:
✅ Wait for the first 15–30 min range breakout
💡 Above 22,520 = bullish bias
⚠️ Below 22,482 = cautious; only scalp short with confirmation
Gap-Down Opening (📉 -100 Points or more)
A gap-down near or below 22,358–22,415 places price directly into the Opening Support Zone.
🔹 Watch for price rejection wicks or bullish reversal candles near this zone.
🔸 If broken decisively, Nifty may test 22,259 (last intraday support) and then the Best Buy Zone: 22,115–22,155, which aligns with the golden retracement zone.
📌 Plan of Action:
✅ Wait and observe price action at 22,358–22,259
📉 Short only if there's breakdown with volume
📈 Strong bounce near 22,115–22,155 = high RR long trade setup
📘 Risk Management Tips for Options Traders 💡
📏 Avoid buying OTM calls or puts after big gap openings . Wait 15–30 mins for premium decay to stabilize.
🛑 Always place SL based on chart levels or candle close—not fixed points .
🧠 Avoid averaging losing options positions —theta decay can kill.
💸 Position sizing is key: Never risk more than 1–2% of capital per trade.
🎯 Trade with a plan, not emotions. Let levels guide your decisions.
📊 Summary & Key Levels
🔹 Upside Resistance: 22,598 – 22,800
🔸 Key Pivot Levels: 22,520 / 22,482
🟢 Support Zones: 22,358 – 22,259 – 22,115
⚠️ Best Risk-Reward Zone: 22,115 – 22,155 (Watch for reversal signs)
📌 Conclusion
Nifty is trading in a reactive zone. Smart trading lies in reacting to key levels, not predicting. Avoid emotional trades near resistance or support—let price confirmation guide you. Patience will reward the prepared trader.
📛 Disclaimer: I am not a SEBI registered analyst. All views shared are for educational purposes only. Please consult your financial advisor before taking any trades.

#NIFTY Intraday Support and Resistance Levels - 11/03/2025Slightly gap down opening expected in nifty. After opening if nifty starts trading below 22450 level then possible downside rally upto 22300 in opening session. This downside rally can extend further in case nifty gives breakdown of 22250 level. Any bullish side rally only expected if nifty starts trading and sustain above 22500 level.

NIFTY : Intraday Trading levels and Plan for 11-Mar-2025📅 NIFTY TRADING PLAN – 11-Mar-2025
🕘 Time Frame: 15-Min | 📍 Strategy: Market Structure + Zones of Interest
📉 Previous Close: 22,441.10
📌 Consider 100+ points for Gap-Up / Gap-Down thresholds
🔼 1. GAP-UP OPENING (Above 22,541+)
A gap-up opening above 22,541 would place Nifty around or above the Opening Resistance zone. In such cases, the market may attempt to challenge the Last Intraday Resistance at 22,623, and possibly even push into the Major Resistance Zone between 22,706–22,744.
🧠 Plan of Action:
Wait for the price to show reaction around 22,623. If it struggles to sustain above this level and forms a bearish 15-min candle, it's a good risk-reward shorting opportunity.
Targets on the downside could be 22,512, and if weakness persists, then a slide toward 22,441 is possible.
Only if price breaks and holds above 22,744 (hourly candle close), consider going long for a possible extension toward 22,800+.
🔍 Caution: A gap-up directly into resistance zone can cause profit booking and volatility. Don’t chase a runaway rally unless momentum with volume confirms breakout.
🎯 Short Zone: 22,620–22,740 (Rejection candles preferred)
📈 Breakout Long above: 22,744 (With hourly close + volume)
➖ 2. FLAT OPENING (±100 points near 22,441)
A flat open near the previous close of 22,441 keeps Nifty inside a decision zone. It sits between the Opening Resistance (22,512) and the Consolidation Zone (22,321–22,410). This is where early traps often occur.
🧠 Plan of Action:
Let the first 15–30 mins settle. If Nifty bounces from 22,321–22,350, it can be considered a buy with tight SL below 22,321, targeting 22,512–22,623.
On the flip side, if price fails to hold 22,321, wait for a clean breakdown with volume — in that case, shorting opportunities open up toward 22,115.
Avoid overtrading in the consolidation zone — wait for structure to develop clearly.
🟧 Key Zone to Watch: 22,321–22,410 — Acts as possible trap zone with choppy moves.
🎯 Buy on Bounce: 22,321–22,350 (Confirmation needed)
📉 Short below: 22,321 (Strong candle + volume)
🔽 3. GAP-DOWN OPENING (Below 22,341)
If Nifty opens below 22,341, it may test or even open inside the Support Zone / Must Try Area for Buyers around 22,115 — which coincides with a key Golden Retracement and past support area.
🧠 Plan of Action:
If Nifty opens near 22,150–22,120, watch for reversal candles like bullish engulfing, morning star, or hammer patterns. If formed, it’s a good risk-reward zone to go long with SL below 22,100.
If price breaks and sustains below 22,100, avoid longs and prepare for further downside toward 21,950–21,880 in upcoming sessions.
Never jump into longs blindly on gap-downs — price action is king.
🟢 Buy Zone on Reversal: 22,150–22,115
🟥 Breakdown Trigger: Below 22,100 (Hourly candle close)
💡 Risk Management Tips for Options Traders:
🕒 Wait for the first 15–30 minutes to pass — let the market reveal its intent. 📉 Use spreads (Bull Call or Bear Put) when trading near volatile zones like resistances or supports. 🛑 Always set a Stop Loss — either on premium value or index level (preferably both). 🧠 Avoid emotional trading — don’t average into losing positions. 💼 Trade position size wisely — don't go all-in on a single idea. 🧾 Keep a trading journal to improve your strategy over time.
📌 Summary & Conclusion:
🔺 Gap-Up = Watch for weakness near 22,623–22,744 — possible reversal or breakout
🔘 Flat = High chance of whipsaws — trade only after clear setup forms near 22,321 or 22,512
🔻 Gap-Down = Support test likely at 22,115 — potential reversal or breakdown
⚠️ Always respect the market structure and trade with discipline. Avoid predicting — react to what the market shows.
📢 Disclaimer: I am not a SEBI-registered analyst. This analysis is shared for educational purposes only. Please do your own research or consult a financial advisor before making any trading decisions.

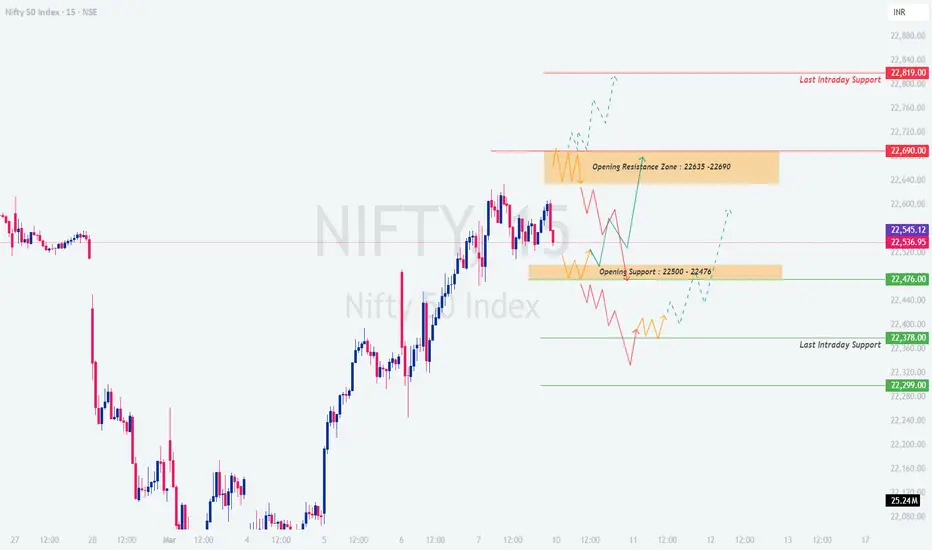
#NIFTY Intraday Support and Resistance Levels - 10/03/2025Flat opening expected in nifty near 22550 level. Any bullish side rally only expected if nifty sustain above 22500 level. If nifty gives upside movement then there will be nearest resistance at 22750 and expected reversal from this level. Strong downside expected if nifty starts trading below 22450 level.
NIFTY : Intraday Trading levels and Plan for 10-Mar-2025 NIFTY Closed at: 22,552
Tomorrow's session will be crucial as NIFTY is near key resistance & support zones. We will analyze all three possible opening scenarios and provide actionable trade setups.
📍 Scenario 1: Gap-Up Opening (🔼 +100 points or more)
If NIFTY opens above 22,690, it will start near the Opening Resistance Zone (22,635 - 22,690). A strong bullish momentum can push prices higher, but traders should be cautious of potential rejection.
📌 Plan of Action:
If NIFTY sustains above 22,690 for at least 15 minutes, expect a rally towards 22,819 (Last Intraday Resistance). 📈
If price faces rejection at 22,690, wait for a pullback to 22,635. If it holds as support, consider a long position.
If NIFTY falls below 22,635, it could test 22,545. A break below this level may weaken bullish sentiment.
📢 Trading Tip: In a gap-up scenario, avoid aggressive long positions at opening. Wait for price confirmation to avoid FOMO.
📍 Scenario 2: Flat Opening (±50 points around 22,536)
A flat opening indicates an indecisive market, and price action around the Opening Support Zone (22,500 - 22,476) will be crucial for the next move.
📌 Plan of Action:
If NIFTY holds above 22,536 and breaks 22,545, expect bullish momentum towards 22,635, followed by 22,690.
If NIFTY fails to hold 22,500, expect a slide towards 22,476. If this level is broken, expect further downside towards 22,378. 🔻
For long trades, wait for price to reclaim 22,545 after testing support zones.
📢 Trading Tip: Avoid trading in the first 15-30 minutes. Let the market establish a trend before taking positions.
📍 Scenario 3: Gap-Down Opening (🔽 -100 points or more)
If NIFTY opens below 22,476, sentiment may turn bearish, especially if it sustains below this level.
📌 Plan of Action:
If NIFTY opens near 22,378, watch for price action—a strong bounce can lead to a recovery towards 22,476 - 22,500.
If 22,378 breaks, expect further weakness towards 22,299, which is the last major intraday support.
Any recovery will need to cross 22,500 for a trend reversal. Until then, bearish pressure will dominate.
📢 Trading Tip: In a gap-down scenario, avoid catching falling knives. Let support levels hold before attempting a buy.
🎯 Risk Management Tips for Options Traders
✅ Use Stop Loss: Always exit a trade if your stop loss is hit. Holding onto losing trades can wipe out profits.
✅ Avoid Trading Big Lot Sizes in uncertain conditions—start small & scale up when trends confirm.
✅ Time Decay Awareness: If buying options, avoid holding near expiry unless confident about a strong move.
✅ Hedge Positions: Consider using hedged strategies like Spreads to reduce risk.
📌 Summary & Conclusion
🔹 Above 22,690 → Bullish towards 22,819
🔹 Between 22,500 - 22,690 → Sideways range, wait for confirmation
🔹 Below 22,476 → Bearish towards 22,378 - 22,299
⚡ Patience & Discipline are key to profitable trading. Wait for confirmation before entering trades. 🚀
⚠️ Disclaimer
I am not a SEBI-registered analyst. This trading plan is for educational purposes only. Traders should do their own research or consult a financial advisor before taking any trades.
📢 #Nifty #Nifty50 #StockMarketIndia #OptionsTrading #SwingTrading #TradingView #NSE #IndianStockMarket #PriceAction #StockMarketNews 🚀
Nifty Outlook: Bulls vs Bears - Key Levels to Watch Next Week
Nifty closed at 22,552, up by around 330 points from last week's close, hitting a high of 22,633 and a low of 21,964. As anticipated last week, the index found support at the 100-day WEMA around the 22,000 level, triggering a bounce. Looking ahead, next week is crucial, as the market is at a crossroads. While the monthly and weekly timeframes continue to show bearish signals, the bulls are actively trying to take control and push the market higher.
Here’s what to watch for:
Key Resistance: If Nifty manages to stay above 22,800 next week, we could see a short-covering rally, driving the index towards the 23,000 to 23,050 range. However, beyond these levels, the bulls may face significant challenges in taking the market further up.
Critical Support: On the downside, 22,000 remains a major support level. A break below this level could signal a fresh downtrend, possibly leading the market towards 19,500.
Next week is expected to be volatile, given the short trading week due to the holiday on Friday. This could lead to profit-taking from long traders, which might put downward pressure on the market. Keep a close eye on this week's low of 21,964. If it breaks, the market may open up to sharp declines.
Meanwhile, the S&P 500 has found support at the 50-day WEMA and closed at 5,770. On the weekly timeframe, it looks like the S&P 500 is forming a W pattern, with potential upside towards 5,850-5,890 next week before any pullback. If the S&P rallies as expected, it could provide a boost to Indian markets as well.
Next week is set to be decisive. Will the bulls overcome the bearish pressure, or will the market succumb to further selling? Stay alert, as the battle between bulls and bears continues.

#NIFTY Intraday Support and Resistance Levels - 07/03/2025Today will be flat opening expected in nifty. After opening if nifty sustain above 22500 level then expected upside movement upto 22750 in today's session. 22500 level will act as a important support for today's session. Major downside possible if nifty not sustain above level and give breakdown of 22450. This downside can goes upto next major support level at 22150.

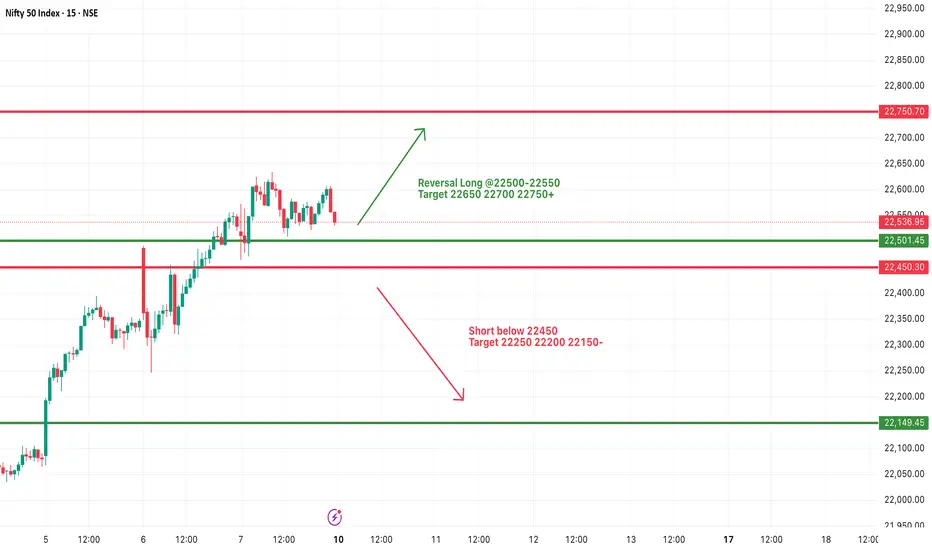
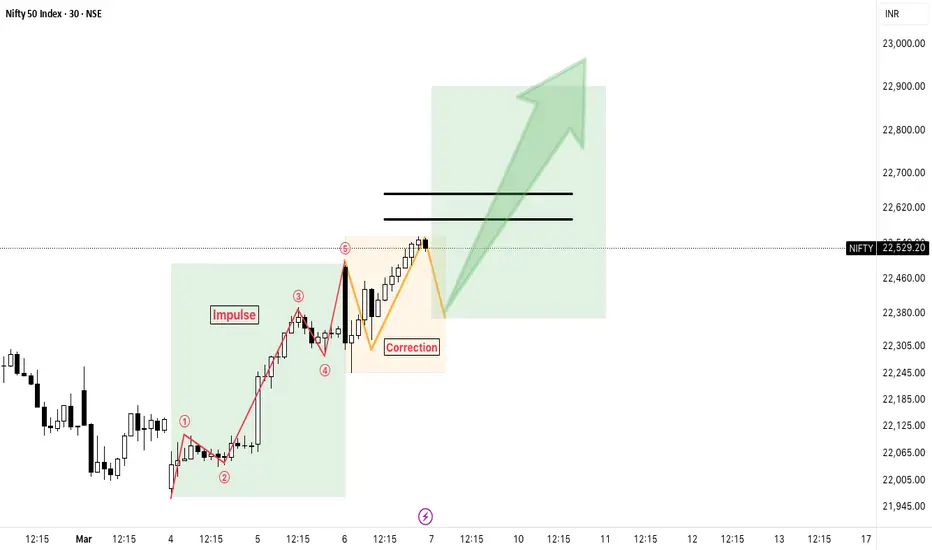
NIFTY: Impulse formationNifty has risen up in an impulsive manner from the bottom of 21964. Any correction is likely to hold above 22175 and extend the recovery towards 22800-23000 zone in the coming days and weeks ahead.
NIFTY : Intraday Trading levels and Plan for 07-Mar-2025
📌 Key Levels to Watch:
🔴 Resistance Levels: 22,635 | 22,819
🟢 Support Levels: 22,467-22,496 | 22,378 | 22,258
📝 Market Context:
Nifty has shown strong momentum in recent sessions, currently trading near 22,529. The profit booking zone lies around 22,635, while a breakout above this could lead to 22,819. On the downside, key support exists at 22,467-22,496, and a further breakdown may drag prices toward 22,378-22,258.
📈 Scenario 1: Gap-Up Opening (100+ Points Above 22,630) 🚀
If Nifty opens above 22,630, it enters the profit booking zone, making further upside dependent on momentum. A clean breakout above 22,819 will signal strength.
Buy above 22,635 🔼
🎯 Target: 22,750 – 22,819
🛑 Stop Loss: 22,550
📝 Plan: If Nifty sustains above 22,635, it can attempt 22,819. Wait for a proper 15-minute candle close above 22,635 before entering. Profit booking is advised near resistance levels.
Rejection at 22,635 ❌
🔽 Sell below 22,630
🎯 Target: 22,500 – 22,467
🛑 Stop Loss: 22,680
📝 Plan: If Nifty struggles at 22,635 and reverses, a short trade can be considered toward 22,467. Volume confirmation is necessary before entering shorts.
📉 Scenario 2: Flat Opening (22,450 – 22,550) 📊
A flat opening near 22,450 – 22,550 suggests indecision. The 22,467-22,496 range is a crucial support area.
Buy above 22,550 🔼
🎯 Target: 22,635 – 22,700
🛑 Stop Loss: 22,500
📝 Plan: If Nifty holds above 22,550 and shows strength, an upside move toward 22,635 is likely. Look for bullish price action confirmation before entering.
Sell below 22,467 🔽
🎯 Target: 22,378 – 22,350
🛑 Stop Loss: 22,525
📝 Plan: If Nifty breaks below 22,467 and struggles to reclaim it, selling pressure may drag it toward 22,378. Wait for a sustained breakdown before taking short positions.
📉 Scenario 3: Gap-Down Opening (Below 22,429) ⚠️
A gap-down below 22,429 signals weakness, with support at 22,378 and 22,258.
Buy near 22,258 – 22,300 🟢
🎯 Target: 22,440
🛑 Stop Loss: 22,220
📝 Plan: If Nifty stabilizes at 22,258-22,300, a bounce toward 22,440 is possible. Ideal for risk-managed long trades.
Sell below 22,258 🔽
🎯 Target: 22,150 – 22,100
🛑 Stop Loss: 22,320
📝 Plan: If selling pressure persists below 22,258, a further slide is likely. Avoid panic selling; wait for confirmation.
💡 Risk Management Tips for Options Traders 🎯
✅ Theta Decay Awareness: Avoid buying OTM options late in the day.
✅ Stop-Loss Discipline: Always use SL based on technical structure.
✅ Position Sizing: Risk only 2% of capital per trade.
✅ Avoid Overtrading: Trade only high-probability setups.
📌 Summary & Conclusion 📌
🔹 Bullish above 22,635 for 22,819.
🔹 Bearish below 22,258 for 22,150.
🔹 Flat open needs confirmation for direction.
🔹 Key support: 22,467-22,496 | 22,258.
🔹 Key resistance: 22,635 | 22,819.
📢 Trade with discipline, follow the plan, and manage risk effectively!
⚠️ Disclaimer:
I am not a SEBI-registered analyst. This analysis is for educational purposes only. Do your own research or consult a financial advisor before trading. 📊📉📈

#NIFTY Intraday Support and Resistance Levels - 06/03/2025Gap up opening expected in nifty above the 22400 level. After opening if it's sustain above this level and gives breakout of 22500 then expected further upside rally upto 22750 level in today's session. In case nifty starts trading below 22400 level then possible downside in index upto 22150 level in opening session.

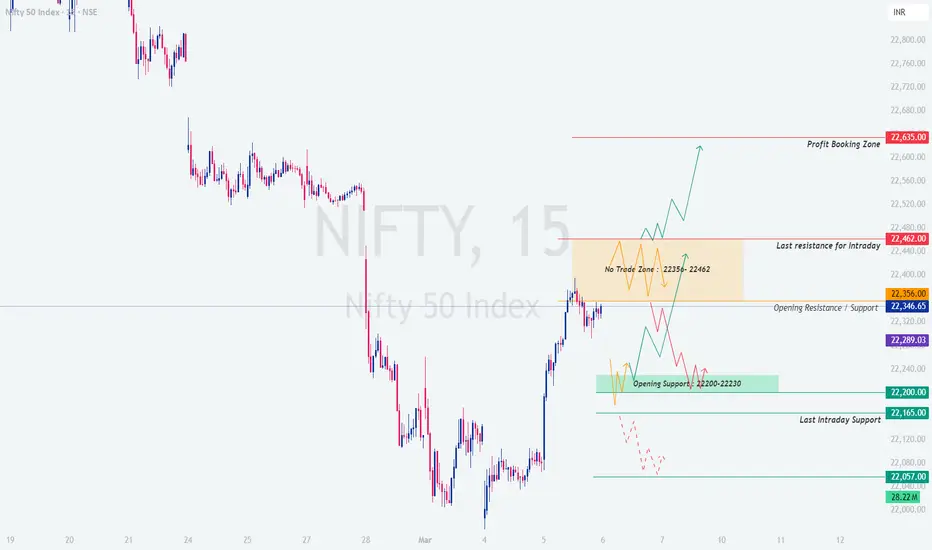
NIFTY : Intraday Trading levels and Plan for 06-Mar-2025Market Context:
Nifty closed at 22,337, with the following key structural levels:
🔴 Profit Booking Zone: 22,635
🟠 No Trade Zone: 22,356 - 22,462
🟢 Opening Support: 22,200 - 22,230
🟩 Last Intraday Support: 22,165 - 22,057
Considering a 100+ point gap opening, let's analyze the possible trading scenarios for the day.
🟢 Scenario 1: Gap-Up Opening (100+ Points Above 22,450)
If Nifty opens above 22,450, it moves into or above the No Trade Zone (22,356 - 22,462).
Sustaining above 22,462 – If the market holds this level with strong momentum, Nifty can rally toward the Profit Booking Zone at 22,635.
Rejection from 22,462 – If price struggles to break above 22,462, it may pull back toward the previous resistance at 22,356, which now acts as support.
If price consolidates inside the No Trade Zone, it signals uncertainty, and traders should wait for a clear direction before taking action.
🔹 Trading Plan:
Go long only if Nifty sustains above 22,462 on an hourly close, targeting 22,635.
Sell below 22,356 if rejection is observed, with a target of 22,289.
Options traders can consider 22,500 CE for long trades and 22,400 PE if rejection occurs.
🟡 Scenario 2: Flat Opening (Within 22,300 - 22,350)
A flat opening near 22,346 places Nifty in a neutral range, requiring confirmation for the next move.
A move above 22,356 will push the index toward the No Trade Zone (22,356 - 22,462). If sustained, a breakout above 22,462 can open room for higher levels.
A drop below 22,300 brings the price closer to the Opening Support Zone (22,200 - 22,230), making this level crucial for short-term buyers.
If price trades between 22,300 - 22,356, wait for a decisive breakout before entering trades.
🔹 Trading Plan:
Avoid taking trades inside the No Trade Zone and wait for a breakout.
Go long above 22,462, targeting 22,635.
Sell below 22,300 for a move toward 22,200, with stop-loss at 22,356.
Options traders can use 22,400 CE for longs and 22,300 PE for shorts.
🔴 Scenario 3: Gap-Down Opening (100+ Points Below 22,200)
A gap-down near 22,200 - 22,057 will bring price into the Opening Support & Last Intraday Support Zones.
Holding 22,200 – If price finds support here, a strong bounce can push Nifty back toward 22,356.
Breaking 22,165 – If selling pressure persists, the next downside target is 22,057, which is the last major support.
If price enters the 22,057 - 22,165 range, this zone could act as a major reversal point based on previous demand zones.
🔹 Trading Plan:
Look for buying opportunities at 22,200 if price shows reversal signals.
If breakdown below 22,165 occurs, wait for confirmation before shorting toward 22,057.
Options traders can use 22,200 PE for breakdown trades and 22,100 CE for bounces.
📊 Risk Management Tips for Options Trading
✅ Use Stop Loss on an Hourly Close Basis – Avoid holding options without confirmation of direction.
✅ Avoid Trading in the No Trade Zone – Let price break out before taking a position.
✅ Monitor India VIX – If volatility is high, premiums may decay faster. Avoid unnecessary trades.
✅ Partial Profit Booking is Key – Secure profits at resistance & support levels instead of waiting for full targets.
✅ Avoid Holding Trades Overnight – Unless there is a strong directional bias, overnight positions carry additional risk.
📌 Summary & Conclusion
Bullish Scenario: Above 22,462, Nifty can rally toward 22,635.
Neutral Zone: If trading between 22,300 - 22,356, wait for confirmation before entering trades.
Bearish Scenario: Below 22,165, weakness can extend toward 22,057, where a bounce is likely.
🔹 Best Risk-Reward Trades:
Buy near 22,200 if support holds.
Sell below 22,165 for a breakdown.
Buy only on a confirmed breakout above 22,462.
⚠️ Disclaimer:
I am not a SEBI-registered analyst. This analysis is for educational purposes only. Please conduct your own research or consult a financial advisor before making any trading decisions.
#NIFTY Intraday Support and Resistance Levels - 05/03/2025Today will be flat or slightly gap up opening expected in nifty near 22100 level. In last trading session nifty consolidated between the 22000-22100 zone. Any major upside rally only expected if nifty starts trading and sustain above 22100 level. Downside 22000 is the crucial support for nifty. Below this support level expected sharp downside fall in index.
