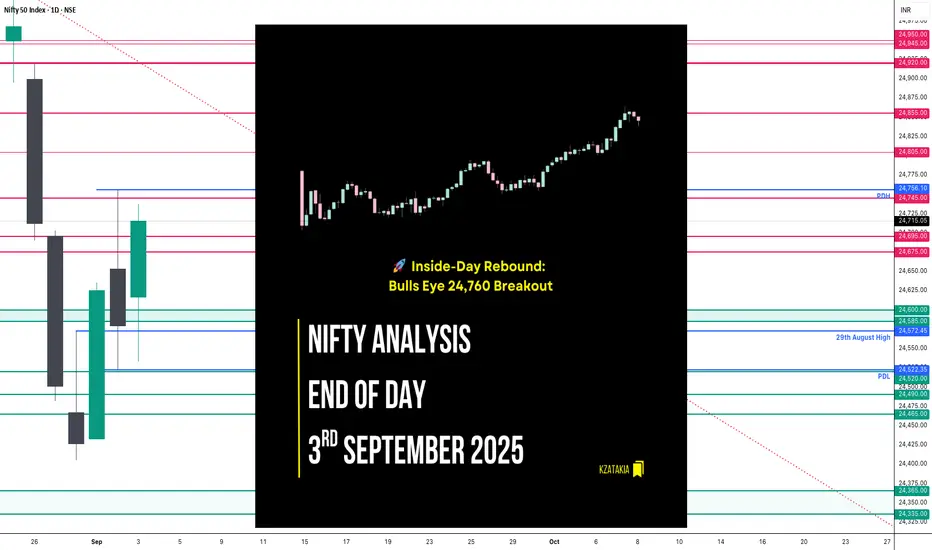
Nifty Analysis EOD – September 3, 2025 – Wednesday🟢 Nifty Analysis EOD – September 3, 2025 – Wednesday 🔴
🚀 Inside-Day Rebound: Bulls Eye 24,760 Breakout
🗞 Nifty Summary
Early in the morning, Gift Nifty indicated a gap of more than 50 points, yet surprisingly, Nifty opened with a GapUp of 55 points. Within the first 5 minutes, it lost 97 points and matched Gift Nifty.
The first 5-min range formed at 24,533 ~ 24,630, and the first half of the session was spent consolidating inside this band. Around 12 PM, a breakout attempt above the range high failed to sustain. However, support at 24,600 held firm, and on the second attempt, bulls pushed strongly, breaking past the range high and rallying without looking back, marking the day high at 24,737.
By the close, Nifty held strong near the high at 24,713.6, almost covering yesterday’s lost ground.
🛡 5 Min Intraday Chart with Levels
🔮 Key Takeaway:
The move stayed entirely inside the previous day’s range.
For bullish continuation, 24,745 ~ 24,760 needs to be broken and sustained.
If tomorrow brings a PDH breakout & hold, the upside levels to watch are 24,800, 24,855, and 24,900.
📉 Daily Time Frame Chart with Intraday Levels
🕯 Daily Candle Breakdown
Open: 24,616.50
High: 24,737.05
Low: 24,533.20
Close: 24,715.05
Change: +135.45 (+0.55%)
📊 Candle Structure
Green candle (Close > Open).
Body: 98.55 points → healthy bullish body.
Upper wick: 22.00 points → very small (close near high).
Lower wick: 83.30 points → strong defense by buyers near 24,533.
📌 This forms a near Bullish Marubozu (open near low, close near high).
🔍 Interpretation
Market opened with mixed sentiment but defended the 24,520 zone strongly.
Bulls stepped in and pushed the index steadily higher.
Closing near the high signals confidence and follow-up buying after yesterday’s hesitation.
🔦 Candle Type
Bullish Marubozu–like candle
Indicates strength and continuation potential.
📉📈 Short-Term View
Resistance: 24,740–24,760 zone (tested again today).
Support: 24,520 (bu
yers defended it successfully).
👉 In short:
Today’s session restored bullish momentum, closing near highs with strong buying interest. A breakout above 24,740–24,760 can open the path toward 24,900, while support remains firm at 24,520.
🛡 5 Min Intraday Chart
⚔️ Gladiator Strategy Update
ATR: 204.95
IB Range: 97.5 → Medium
Market Structure: Balanced
Trade Highlights:
1) 12:20 Long Trade Triggered → SL Hit
2) 13:50 Long Trade Triggered → Target Hit (R:R - 1:2)
📌 Support & Resistance Levels
Resistance Zones:
24,740 ~ 24,760
24,805
24,855
24,900 ~ 24,920
Support Zones:
24,600 ~ 24,585
24,520
24,490 ~ 24,465
⚡ Final Thoughts:
“Markets reward patience. Strong bases create stronger rallies.”
Bulls are back in control, but 24,745+ remains the true hurdle for sustained momentum.
✏️ Disclaimer
This is just my personal viewpoint. Always consult your financial advisor before taking any action.
Niftyreview
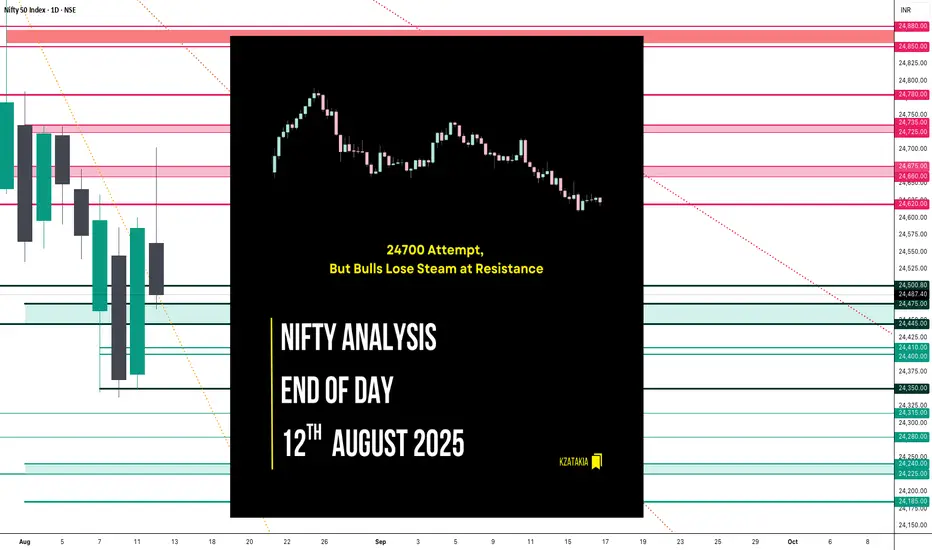
Nifty Analysis EOD – August 12, 2025 – Tuesday🟢 Nifty Analysis EOD – August 12, 2025 – Tuesday 🔴
24700 Attempt, But Bulls Lose Steam at Resistance
🗞 Nifty Summary
Nifty opened 18 points lower and slipped further by 12 points to hit the day’s low at 24,530.75. From there, a steady and confident rally took it one-sided to the 24,700 zone, marking the high at 24,702.60.
As highlighted in yesterday’s note, 24,725 was expected to be a key resistance zone — and right near 24,700, selling pressure emerged. The index slipped back toward the previous day’s close, tried to hold, but dipped again to the day’s low.
A positive sign was that the day’s low held, forming a double bottom pattern, followed by a rise above VWAP. However, failure to sustain above 24,620 saw bulls lose momentum, and bears dragged Nifty to 24,475, finally closing at 24,485.20.
We were expecting a close above 24,660–24,675 to keep bullish momentum intact, but such expectations may be premature while base-building is underway at lower levels.
Today’s price action suggests higher levels are attracting selling pressure, and sentiment shifted despite breaking the previous day’s high. Still, holding the day’s low at the Fib 0.618 retracement of the previous session means tomorrow’s opening above and sustaining this level could lead to a retest of 24,700 — with 24,620 and 24,650 acting as interim hurdles.
Interestingly, since 31st July, price action has shown random intraday swings without clear news or events — a cautionary sign for traders in the coming days.
🛡 5 Min Intraday Chart with Levels
🚶 Intraday Walk
Opened slightly negative, extended minor losses to the day’s low at 24,530.75.
Strong, steady upside rally to 24,700 zone.
Resistance selling kicked in right before the key 24,725 zone.
Sharp fall back toward the previous day’s close, followed by a double-bottom intraday structure.
VWAP break failed to sustain, leading to late-day selling pressure.
Closed well below the morning’s highs, losing bullish momentum.
📉 Daily Time Frame Chart with Intraday Levels
🕯 Daily Candle Breakdown
Today’s Candle Type: Inverted Hammer on a down day.
OHLC:
Open 24,563.35
High 24,702.60
Low 24,465.65
Close 24,487.40
Change −97.65 (−0.40%)
Body: 75.95 points (small)
Upper Wick: 139.25 points (long)
Lower Wick: 21.75 points (small)
Key Observation:
Buyers pushed strongly early but failed to hold — sellers dominated into the close.
What it Implies:
Near-term bearish bias below 24,500; rejection at 24,700 confirms supply zone pressure.
🛡 5 Min Intraday Chart
⚔ Gladiator Strategy Update
ATR: 216.97
IB Range: 171.85 → Medium
Market Structure: ImBalanced
Trade Highlights:
09:20 AM: Long Entry → Target Hit (R:R = 1:1.5)
🎯 What’s Next? / Bias Direction
Bias: Bearish below 24,500.
Supports: 24,460 – 24,420, then 24,350.
Resistances: 24,640 – 24,700.
A sustained open above 24,500 with holding could invite a retest of 24,700, but the path remains choppy.
📌 Support & Resistance Levels
Resistance Zones:
24,620
24,660 ~ 24,675
24,725 ~ 24,735
24,780
Support Zones:
24,475 ~ 24,445
24,410 ~ 24,400
24,350
💡 Final Thoughts
"The market doesn’t care about your hopes — it moves where the pressure flows."
Until the base solidifies, upside rallies will face headwinds. Respect the zones, trade the levels, and let price prove itself.
✏️ Disclaimer
This is just my personal viewpoint. Always consult your financial advisor before taking any action.
NIFTY Expiry Analysis ReviewWe provided a analysis in the morning for NIFTY Expiry by saying sideways momentum.
But morning session 9:15-10 AM momuntum was very strong that VWAP could not hold and it break to downside. But after 10 AM market went into sideways momentum by taking support at 0.5 FIB level.
