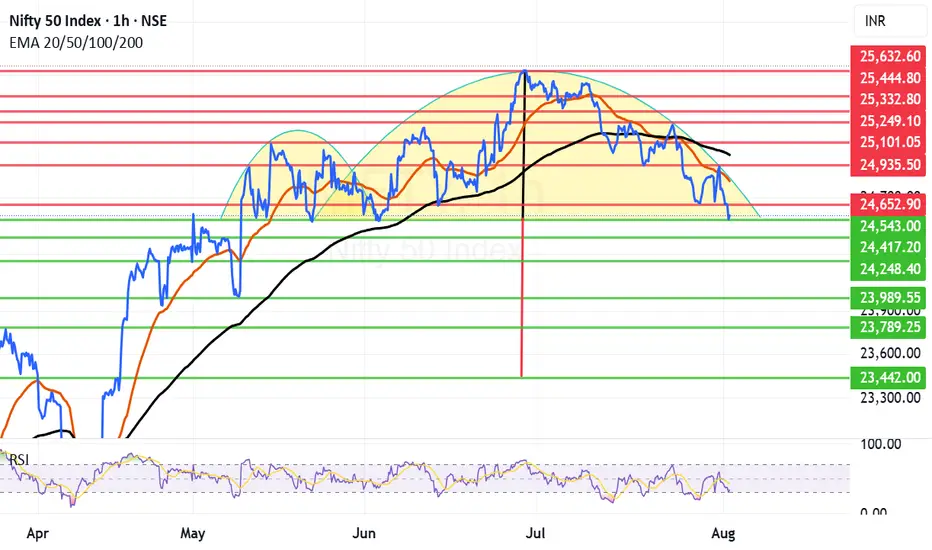
Reverse cup and Handle kind of structure formed in NiftyIn the short term time frame Nifty is seen to be forming reverse cup and handle kind of structure this is considered very bearish structure. However for this bear fest to manifest Nifty needs to close below 24543 or 24417. These 2 levels can save Nifty if not we will see it going into the bear grip.
Thus the most important supports for Nifty remain at 24543 and 24417. Below this level the supports for Nifty will be at 24248, 23989, 23789 and finally major support are is near 23442.
Important resistance areas for Nifty remain at 24652, 24821 (Mother Line Resistance), 24935, 25011 (Father Line Resistance), 25101 and finally 25249. Above 25249 Bulls can become very active.
Till the trade deal chess board and Tariffs do not relent or there is some other very important positive news Nifty will remain under pressure. Let us hope that 24253 or 24417 save us. Long term outlook on Nifty still remains positive. Long term investors should look at the tariff related event as a news that will slowly subside and give way to the Bullish outlook which has been prevailing in the market for decades all together.
Disclaimer: The above information is provided for educational purpose, analysis and paper trading only. Please don't treat this as a buy or sell recommendation for the stock or index. The Techno-Funda analysis is based on data that is more than 3 months old. Supports and Resistances are determined by historic past peaks and Valley in the chart. Many other indicators and patterns like EMA, RSI, MACD, Volumes, Fibonacci, parallel channel etc. use historic data which is 3 months or older cyclical points. There is no guarantee they will work in future as markets are highly volatile and swings in prices are also due to macro and micro factors based on actions taken by the company as well as region and global events. Equity investment is subject to risks. I or my clients or family members might have positions in the stocks that we mention in our educational posts. We will not be responsible for any Profit or loss that may occur due to any financial decision taken based on any data provided in this message. Do consult your investment advisor before taking any financial decisions. Stop losses should be an important part of any investment in equity.
Niftysupports
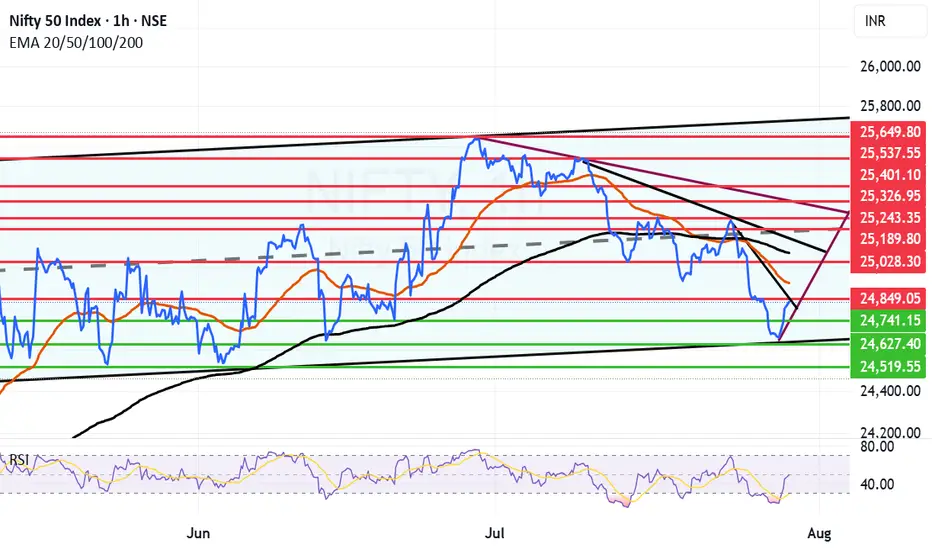
Good turnaround by market as expected from the channel bottom.We had given a message that the market was nearing the bottom and there can be a turnaround sooner than later and market turned around today. This bounce can be currently seen as a technical bounce but it can become a full fledged fightback by bulls if it crosses key resistance levels of Mother line, Father line and Mid-channel resistance. These are the 3 key resistances in front of us currently. All eyes on the important trade deal announcements and with US and China which are on going any news on that from can disrupt the market proceedings in either way. Support and resistance levels for Nifty are as under:
Key Nifty Resistances: 24849 (Trend line resistance), 24922 (Motherline Resistance of hourly chart), 25028, 25070 (Father line resistance), 25189 (Mid-channel resistance), 25243 (Very important resistance for Bulls to conquer). Above 25243 Bulls can gain control of Nifty.
Key Support levels: 25741, 25627 (Channel bottom Support), 24519.
Disclaimer: The above information is provided for educational purpose, analysis and paper trading only. Please don't treat this as a buy or sell recommendation for the stock or index. The Techno-Funda analysis is based on data that is more than 3 months old. Supports and Resistances are determined by historic past peaks and Valley in the chart. Many other indicators and patterns like EMA, RSI, MACD, Volumes, Fibonacci, parallel channel etc. use historic data which is 3 months or older cyclical points. There is no guarantee they will work in future as markets are highly volatile and swings in prices are also due to macro and micro factors based on actions taken by the company as well as region and global events. Equity investment is subject to risks. I or my clients or family members might have positions in the stocks that we mention in our educational posts. We will not be responsible for any Profit or loss that may occur due to any financial decision taken based on any data provided in this message. Do consult your investment advisor before taking any financial decisions. Stop losses should be an important part of any investment in equity.
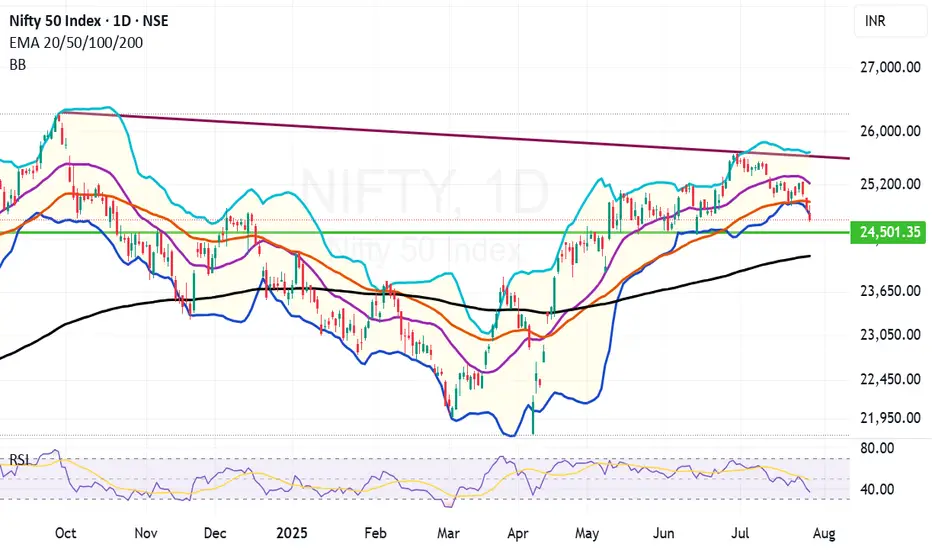
Bollinger band indicates that we might see a recovery soon. Bollinger band in a beautiful tool of Technical analysis. There are three lines in it. The upper bandwidth line, the middle line and the lower band width line.
As you can see in the chart. Whenever the stock or an index price touches or crosses the upper line the indication it gives is that the market is overbought and there is an imminent selling pressure.
Middle line indicates either resistance or support depending on the position of the candle within the band. It further indicates that Middle line will be support when the price is above it. It also indicates that middle Bollinger band will be a resistnace when the candles are below it.
Lower bandwidth line indicates a support zone. When the candles touch or cross it the indication it gives is that the market is oversold and there can be an imminent up move once this phenomenon happens.
Bollinger band in like a channel or a parallel chanel but a more accurate one and a more asymmetric one.
Currently you can see in the chart that Bollinger band has not only touched but also crossed the bottom bandwidth. This is an indication of an over sold market. Thus the indications we get from this tool are that there are very high chances for a short covering recovery or relief rally.
The indication is in sync with Tariff deadline which is tomorrow. Thus any positive announcement on that front can also initiate a strong or mild recovery rally. Thus we might see a bottom formation and recovery rather sooner than later.
Current Nifty closing is at:24680.
Upper band width is at: 25683 (This zone will work as strong resistance zone).
Mid Bandwidth is at: 25217 (This zone will be a Strong resistance).
Mother Line: 24942 (Strong Resistance).
Lower band width is at: 24750 (Weak Resistance).
Nearby support: 24501 (Support).
Father Line: 24157 (Strong Support).
It is a good time to reshuffle your Portfolios and initiate fresh buying in the blue-chip stocks which might be available at a good valuation.
Disclaimer: The above information is provided for educational purpose, analysis and paper trading only. Please don't treat this as a buy or sell recommendation for the stock or index. The Techno-Funda analysis is based on data that is more than 3 months old. Supports and Resistances are determined by historic past peaks and Valley in the chart. Many other indicators and patterns like EMA, RSI, MACD, Volumes, Fibonacci, parallel channel etc. use historic data which is 3 months or older cyclical points. There is no guarantee they will work in future as markets are highly volatile and swings in prices are also due to macro and micro factors based on actions taken by the company as well as region and global events. Equity investment is subject to risks. I or my clients or family members might have positions in the stocks that we mention in our educational posts. We will not be responsible for any Profit or loss that may occur due to any financial decision taken based on any data provided in this message. Do consult your investment advisor before taking any financial decisions. Stop losses should be an important part of any investment in equity.
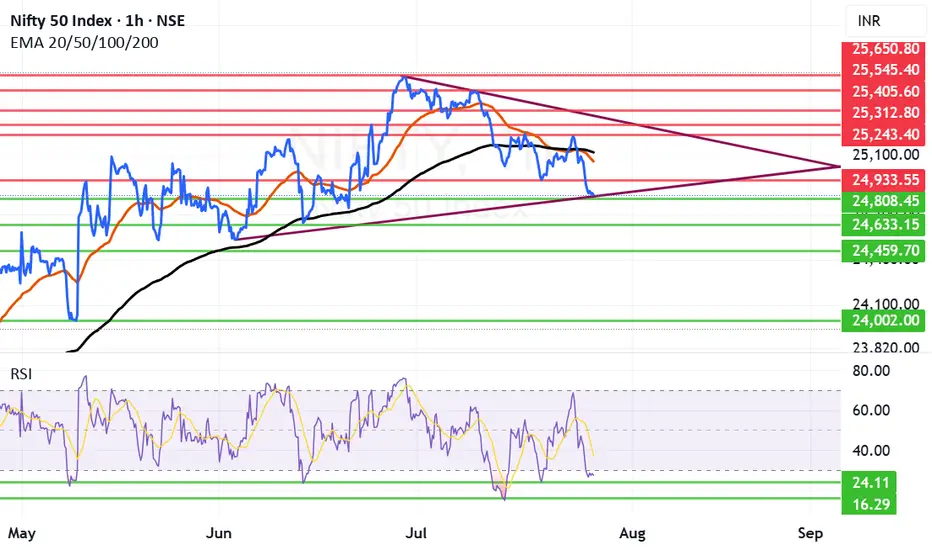
Nifty Next Week: Can Nifty make a comeback after drubbing?Nifty received proper drubbing after falling below critical supports of Mother and Father line. Trump's warning signals for IT companies and the continuing deadlock in Trade deal with US weighing on Indian markets. Additionally the earning season also giving many disappointing and few good result has broken the back of the Bull rally and now Nifty is reeling under 25K levels.
Only silver line in the cloud seems to be that RSI is below 30. Currently RSI is at 27.52. Usually RSI has found support near 24 if not 24 it might bounce back from 16. So hopefully we can see some short covering in the beginning or middle of next week. Also next week the decision for Tariffs should come. If the result will be in favour of India we might see a strong come back as lot of sectors / Large cap stocks currently are looking oversold.
The Supports for Nifty Remain at: 24808 (Strong support), 24633, 24459 Below 24459 the index will be in firm grip of Bears who might try to drag Nifty towards 24K levels or even below that in unlikely circumstances.
The Resistances for Nifty Remain at: 24933, 25058 (Mother Line Resistance of Daily Chart), 25119 (Father Line Resistance) and 25243. After we get a closing above 25243 the Bulls can gain some momentum.
Disclaimer: The above information is provided for educational purpose, analysis and paper trading only. Please don't treat this as a buy or sell recommendation for the stock or index. The Techno-Funda analysis is based on data that is more than 3 months old. Supports and Resistances are determined by historic past peaks and Valley in the chart. Many other indicators and patterns like EMA, RSI, MACD, Volumes, Fibonacci, parallel channel etc. use historic data which is 3 months or older cyclical points. There is no guarantee they will work in future as markets are highly volatile and swings in prices are also due to macro and micro factors based on actions taken by the company as well as region and global events. Equity investment is subject to risks. I or my clients or family members might have positions in the stocks that we mention in our educational posts. We will not be responsible for any Profit or loss that may occur due to any financial decision taken based on any data provided in this message. Do consult your investment advisor before taking any financial decisions. Stop losses should be an important part of any investment in equity.
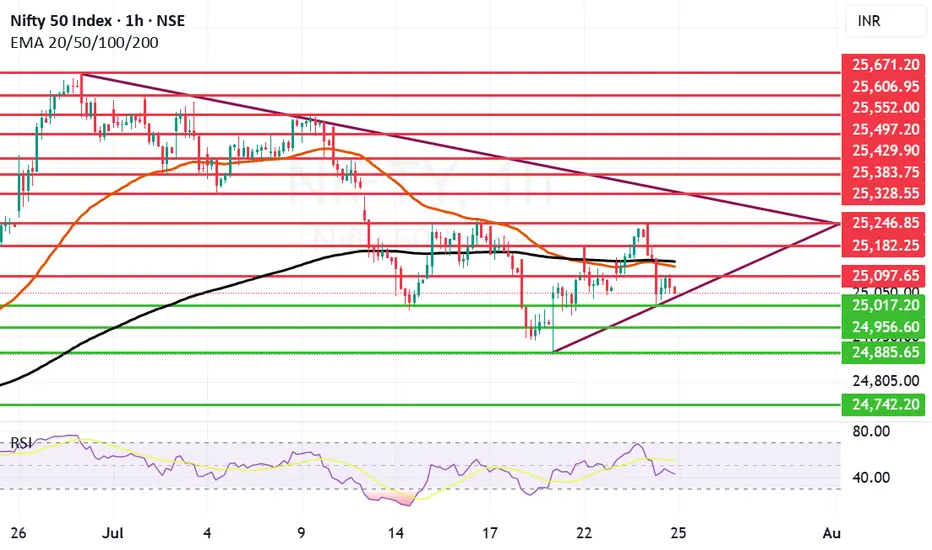
Nifty falls again as it can not sustain above 25240 level. Nifty again has shown some weakness as it was not able to sustain levels above 25240. The fall was lead by IT index which ended with deep cuts and fell 2.12% the other indices that saw fall were FMCG, Realty and Small Cap index. Trump's stance against Tech companies hiring from India and the deadlock in the trade deal also contributed to fall today. Index fell 157.8 points today and ended below both Mother and line on hourly chart. In the daily chart the candle we saw today was a bearish engulfing candle so further weakness can not be ruled out. The 2 major supports for nifty remain at 25017 and 24956 if these two supports are broken we may see Nifty falling towards 24885 or even 24742. Resistances for Nifty remain at 25097, 25138, 25182 and 25246. Only after we get a closing above 25246 we can see Nifty rally upwards.
Disclaimer: The above information is provided for educational purpose, analysis and paper trading only. Please don't treat this as a buy or sell recommendation for the stock or index. The Techno-Funda analysis is based on data that is more than 3 months old. Supports and Resistances are determined by historic past peaks and Valley in the chart. Many other indicators and patterns like EMA, RSI, MACD, Volumes, Fibonacci, parallel channel etc. use historic data which is 3 months or older cyclical points. There is no guarantee they will work in future as markets are highly volatile and swings in prices are also due to macro and micro factors based on actions taken by the company as well as region and global events. Equity investment is subject to risks. I or my clients or family members might have positions in the stocks that we mention in our educational posts. We will not be responsible for any Profit or loss that may occur due to any financial decision taken based on any data provided in this message. Do consult your investment advisor before taking any financial decisions. Stop losses should be an important part of any investment in equity.
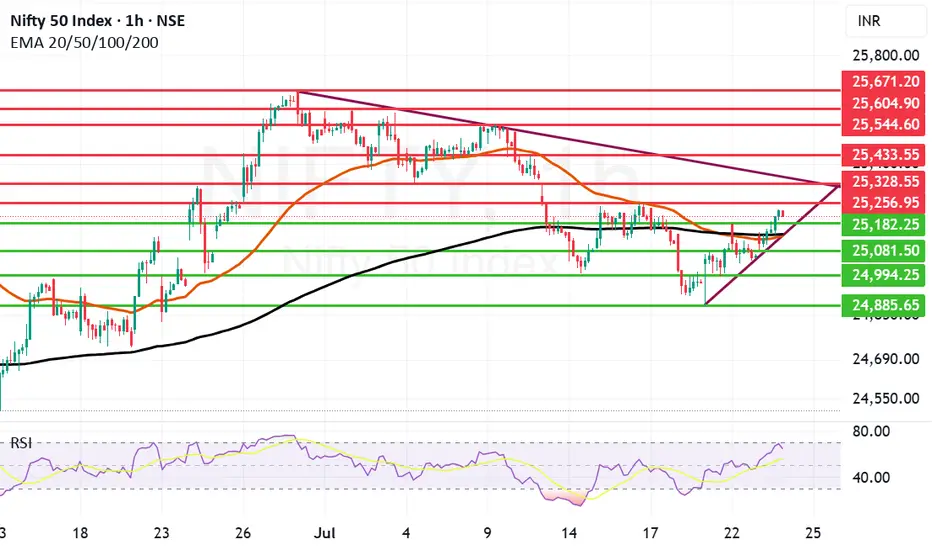
Strong Comeback by Nifty few Resistances ahead.Nifty made a remarkable comeback today ending 159 points up closing at 25219. Infosys has posted better than expected result and as of now the Infosys ADR is up by 1.26%. So if there is a turnaround in the IT sector we can see Nifty fly upwards.
The next resistance ahead of Nifty is at 25256 if we get a closing above this the next will be at 25328. These 2 will be critical resistances to cross. Once we get a closing above 25328 Nifty can target 25433 and 25544. Above 25544 Nifty becomes very strong. In case Nifty is not able to cross 25256 or 25328 levels the supports for Nifty are at 25182. After this zone there is a dual support of Mother and Father line of Hourly chart at 25136 and 25142.
These are very strong supports. (Thus the zone between 25182 to 25136 is full of supports). We hope that these supports are held. In case we get a closing below 25136 Nifty will again fall into bearish territory and can plunge towards 25081, 24994 or even 24885.
The shadow of the candles right now is positive but 2 very important resistances mentioned earlier are yet to crossed so game is in balance but only slightly in favour of Bulls.
Disclaimer: The above information is provided for educational purpose, analysis and paper trading only. Please don't treat this as a buy or sell recommendation for the stock or index. The Techno-Funda analysis is based on data that is more than 3 months old. Supports and Resistances are determined by historic past peaks and Valley in the chart. Many other indicators and patterns like EMA, RSI, MACD, Volumes, Fibonacci, parallel channel etc. use historic data which is 3 months or older cyclical points. There is no guarantee they will work in future as markets are highly volatile and swings in prices are also due to macro and micro factors based on actions taken by the company as well as region and global events. Equity investment is subject to risks. I or my clients or family members might have positions in the stocks that we mention in our educational posts. We will not be responsible for any Profit or loss that may occur due to any financial decision taken based on any data provided in this message. Do consult your investment advisor before taking any financial decisions. Stop losses should be an important part of any investment in equity.
Nifty has taken support at Mother line as expected.Despite poor showing by Reliance post result and TCS continuing to fall Nifty staged a remarkable comeback on the back of Pvt Sector banking which did well. Bank Nifty came back strongly posting 1.19% gains today which enabled Nifty to rise 122 points or 0.49%. Capital Goods, Finance and Metals indices also gained more than 1% each.
Resistances for Nifty now remain at: 25150, 25277 (Trend line resistance), 25448, 25684 and finally channel top resistance at 25915.
Supports for Nifty remain at: 24938 (Mother Line Support of Daily Chart), 24759, 24503, 24259 and finally 24116 (Father Line support of Daily chart).
Shadow of the candle right now is neutral to positive and RSI is 47.63 with median RSI resistance at 54.09.
Disclaimer: The above information is provided for educational purpose, analysis and paper trading only. Please don't treat this as a buy or sell recommendation for the stock or index. The Techno-Funda analysis is based on data that is more than 3 months old. Supports and Resistances are determined by historic past peaks and Valley in the chart. Many other indicators and patterns like EMA, RSI, MACD, Volumes, Fibonacci, parallel channel etc. use historic data which is 3 months or older cyclical points. There is no guarantee they will work in future as markets are highly volatile and swings in prices are also due to macro and micro factors based on actions taken by the company as well as region and global events. Equity investment is subject to risks. I or my clients or family members might have positions in the stocks that we mention in our educational posts. We will not be responsible for any Profit or loss that may occur due to any financial decision taken based on any data provided in this message. Do consult your investment advisor before taking any financial decisions. Stop losses should be an important part of any investment in equity.
Can Reliance and Banks turn Nifty around? do or die Monday. Nifty as of now has taken support at Mother line in daily chart. As expected in my Yesterday's message. So Hopefully if Big Banks Results are in line tomorrow we might see Nifty going upwards from Monday.
Mota Bhai just announced the results. EBITDA is slightly less than expected but Net Profit and Revenue is much better than Market expectation. In my view market should react positively to this result.
Supports For Nifty remain at 24932 (Mother line), 24759, 24503. As indicated earlier if we get a closing below 24503 we may see a Fall towards 24106 or 23929 (In unlikely circumstances).
Nifty Resistances remain at: 25035, 25248, 25400 and 25613 (Channel top Resistance).
Results for tomorrow
HDFC BANK
ICICIBANK
AUSMALL BANK
RBL BANK
UNION BANK
YES BANK
CENTR BANK
PUNJA BANK
CENTR BANK
So it seems like a Do or Die Monday on cards. Shadow of the candle looks neutral as of now.
Disclaimer: The above information is provided for educational purpose, analysis and paper trading only. Please don't treat this as a buy or sell recommendation for the stock or index. The Techno-Funda analysis is based on data that is more than 3 months old. Supports and Resistances are determined by historic past peaks and Valley in the chart. Many other indicators and patterns like EMA, RSI, MACD, Volumes, Fibonacci, parallel channel etc. use historic data which is 3 months or older cyclical points. There is no guarantee they will work in future as markets are highly volatile and swings in prices are also due to macro and micro factors based on actions taken by the company as well as region and global events. Equity investment is subject to risks. I or my clients or family members might have positions in the stocks that we mention in our educational posts. We will not be responsible for any Profit or loss that may occur due to any financial decision taken based on any data provided in this message. Do consult your investment advisor before taking any financial decisions. Stop losses should be an important part of any investment in equity.
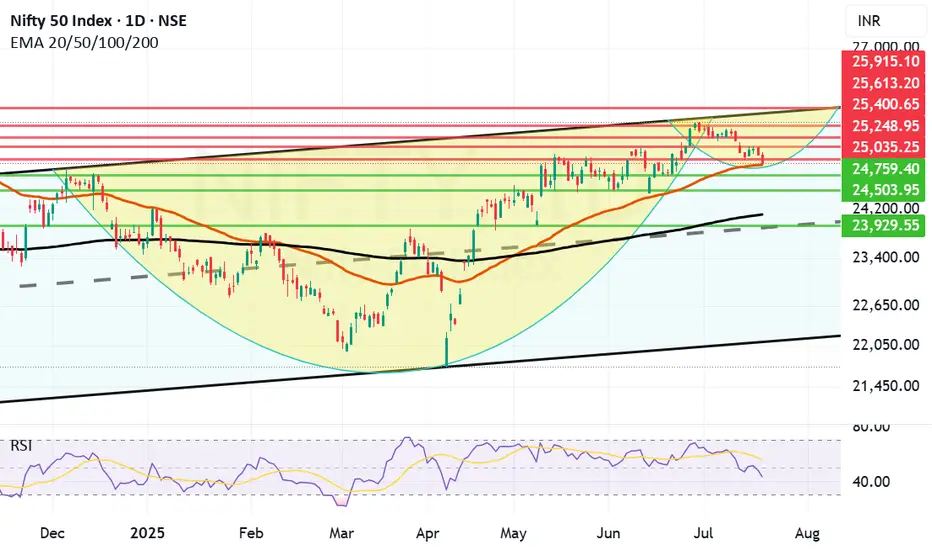
If Mother Line Support will hold, we might see a C&H formation. Although we saw a negative closing today, the chart suggests that if Mother line support will hold we might see a reversal and a Cup and Handle Formation in the near future. Cup and Handle formation is a great pattern which can help us reach the previous high and surpass it. If it happens or not only time can tell.
Supports For Nifty right now remain at: 25035, 24930 (Important Mother Line Support of Daily chart), 24759 and 24503. If 24503 is broken then there will be overall weakness in the market and we can see Nifty plummeting to 24097 (Father Line Support of Daily chart). Just below 24907 there will also be the mid channel support of 23929. (Just in case we reach there).
Resistances For Nifty Remain at: 25248, 25400, 25613 and 25915 seems to be the channel top as of now.
Nifty is delicately placed and the support of 24930 and Resistance of 25248 are the key levels to be watched. Above 25248 Bulls become strong. Below 24930 Bears become strong. Right now we are in no man's land with shadow of the candle slightly negative. If we see a bounce tomorrow or from the Mother line the shadow will has potential to turn positive later in the day tomorrow or next week.
Short term Outlook: Neutral to negative.
Medium Term Outlook: Neutral to Positive.
Long Term Outlook: Positive.
Disclaimer: The above information is provided for educational purpose, analysis and paper trading only. Please don't treat this as a buy or sell recommendation for the stock or index. The Techno-Funda analysis is based on data that is more than 3 months old. Supports and Resistances are determined by historic past peaks and Valley in the chart. Many other indicators and patterns like EMA, RSI, MACD, Volumes, Fibonacci, parallel channel etc. use historic data which is 3 months or older cyclical points. There is no guarantee they will work in future as markets are highly volatile and swings in prices are also due to macro and micro factors based on actions taken by the company as well as region and global events. Equity investment is subject to risks. I or my clients or family members might have positions in the stocks that we mention in our educational posts. We will not be responsible for any Profit or loss that may occur due to any financial decision taken based on any data provided in this message. Do consult your investment advisor before taking any financial decisions. Stop losses should be an important part of any investment in equity.
Nifty has taken support at 25K but can the support hold?Nifty today took a meaningful support at 25001 and bounced close to 25082. However ending the was in the negative by 67.55 points. RSI today went as low as 13.52 indication of oversold market. IT was a major drag after result that market did not like.
Now the resistances in front of Nifty are at 25106, Father Line Resistance at 25106, 25234, Mother Line Resistance at 25297, 25403 and finally 25543. Supports for Nifty remain at 25K, 24866 Chanel Bottom support and finally 24752. Below 24752 Bears can totally take control of the market if we reach there.
Things are in balance right now with Mid-cap, Small-cap starting to see some buying. If IT can hold the levels we will see growth from here. If IT index further caves in and other indices do not support we can see a down side. Shadow of the candle right now is neutral to negative.
Disclaimer: The above information is provided for educational purpose, analysis and paper trading only. Please don't treat this as a buy or sell recommendation for the stock or index. The Techno-Funda analysis is based on data that is more than 3 months old. Supports and Resistances are determined by historic past peaks and Valley in the chart. Many other indicators and patterns like EMA, RSI, MACD, Volumes, Fibonacci, parallel channel etc. use historic data which is 3 months or older cyclical points. There is no guarantee they will work in future as markets are highly volatile and swings in prices are also due to macro and micro factors based on actions taken by the company as well as region and global events. Equity investment is subject to risks. I or my clients or family members might have positions in the stocks that we mention in our educational posts. We will not be responsible for any Profit or loss that may occur due to any financial decision taken based on any data provided in this message. Do consult your investment advisor before taking any financial decisions. Stop losses should be an important part of any investment in equity.
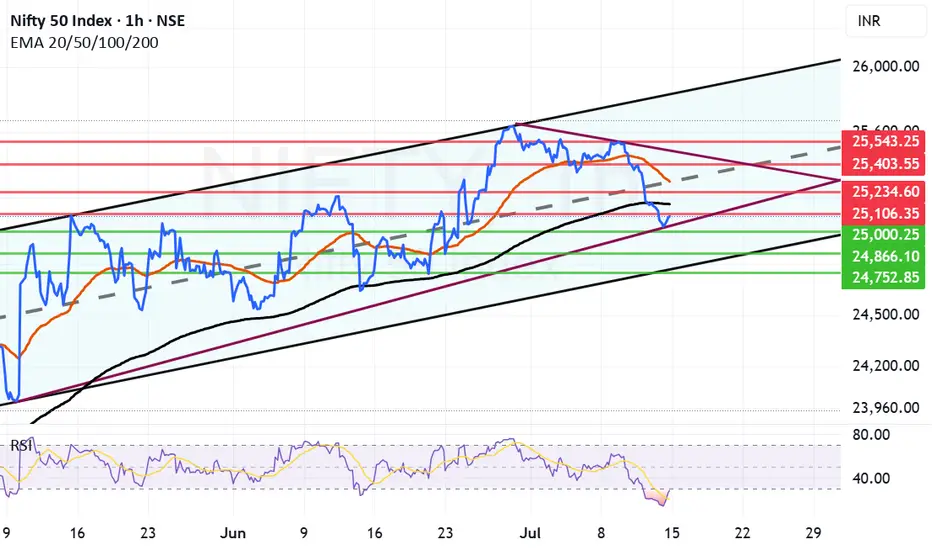
Nifty approaching Mid-channel support zone now. Nifty after a 120 point negative closing is entering an important support zone. This support zone has 3 layers. The First of the support lies at 25322 which is just above the mid-channel. The second for Nifty is near 25222 which is just below the mid channel support.
There is a possibility of bounce either from the current level or either of these 2 levels. If we get a closing below 25322 then there is a possibility that bears might try to pull Nifty down towards 25167 which is the Father line or 200 Hours EMA.
The resistances for Nifty remain at 25404, 25437 which is the Mother line or 50 hours EMA. Post that there are resistances at 25477, 25551 and 25641. Closing above 25641 is required for Nifty to fly towards 26K levels.
Disclaimer: The above information is provided for educational purpose, analysis and paper trading only. Please don't treat this as a buy or sell recommendation for the stock or index. The Techno-Funda analysis is based on data that is more than 3 months old. Supports and Resistances are determined by historic past peaks and Valley in the chart. Many other indicators and patterns like EMA, RSI, MACD, Volumes, Fibonacci, parallel channel etc. use historic data which is 3 months or older cyclical points. There is no guarantee they will work in future as markets are highly volatile and swings in prices are also due to macro and micro factors based on actions taken by the company as well as region and global events. Equity investment is subject to risks. I or my clients or family members might have positions in the stocks that we mention in our educational posts. We will not be responsible for any Profit or loss that may occur due to any financial decision taken based on any data provided in this message. Do consult your investment advisor before taking any financial decisions. Stop losses should be an important part of any investment in equity.
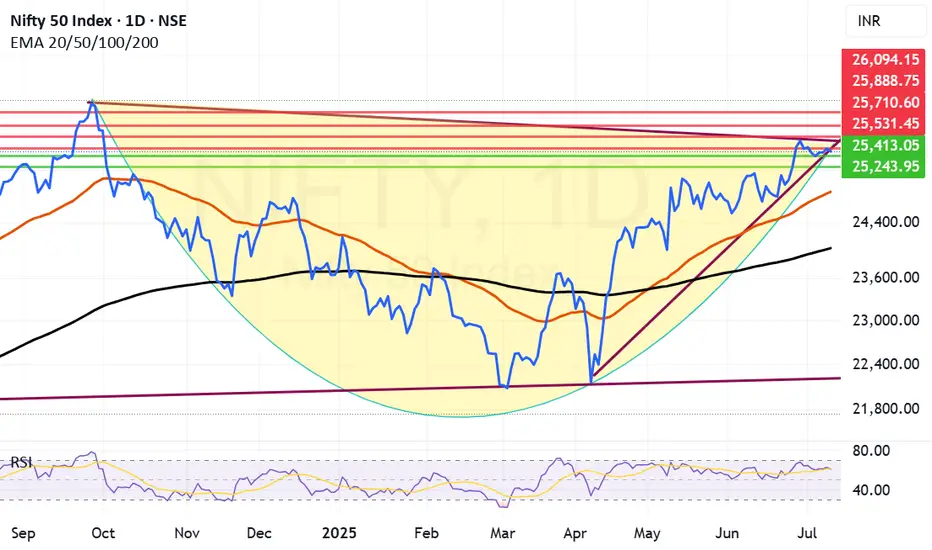
Range Bound consolidation going on in the market. Range bound consolidation is going on in the market. As you can see in the chart there is consolidation going on before a substantial up or down move happens. Mostly it looks like Tariff negation deadline will be extended or India might end up getting the tariff deal sealed. all eyes on Trump and TCS results tomorrow. TCS has been reeling close to an year now after making a high of 4592 everything depends on the result tomorrow. The result can give direction to the market as TCS has good weightage (Around 6.09% in Nifty and 7.43% in BSE Sensex). TCS has 21.93% Weightage in Nifty IT index so the result tomorrow is a must watch. It can give direction to the It index as well.
Supports for Nifty remain at 25413 and 25243. If by chance this level is broken Nifty can fall further towards Mother line which is at 24862 or in worst case scenario towards Father line of daily chart at 24030.
Resistances for Nifty remain at: 25531 and 25710 Closing above which Nifty becomes very strong. After we get a closing above 25710 Nifty can swiftly move towards 25888 or even 26K+ levels.
Disclaimer: The above information is provided for educational purpose, analysis and paper trading only. Please don't treat this as a buy or sell recommendation for the stock or index. The Techno-Funda analysis is based on data that is more than 3 months old. Supports and Resistances are determined by historic past peaks and Valley in the chart. Many other indicators and patterns like EMA, RSI, MACD, Volumes, Fibonacci, parallel channel etc. use historic data which is 3 months or older cyclical points. There is no guarantee they will work in future as markets are highly volatile and swings in prices are also due to macro and micro factors based on actions taken by the company as well as region and global events. Equity investment is subject to risks. I or my clients or family members might have positions in the stocks that we mention in our educational posts. We will not be responsible for any Profit or loss that may occur due to any financial decision taken based on any data provided in this message. Do consult your investment advisor before taking any financial decisions. Stop losses should be an important part of any investment in equity.
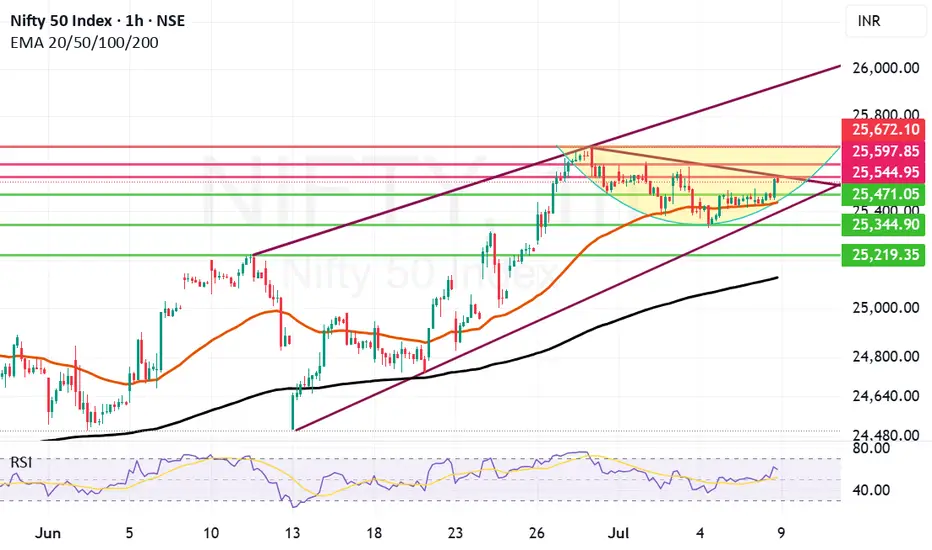
Closing above 25544 should be first step for Nifty to break freeNifty today closed in positive but still it might not be free enough to crate further bull run. the first step that Nifty needs to take to get out of this range bound trade zone or consolidation is to get a closing above 25544.
Further to this step it my find resistances at 25597, 25672. Once we close above 25672 the possibility that Bulls can regaining 26K levels and go even higher becomes stronger.
The Supports for Nifty currently remain at 25471, 25437 which is Mother line or 50 Hours EMA, 25344, 25219 and finally 25125. 25125 is the Father line support or 200 hours EMA. Closing below 25215 will empower Bears to drag Nifty further down wards.
Disclaimer: The above information is provided for educational purpose, analysis and paper trading only. Please don't treat this as a buy or sell recommendation for the stock or index. The Techno-Funda analysis is based on data that is more than 3 months old. Supports and Resistances are determined by historic past peaks and Valley in the chart. Many other indicators and patterns like EMA, RSI, MACD, Volumes, Fibonacci, parallel channel etc. use historic data which is 3 months or older cyclical points. There is no guarantee they will work in future as markets are highly volatile and swings in prices are also due to macro and micro factors based on actions taken by the company as well as region and global events. Equity investment is subject to risks. I or my clients or family members might have positions in the stocks that we mention in our educational posts. We will not be responsible for any Profit or loss that may occur due to any financial decision taken based on any data provided in this message. Do consult your investment advisor before taking any financial decisions. Stop losses should be an important part of any investment in equity.
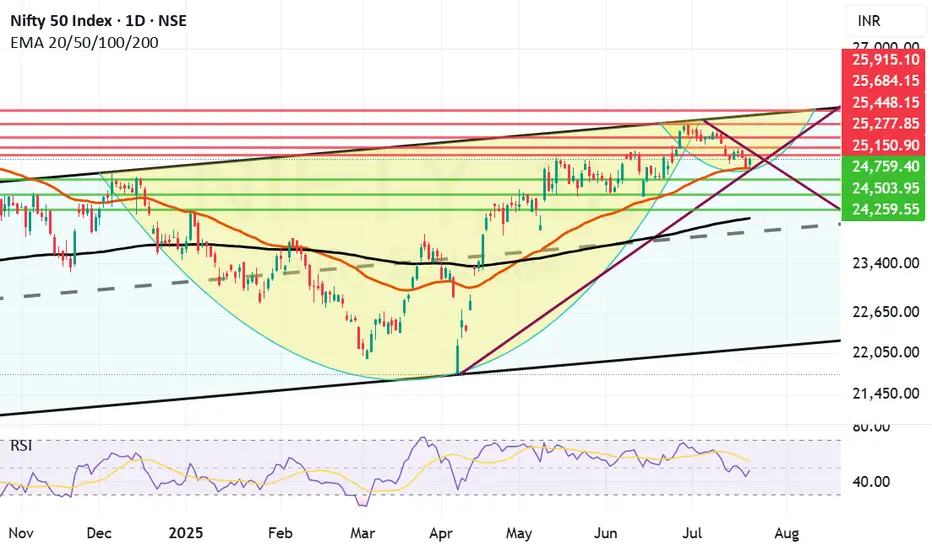
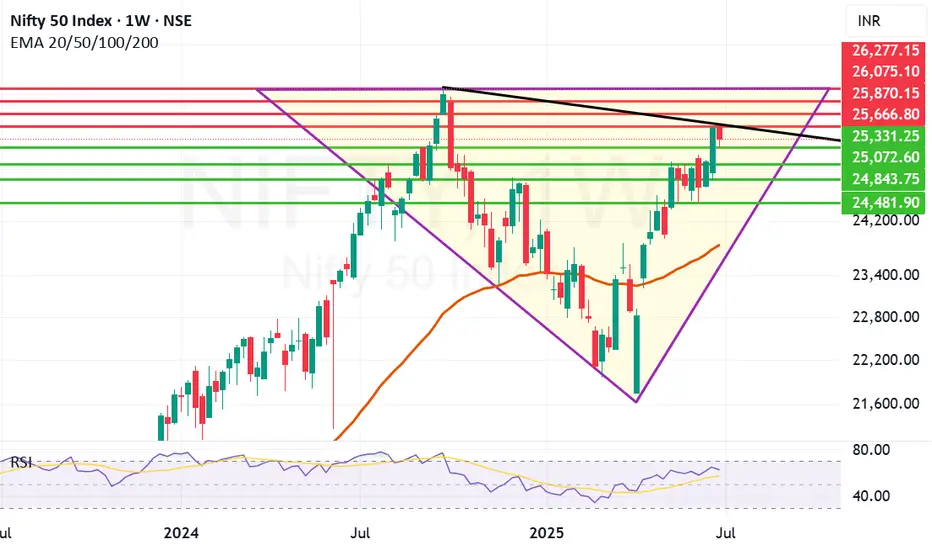
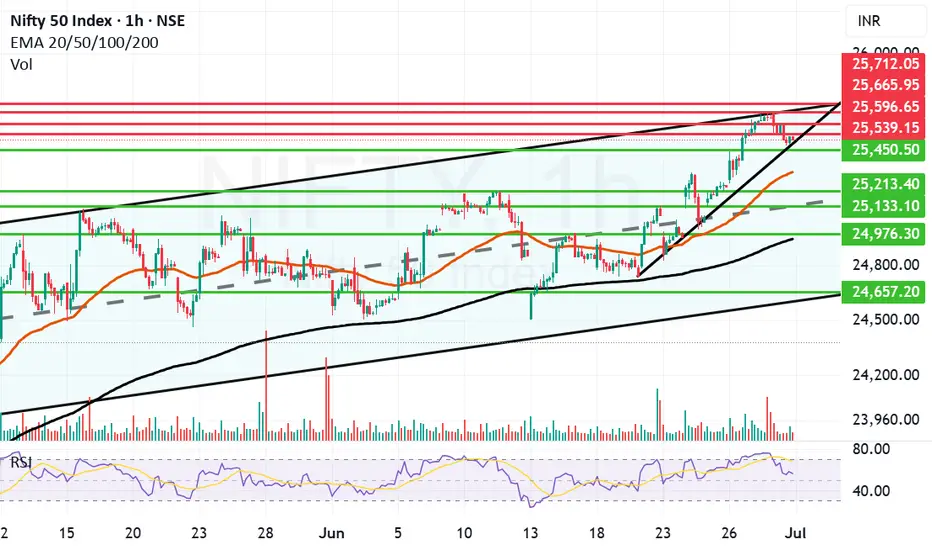
Good Closing by Nifty: Trump Tariff decision awaits us next weekNifty closed the week at 25461 well after gaining 130 points from Friday low of 25331. Overall Nifty closed 55 point positive from Thursday closing. This was a very smart recovery of Nifty from the lows of the day but we are heading towards Trump Tariff deadline of 9th July. That has potential to shake the market and move it any direction so investors should keep an eye on the developments and keep their stop losses and trailing stop losses in place. Overall Nifty is on the path to V shaped recovery as indicated in the chart. If everything works out in favour of India in the negotiation the 816 point gap from previous all time high will be bridged sooner than later. Once we reach the Previous All-time high the recovery will be complete. But we have to be cautiously optimistic.
Nifty supports currently remain at: 25331, 25072, 24843, 24481. If 24481 is broken than Bears will try to drag Nifty towards 23840 (Which is the Mother line of Weekly Chart).
Nifty Resistances currently remain at: 25666 (Trend line Resistance), 25870, 26075, 26277 (Previous All time high).
Disclaimer: The above information is provided for educational purpose, analysis and paper trading only. Please don't treat this as a buy or sell recommendation for the stock or index. The Techno-Funda analysis is based on data that is more than 3 months old. Supports and Resistances are determined by historic past peaks and Valley in the chart. Many other indicators and patterns like EMA, RSI, MACD, Volumes, Fibonacci, parallel channel etc. use historic data which is 3 months or older cyclical points. There is no guarantee they will work in future as markets are highly volatile and swings in prices are also due to macro and micro factors based on actions taken by the company as well as region and global events. Equity investment is subject to risks. I or my clients or family members might have positions in the stocks that we mention in our educational posts. We will not be responsible for any Profit or loss that may occur due to any financial decision taken based on any data provided in this message. Do consult your investment advisor before taking any financial decisions. Stop losses should be an important part of any investment in equity.
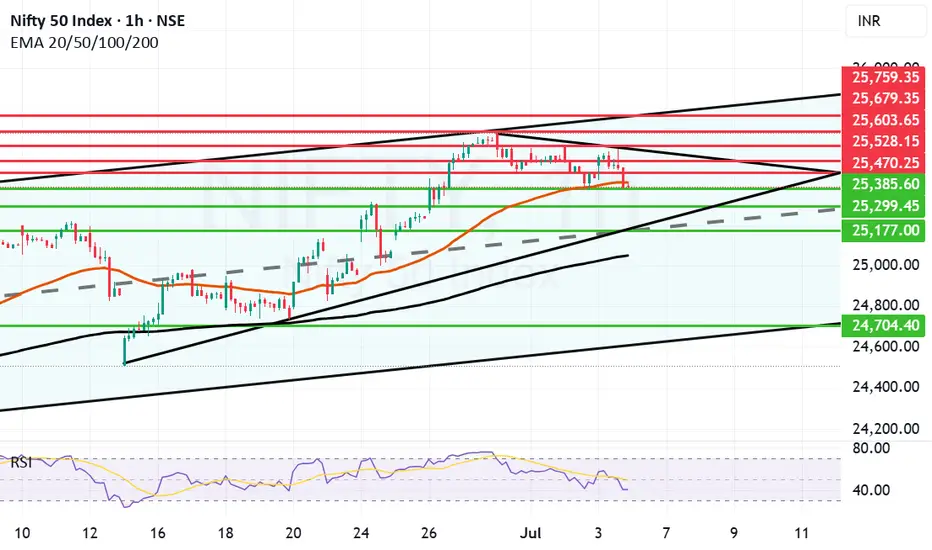
Nifty facing strong resistance between 25587 and 25500. Nifty today again failed to hold levels above 25500 as it made a high of 25587 and closed at 25405. Closing almost 182 point from its high today and 48 points down from yesterday. This is a worrying sign even if just slightly as for moving towards 26K we need a strong closing of the week at least above the Mother line. Nifty closed just below Motherline today which is showing some weakness in the rally which seems to be losing direction. The fear of Tariffs seems to be taking toll on Bulls whereas bears are currently gaining strength. The closing we get tomorrow will indicate a definitive direction to Nifty.
The Supports for Nifty currently remain at: 25385, 25299, 25177 (strong trend line support) and finally we will have Father line support of Hourly candles which is at 25050. Closing 25050 below will have potential to drag Nifty further down towards 24700 which is again a strong Channel bottom support.
The Resistances for Nifty currently remain at: 25416 (Mother line Resistance), 25470, The zone between 25500 and 25587 is a strong Trend line resistance. A closing above 25587 will have potential to take Nifty towards 25603, 25679 or even 25759 (Which is again a strong Channel top resistance).
Disclaimer: The above information is provided for educational purpose, analysis and paper trading only. Please don't treat this as a buy or sell recommendation for the stock or index. The Techno-Funda analysis is based on data that is more than 3 months old. Supports and Resistances are determined by historic past peaks and Valley in the chart. Many other indicators and patterns like EMA, RSI, MACD, Volumes, Fibonacci, parallel channel etc. use historic data which is 3 months or older cyclical points. There is no guarantee they will work in future as markets are highly volatile and swings in prices are also due to macro and micro factors based on actions taken by the company as well as region and global events. Equity investment is subject to risks. I or my clients or family members might have positions in the stocks that we mention in our educational posts. We will not be responsible for any Profit or loss that may occur due to any financial decision taken based on any data provided in this message. Do consult your investment advisor before taking any financial decisions. Stop losses should be an important part of any investment in equity.
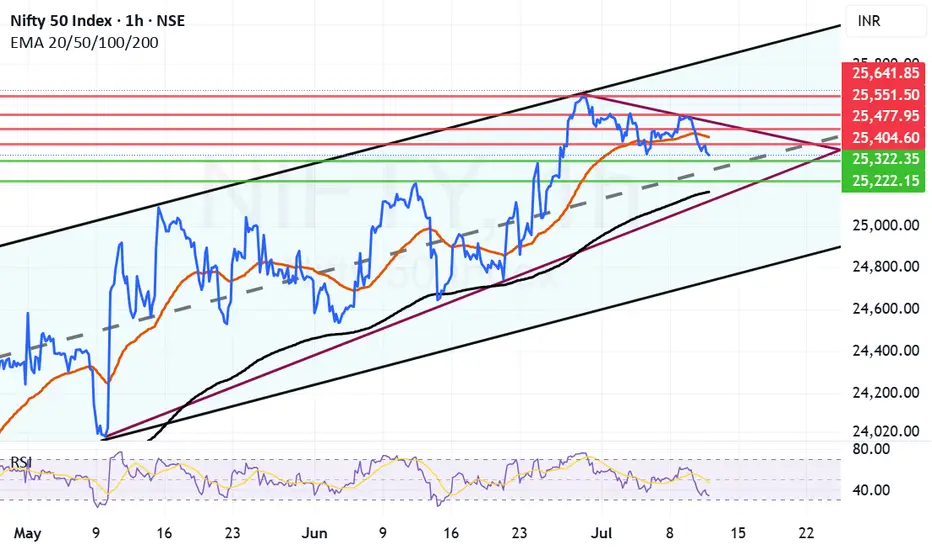
Nifty took support at the Mother line and trying to recoverNifty has taken support at the Mother line today and tried to post a recovery. Again proving our Mother, Father and small Child theory correct. To know more about the Mother father and small Child theory of stock market. Read my book THE HAPPY CANDLES WAY TO WEALTH CREATION. Nifty during the day made a low of 25378 and closed the day at 25453. It is not a strong recovery nevertheless the recover of 75 points recovery which makes shadow of the candle neutral to positive. Let us see if Nifty can recovery fully tomorrow or Friday to close the week in positive.
Nifty Supports remain at: 25396 (Mother Line Support which is also near the trend line support at 25378), there there is a support at 25245 and finally mid channel support near 25177. Closing below 25177 will make the Bears more powerful and they can drag the index further down towards Father line support near 25108.
Nifty Resistances remain at: 25470, 25528 (Trend line resistance), 25603 and finally 25679. 25759 seems to be the channel top currently in the hourly parallel channel.
Disclaimer: The above information is provided for educational purpose, analysis and paper trading only. Please don't treat this as a buy or sell recommendation for the stock or index. The Techno-Funda analysis is based on data that is more than 3 months old. Supports and Resistances are determined by historic past peaks and Valley in the chart. Many other indicators and patterns like EMA, RSI, MACD, Volumes, Fibonacci, parallel channel etc. use historic data which is 3 months or older cyclical points. There is no guarantee they will work in future as markets are highly volatile and swings in prices are also due to macro and micro factors based on actions taken by the company as well as region and global events. Equity investment is subject to risks. I or my clients or family members might have positions in the stocks that we mention in our educational posts. We will not be responsible for any Profit or loss that may occur due to any financial decision taken based on any data provided in this message. Do consult your investment advisor before taking any financial decisions. Stop losses should be an important part of any investment in equity.
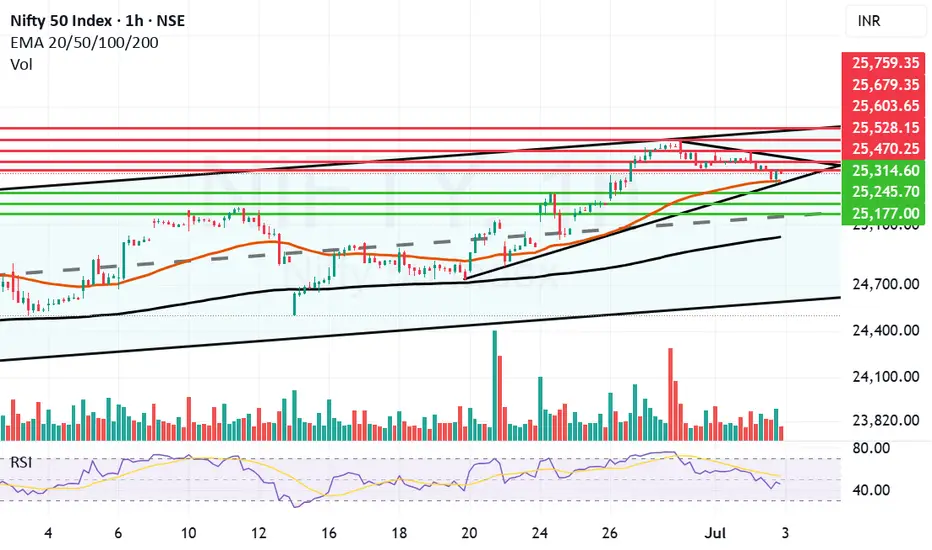
Nifty goes into consolidation mode to end the month at 25500.Today Nifty went into consolidation mode searching for the supports nearby after a massive upward run in the last week. Even though we saw Nift climbing down 120 points today the closing above 25500 is a good sign. It was a volatile day where Nifty made a high of 25669 and a low of 25473 moving 200 points down. But recovered a bit to close at 25517.
The Supports for Nifty remain at: 25450, 25321 (Mother line Support), 25133 (Mid-channel support). If that is broken the Nifty may fall further towards 24976 or 24956 (Which is the Father line support). Channel bottom seems to be at 24657. If we get a closing below this zone we will comment about further supports on the down side.
The Resistance for Nifty remain at: 24539, 24596, 25665 and finally 25712. (25712 seems to be the channel and trend top. Once Nifty closes above this zone we will be able to comment about further levels on the upside.
Disclaimer: The above information is provided for educational purpose, analysis and paper trading only. Please don't treat this as a buy or sell recommendation for the stock or index. The Techno-Funda analysis is based on data that is more than 3 months old. Supports and Resistances are determined by historic past peaks and Valley in the chart. Many other indicators and patterns like EMA, RSI, MACD, Volumes, Fibonacci, parallel channel etc. use historic data which is 3 months or older cyclical points. There is no guarantee they will work in future as markets are highly volatile and swings in prices are also due to macro and micro factors based on actions taken by the company as well as region and global events. Equity investment is subject to risks. I or my clients or family members might have positions in the stocks that we mention in our educational posts. We will not be responsible for any Profit or loss that may occur due to any financial decision taken based on any data provided in this message. Do consult your investment advisor before taking any financial decisions. Stop losses should be an important part of any investment in equity.
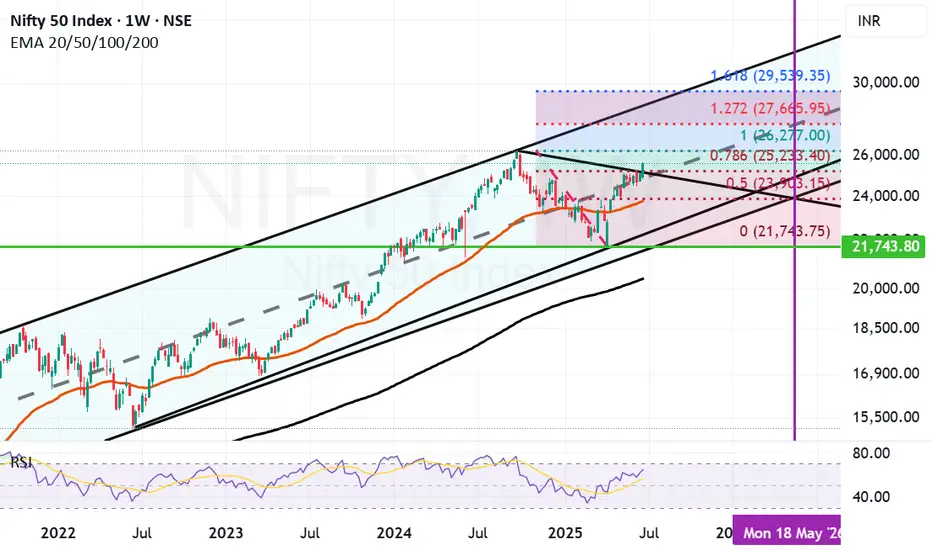
Medium to long term targets for Nifty. We have used parallel channel and Fibonacci retracement on Nifty weekly chart to gauge medium to long term targets for Nifty.
The Fibonacci retracement points out that the support for Nifty will remain at 25233(Fibonacci Support and mid channel support), 23903 (Important Fibonacci support), 23774 (Important Mother line support or 50 weeks EMA, channel bottom support). Nifty can go below these levels only in situation of another major global event or some major local event. If we get a closing below 23774 the Bear will be in commanding situation and will have the power to take Nifty further down towards 21743 which was the recent low we reached during Indo-Pak conflict.
The resistances for Nifty now are at 26277 (Major Resistance, Previous All Time high of Nifty), The next leap of faith for Nifty can be towards 27665 after we get a closing above 26277. (This will be a major hurdle and in next 1 year or so it is highly unlikely that we will cross this level unless we hit a euphoria zone.) This zone is also the current channel top zone. In very unlikely circumstance of Nifty crossing 27665 the next target for Nifty will be at 29539. (This looks possible in 18 to 24 months). We will be very lucky to reach this zone earlier. You never say never in the market.
As of now the local factors remain optimistic but there is a concern by experts related to valuation of market. As the Nifty PE currently is around 23. The results in the next couple of quarters will determine if Bull market stays active.
Disclaimer: The above information is provided for educational purpose, analysis and paper trading only. Please don't treat this as a buy or sell recommendation for the stock or index. The Techno-Funda analysis is based on data that is more than 3 months old. Supports and Resistances are determined by historic past peaks and Valley in the chart. Many other indicators and patterns like EMA, RSI, MACD, Volumes, Fibonacci, parallel channel etc. use historic data which is 3 months or older cyclical points. There is no guarantee they will work in future as markets are highly volatile and swings in prices are also due to macro and micro factors based on actions taken by the company as well as region and global events. Equity investment is subject to risks. I or my clients or family members might have positions in the stocks that we mention in our educational posts. We will not be responsible for any Profit or loss that may occur due to any financial decision taken based on any data provided in this message. Do consult your investment advisor before taking any financial decisions. Stop losses should be an important part of any investment in equity.
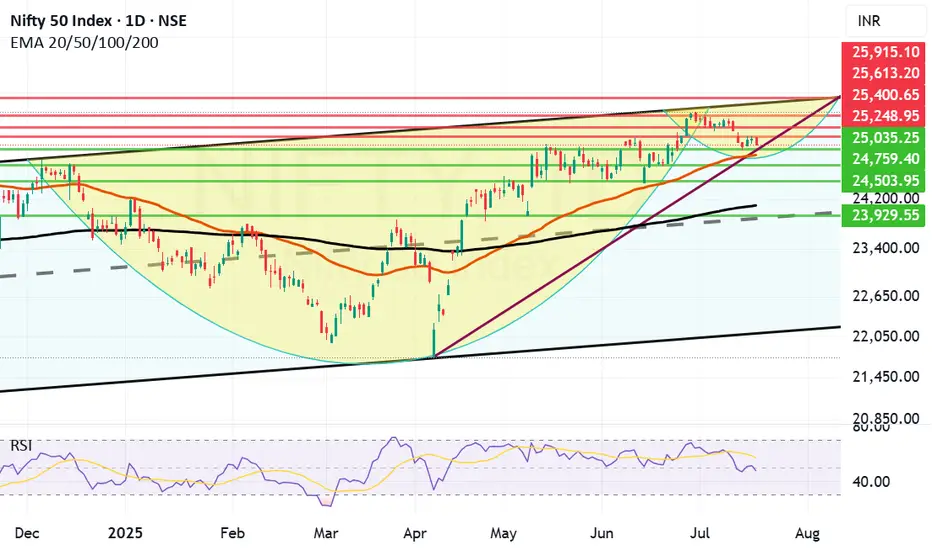
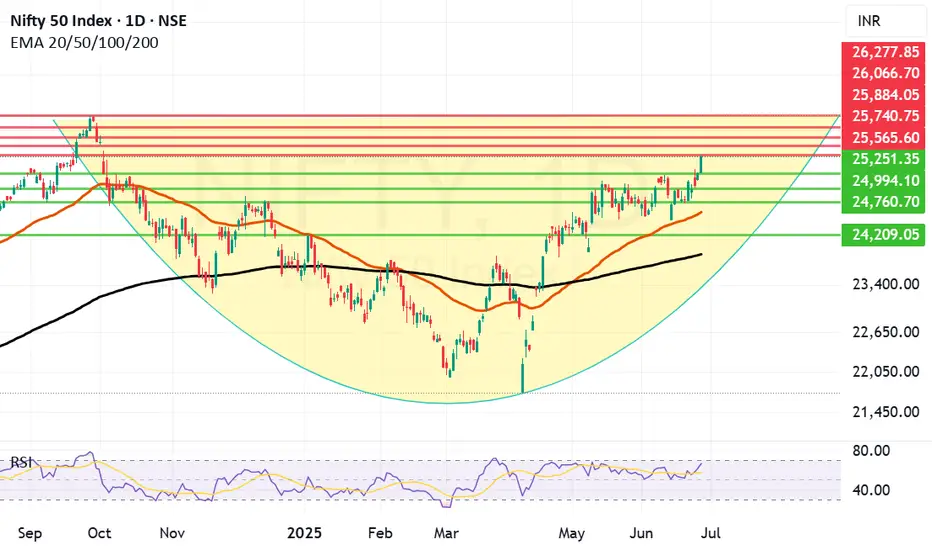
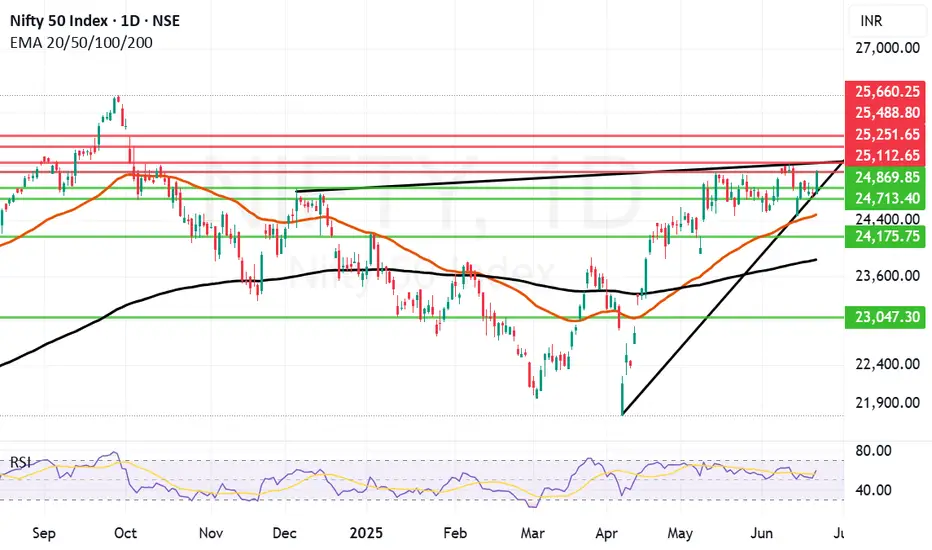
Major Breakout in Nifty now holding the levels key. We saw a major Breakout in Nifty today. Finally Nifty closed above much coveted levels of 25251. Nifty made a high of 25565 and closed at 25549 which was a remarkable comeback. What we are seeing on chart is a cup formation happening in Nifty. For flying further Nifty needs to have a strong closing tomorrow and stronger monthly closing on Monday that is 30th June. These 2 closings will be very important. We need a Nifty closing above 25884. Even if that does not happen a monthly closing above 25251 will also be considered a strong closing. Nifty is strongly on the path of recovery for sure and supports and resistances for Nifty remain as under:
Nifty Supports Remain At: 25251, 24994, 24760 and 24588 (Mother line). If by chance under unlikely circumstances Mother line is broken then Bears will become more empowered and might try to pull Nifty towards 24209 or even 23892 (Father line support).
Nifty Resistances Remain At: 25565, 25740, 25884, 26066 and finally previous All time high resistance of 26277.
Disclaimer: The above information is provided for educational purpose, analysis and paper trading only. Please don't treat this as a buy or sell recommendation for the stock or index. The Techno-Funda analysis is based on data that is more than 3 months old. Supports and Resistances are determined by historic past peaks and Valley in the chart. Many other indicators and patterns like EMA, RSI, MACD, Volumes, Fibonacci, parallel channel etc. use historic data which is 3 months or older cyclical points. There is no guarantee they will work in future as markets are highly volatile and swings in prices are also due to macro and micro factors based on actions taken by the company as well as region and global events. Equity investment is subject to risks. I or my clients or family members might have positions in the stocks that we mention in our educational posts. We will not be responsible for any Profit or loss that may occur due to any financial decision taken based on any data provided in this message. Do consult your investment advisor before taking any financial decisions. Stop losses should be an important part of any investment in equity.
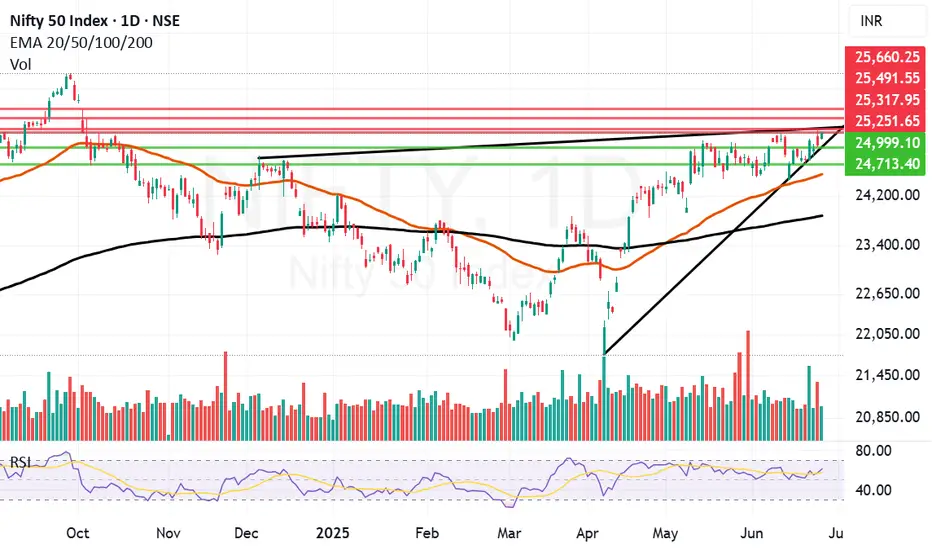
Final hurdle remains to be crossed before Nifty can fly further.One important final hurdle of 25251 remain just in front of Nifty before it can fly further. I can it a final hurdle because it is an important trendline resistance. Last 2 days Nifty has tried to climb above it but we did not get a closing above it yesterday and today as well. Today Nifty made a high of 24266 but closed at 25244. It could not hold on to the ground above 25251. The level is challenging but positive momentum built from today's display might allow it to close above the same. Only time will tell. Closing of this week will be very important.
Nifty resistances remain at: 25251, Closing above 25251 will empower Bulls to pull Nifty further upwards towards 25317, 25491 and 25660.
Nifty supports remain at: 24999, 24713, 24749 (Mother Line Support), 23875 (Father line support). (Closing below Father line support can bring Bears back into the game).
Disclaimer: The above information is provided for educational purpose, analysis and paper trading only. Please don't treat this as a buy or sell recommendation for the stock or index. The Techno-Funda analysis is based on data that is more than 3 months old. Supports and Resistances are determined by historic past peaks and Valley in the chart. Many other indicators and patterns like EMA, RSI, MACD, Volumes, Fibonacci, parallel channel etc. use historic data which is 3 months or older cyclical points. There is no guarantee they will work in future as markets are highly volatile and swings in prices are also due to macro and micro factors based on actions taken by the company as well as region and global events. Equity investment is subject to risks. I or my clients or family members might have positions in the stocks that we mention in our educational posts. We will not be responsible for any Profit or loss that may occur due to any financial decision taken based on any data provided in this message. Do consult your investment advisor before taking any financial decisions. Stop losses should be an important part of any investment in equity.
Nifty lost gains but it is a positive sign to close above 25KNifty in the Euphoria of ceasefire between Iran and Israel gained a lot of ground early in the day and made a high of 25317 but could not sustain the levels and lost massive 273 points due to profit booking to close the day at 25044. Although the loss was big but the silver lining is Nifty still ended the day 72 points in the green and closed above 25K levels. As there were news and claims related to ceasefire violations from both sides a lot of investors and participants were apprehensive of carrying long positions forward. If the things remain positive over night and if important resistance levels of 25116 and 25251 are crossed we might yet again see positive momentum building.
Nifty Resistances remain at: 25116, 25251, 25317. Closing above 25317 will lead to further upside towards the next resistance levels of 25491 and 25660.
Nifty Supports remain at: 25499 (Trend line support), 24713, 24521 (Mother Line Support) and 24463. closing below 24463 can had over the gains to the Bears who can drag index down towards Father line support of 23861.
Disclaimer: The above information is provided for educational purpose, analysis and paper trading only. Please don't treat this as a buy or sell recommendation for the stock or index. The Techno-Funda analysis is based on data that is more than 3 months old. Supports and Resistances are determined by historic past peaks and Valley in the chart. Many other indicators and patterns like EMA, RSI, MACD, Volumes, Fibonacci, parallel channel etc. use historic data which is 3 months or older cyclical points. There is no guarantee they will work in future as markets are highly volatile and swings in prices are also due to macro and micro factors based on actions taken by the company as well as region and global events. Equity investment is subject to risks. I or my clients or family members might have positions in the stocks that we mention in our educational posts. We will not be responsible for any Profit or loss that may occur due to any financial decision taken based on any data provided in this message. Do consult your investment advisor before taking any financial decisions. Stop losses should be an important part of any investment in equity.
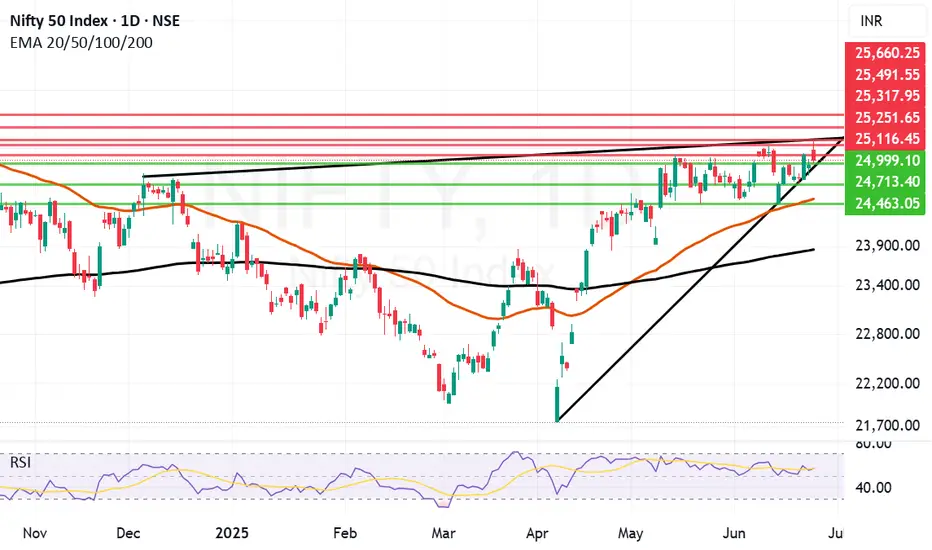
Great recovery by Nifty to end the week. Nifty has shown a great recovery to end the week at 25112 despite persisting global uncertainties. This again shows imminent strength of Indian markets and confidence on the local factors by Bulls.
Nifty however is now entering a tough resistance zone which starts exactly from 25113 and extends till 25251. Once we get a closing above 25251 the Bulls will try to control the market with more strength. Till that happens it can still go in any direction. The supports for Nifty remain at 24869, 24713, 24480 (Mother line support), 24175 and finally 23838 (Father line support).
If any major further global escalation happens during the weekend and we get a closing below 23838 then Bears can become more powerful and they might have potential to push market further down towards 23047 or below.
Things hang in balance despite a strong closing on Friday as the shadow of the candle is still neutral.
Disclaimer: The above information is provided for educational purpose, analysis and paper trading only. Please don't treat this as a buy or sell recommendation for the stock or index. The Techno-Funda analysis is based on data that is more than 3 months old. Supports and Resistances are determined by historic past peaks and Valley in the chart. Many other indicators and patterns like EMA, RSI, MACD, Volumes, Fibonacci, parallel channel etc. use historic data which is 3 months or older cyclical points. There is no guarantee they will work in future as markets are highly volatile and swings in prices are also due to macro and micro factors based on actions taken by the company as well as region and global events. Equity investment is subject to risks. I or my clients or family members might have positions in the stocks that we mention in our educational posts. We will not be responsible for any Profit or loss that may occur due to any financial decision taken based on any data provided in this message. Do consult your investment advisor before taking any financial decisions. Stop losses should be an important part of any investment in equity.
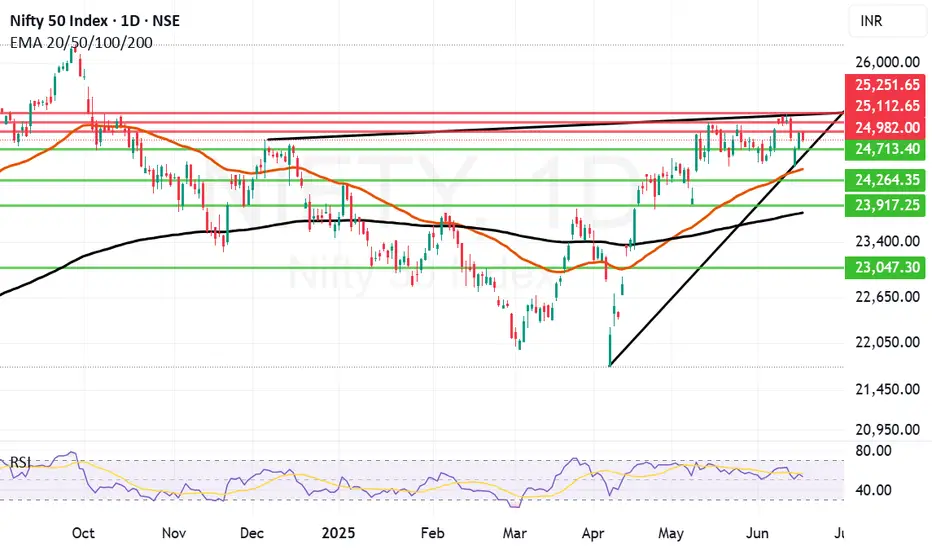
Resistance zones and Geo-political instability acting up.Geo-Political instability and resistance zone are acting up together to stop Nifty and not allowing it to close above 25K. As the world is looking at developments in Iran Vs Israel conflict with beated heart market today gave up some gains from yesterday. The only index looking strong is IT index right now. Avoid taking very long positions unless you are very sure of the company. Yesterday also Nifty failed to close above 25K opened briefly near 25K today and then moved downwards. Lot will be decided in the short term by the developments that happen tonight. Important G7 meet and US Federal reserve Rate Cut meet is also to happen later in the week. These 2 global factors will decide fate of the market in the short term. Local factors are all in line and nothing to worry for Indian markets on that front.
The supports for Nifty remain at: 24713 (Trend line support), 24425 (Mother line support of Daily chart), next support is near 23917, 23806 (Father line support of daily chart is in place). Closing below 23906 can lead to further down side and in such a scenario Nifty can fall further towards 23500 or 23047 levels. If we get a closing below that we will give updates regarding the same.
Resistances for Nifty remain at: 24982 (Today's high), 25112 and trend line resistance of 25251. When we get a closing above 25251 we will update you regarding the further upward resistnace levels.
Disclaimer: The above information is provided for educational purpose, analysis and paper trading only. Please don't treat this as a buy or sell recommendation for the stock or index. The Techno-Funda analysis is based on data that is more than 3 months old. Supports and Resistances are determined by historic past peaks and Valley in the chart. Many other indicators and patterns like EMA, RSI, MACD, Volumes, Fibonacci, parallel channel etc. use historic data which is 3 months or older cyclical points. There is no guarantee they will work in future as markets are highly volatile and swings in prices are also due to macro and micro factors based on actions taken by the company as well as region and global events. Equity investment is subject to risks. I or my clients or family members might have positions in the stocks that we mention in our educational posts. We will not be responsible for any Profit or loss that may occur due to any financial decision taken based on any data provided in this message. Do consult your investment advisor before taking any financial decisions. Stop losses should be an important part of any investment in equity.