23 May Nifty50 trading zone #Nifty50 #option trading
99% working trading plan
👉Gap up open 24683 above & 15m hold after positive trade target 24860, 24980
👉Gap up open 24683 below 15 m not break upside after nigetive trade target 24480, 24330
👉Gap down open 24480 above 15m hold after positive trade target 24683, 24860
👉Gap down open 24480 below 15 m not break upside after nigetive trade target 24330, 24170
Trade plan for education purpose I'm not responsible your trade
More education follow & support me
Niftytomorrow

Nifty levels - May 23, 2025Nifty support and resistance levels are valuable tools for making informed trading decisions, specifically when combined with the analysis of 5-minute timeframe candlesticks and VWAP. By closely monitoring these levels and observing the price movements within this timeframe, traders can enhance the accuracy of their entry and exit points. It is important to bear in mind that support and resistance levels are not fixed, and they can change over time as market conditions evolve.
The dashed lines on the chart indicate the reaction levels, serving as additional points of significance to consider. Furthermore, take note of the response at the levels of the High, Low, and Close values from the day prior.
We hope you find this information beneficial in your trading endeavors.
* If you found the idea appealing, kindly tap the Boost icon located below the chart. We encourage you to share your thoughts and comments regarding it.
Wishing you success in your trading activities!

Nifty Analysis EOD – May 21, 2025 – Wednesday 🟢 Nifty Analysis EOD – May 21, 2025 – Wednesday 🔴
🌀 The Dead Cat Bounces Effect After Yesterday's Quick Fall 🌀
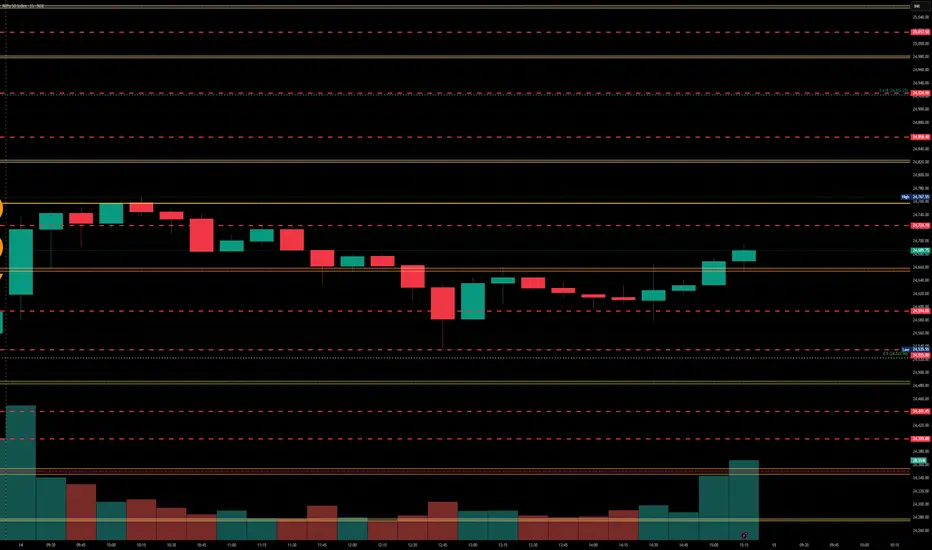
Nifty opened with a 45-point gap-up and, within the first 10 minutes, that gap was filled—marking a low of 24692.65. From there, a sudden burst of buying pressure launched the index above the 24768–24800 resistance zone in just 25 minutes. This sharp move triggered a round of short covering, propelling Nifty to the day’s high of 24946.20.
As shared live on TradingView, the Fib resistance zone of 24930–24940 (0.764–0.786 levels) was a key level to watch. True to expectation, Nifty faced strong rejection from this zone, leading to a V-shaped reversal—wiping out all gains in the next hour and marking a new low of 24685.35.
🌀 Screenshot from Tradingview - 1
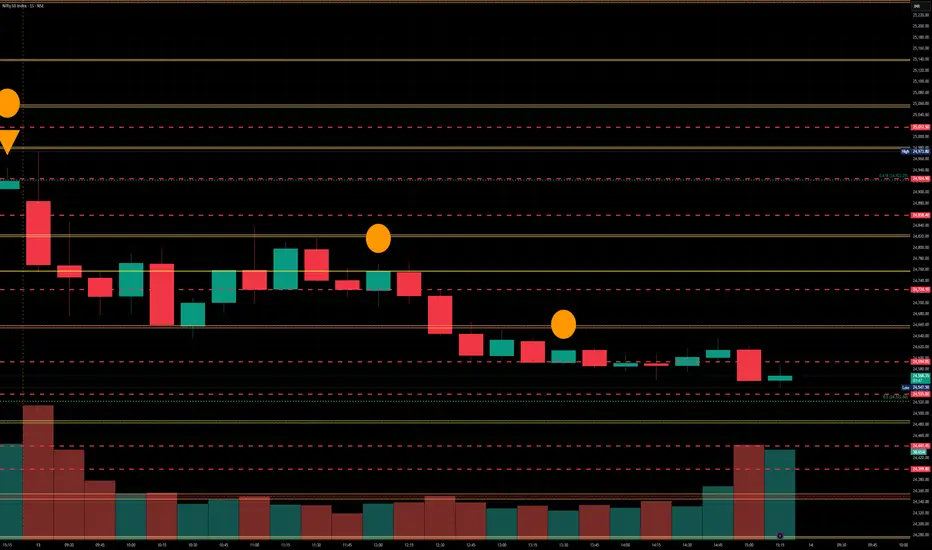
🌀 Screenshot from Tradingview - 2
It was a rollercoaster ride in the first half. Post this, Nifty traded mostly within the CPR’s Top Central (TC) and Bottom Central (BC) range—though this range itself was 104 points, keeping the session active and far from boring.
Nifty’s close at 24813, around the VWAP and Central CPR, suggests a temporary equilibrium between buyers and sellers. The good part? We closed above the critical 24768–24800 support-turned-resistance. But there's a catch—the close is below yesterday’s Fib 0.5 retracement, signaling potential caution.
⚠️ Cautionary Note:In the short-term, today’s session fits the textbook example of a Dead Cat Bounce. With weekly expiry tomorrow, it's wise to stay alert and not get trapped in noise. Discipline and patience will be key.
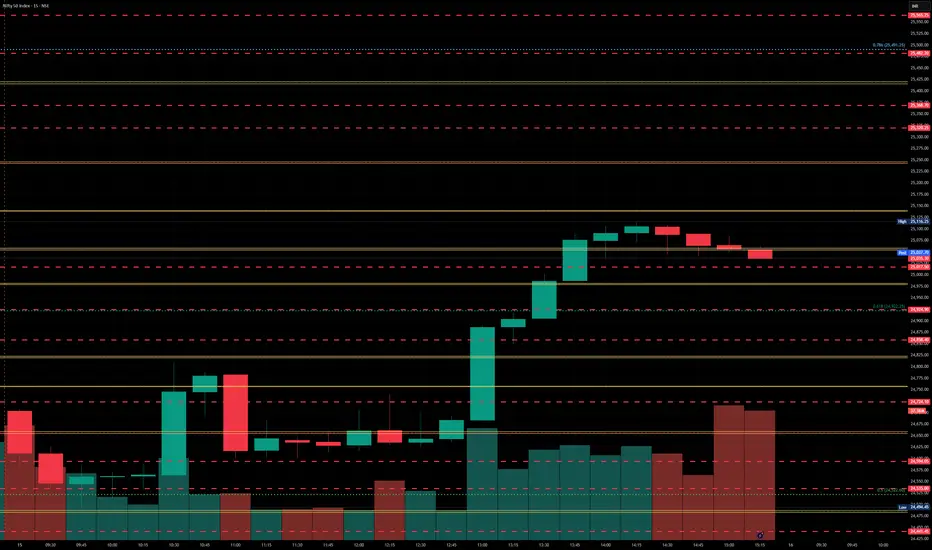
🛡 25 Min Time Frame Chart
🔄 What’s Next? / Bias Direction
Wide trading range remains intact. But here’s the game plan:
📈 Long Setup:Above 24850, watch for strength with targets:→ 24920→ 24980→ 25075
📌 Above 25075, sharp short covering can drive price towards 25222 (Yes, it’s far—but good traders plan ahead, always).
📉 Short Setup:Below 24640–24625, weakness may extend down towards:→ 24500→ 24460
Let price action confirm.
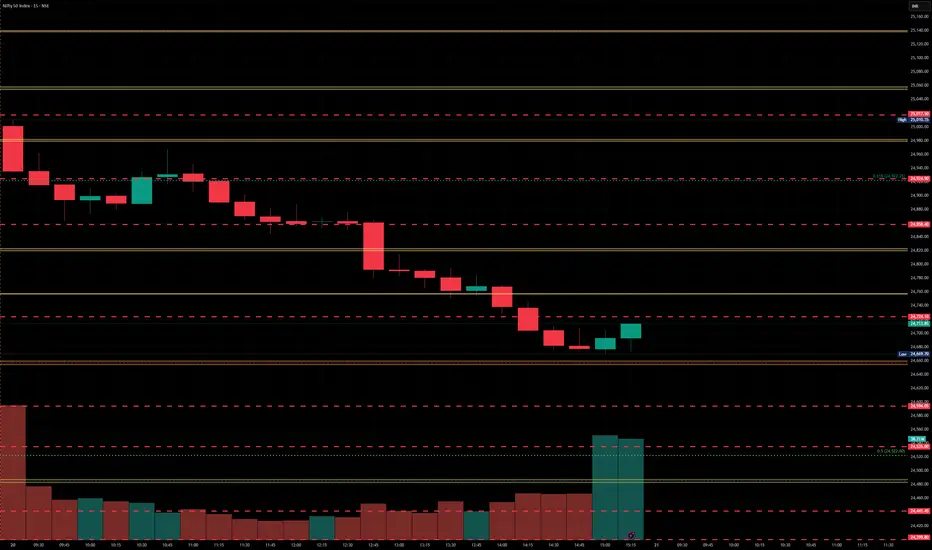
🛡 5 Min Intraday Chart
🥷 Gladiator Strategy Update
Strategy Parameters
ATR: 324.57
IB Range: 151.65 → Medium IB
Market Structure: Balanced
Trade Highlights
✅ 1st Long Trigger: 10:05 AM – Target Achieved (R:R = 1:1.5)
💼 Total Trades: 1
🕯 Daily Time Frame Chart
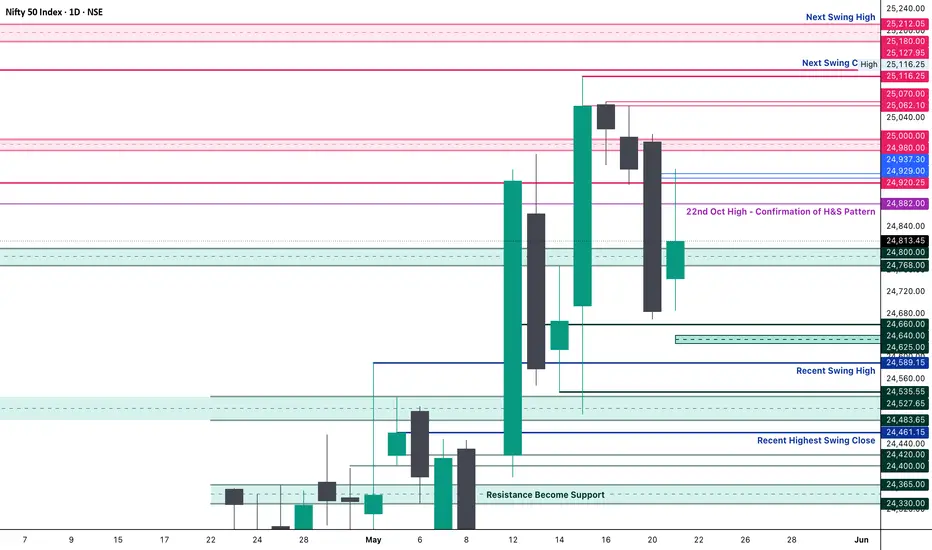
🔍 Support & Resistance Levels
🔺 Resistance Zones:
24,882
24,920
24,980 ~ 25,000
25,062 ~ 25,070
🔻 Support Zones:
24,768 ~ 24,800
24,660
24,640 ~ 24,625
24,590
24,530 ~ 24,480
24,460
✍️ Final Thoughts
"Volatility doesn’t trap the prepared, it challenges them."
Tomorrow being expiry, let the levels speak. Stay objective, stay adaptive.
✏️ Disclaimer
This is just my personal viewpoint. Always consult your financial advisor before taking any action.
Nifty levels - May 22, 2025Nifty support and resistance levels are valuable tools for making informed trading decisions, specifically when combined with the analysis of 5-minute timeframe candlesticks and VWAP. By closely monitoring these levels and observing the price movements within this timeframe, traders can enhance the accuracy of their entry and exit points. It is important to bear in mind that support and resistance levels are not fixed, and they can change over time as market conditions evolve.
The dashed lines on the chart indicate the reaction levels, serving as additional points of significance to consider. Furthermore, take note of the response at the levels of the High, Low, and Close values from the day prior.
We hope you find this information beneficial in your trading endeavors.
* If you found the idea appealing, kindly tap the Boost icon located below the chart. We encourage you to share your thoughts and comments regarding it.
Wishing you success in your trading activities!

Nifty levels - May 21, 2025Nifty support and resistance levels are valuable tools for making informed trading decisions, specifically when combined with the analysis of 5-minute timeframe candlesticks and VWAP. By closely monitoring these levels and observing the price movements within this timeframe, traders can enhance the accuracy of their entry and exit points. It is important to bear in mind that support and resistance levels are not fixed, and they can change over time as market conditions evolve.
The dashed lines on the chart indicate the reaction levels, serving as additional points of significance to consider. Furthermore, take note of the response at the levels of the High, Low, and Close values from the day prior.
We hope you find this information beneficial in your trading endeavors.
* If you found the idea appealing, kindly tap the Boost icon located below the chart. We encourage you to share your thoughts and comments regarding it.
Wishing you success in your trading activities!
Nfty levels - May 20, 2025Nifty support and resistance levels are valuable tools for making informed trading decisions, specifically when combined with the analysis of 5-minute timeframe candlesticks and VWAP. By closely monitoring these levels and observing the price movements within this timeframe, traders can enhance the accuracy of their entry and exit points. It is important to bear in mind that support and resistance levels are not fixed, and they can change over time as market conditions evolve.
The dashed lines on the chart indicate the reaction levels, serving as additional points of significance to consider. Furthermore, take note of the response at the levels of the High, Low, and Close values from the day prior.
We hope you find this information beneficial in your trading endeavors.
* If you found the idea appealing, kindly tap the Boost icon located below the chart. We encourage you to share your thoughts and comments regarding it.
Wishing you success in your trading activities!

Nifty levels - May 16, 2025Nifty support and resistance levels are valuable tools for making informed trading decisions, specifically when combined with the analysis of 5-minute timeframe candlesticks and VWAP. By closely monitoring these levels and observing the price movements within this timeframe, traders can enhance the accuracy of their entry and exit points. It is important to bear in mind that support and resistance levels are not fixed, and they can change over time as market conditions evolve.
The dashed lines on the chart indicate the reaction levels, serving as additional points of significance to consider. Furthermore, take note of the response at the levels of the High, Low, and Close values from the day prior.
We hope you find this information beneficial in your trading endeavors.
* If you found the idea appealing, kindly tap the Boost icon located below the chart. We encourage you to share your thoughts and comments regarding it.
Wishing you success in your trading activities!
Nifty Analysis EOD - May 14, 2025 - Wednesday🟢 Nifty Analysis EOD - May 14, 2025 - Wednesday 🔴
Day Ends with Directional Uncertainty from Nifty
🔍 Nifty Summary
Nifty opened with a 35-point gap-up, displaying early strength by slowly climbing toward 24,747, which aligned with the critical resistance zone of 24,768–24,800 and the CPR top. But that’s where the rally halted.
From the day’s high, it reversed lower, testing both the Previous Day Low (PDL) and Previous Week High (PWH). Interestingly, the index took support there and managed to close right at the CPR, underlining indecision.
The day was marked by broad consolidation within a 232-point range, with no strong directional follow-through. Price stayed majorly around the CPR zone, signaling a range-bound session with underlying uncertainty.
🕵️ Intraday Walk
☀️ Opened with 35-point gap-up; gradually climbed to 24,747.
🚫 Hit resistance at 24,768–24,800 and reversed.
🔽 Fell to test PDL and PWH zone (24535 area).
🛑 Found support and bounced back to close at CPR.
🔄 A day filled with range-bound movement and no clear trend.
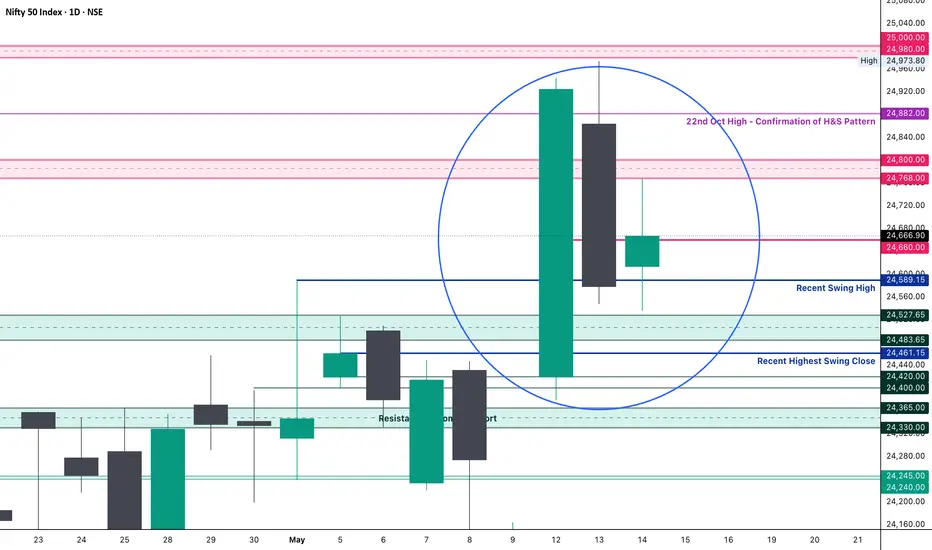
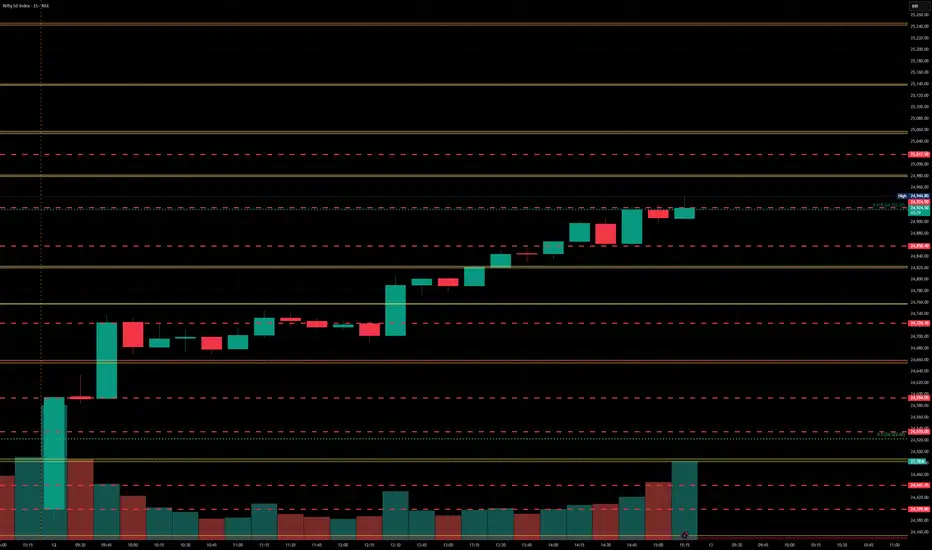
📏 Inside Bar Pattern Watch (Daily Chart)
A 3-day Inside Bar Structure is forming:
📅 May 12: Mother Candle
📅 May 13: Baby candle (ignore 29-point upper wick)
📅 May 14 (Today): Another baby candle within May 13 (ignore 12-point lower wick)
This nested inside bar scenario could trigger a directional breakout soon.
🔼 Upside Levels:
If today’s high (24,767) breaks:Target Zones: 24,800 → 24,882 → 24,940
🔽 Downside Levels:
If today’s low (24,535) breaks:Target Zones: 24,480 → 24,400 → 24,365 → 24,330
🔎 Key Fib Observations
📏 Today’s high (24,747) = ~50% retracement of May 13’s candle → signals rise-on-sell tone
📉 Today’s close (24,640) = ~50% retracement of today’s candle → neutral-to-positive bias
These confluences reflect a tug-of-war between bulls and bears, waiting for a breakout.
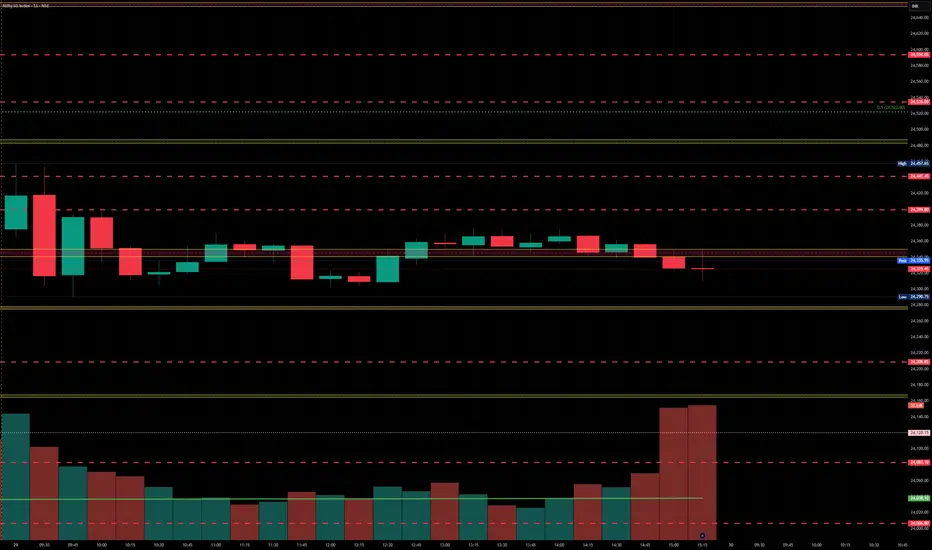
🕯 Daily Candle Breakdown
Candle Type: Small-bodied candle inside previous day’s range
Today’s OHLC:▫️ Open: 24,613.80▫️ High: 24,767.55▫️ Low: 24,535.55▫️ Close: 24,666.90 (▲+88.55 / +0.36%)
🔍 Key Observations:
⚠️ No directional expansion, despite higher high & low
✅ Inside bar formation continues
✅ Close at candle midpoint → Neutral, with slight positive bias
📊 Sign of energy build-up for a potential breakout
🛡 Gladiator Strategy Update
Strategy Parameters
ATR: 349.73
IB Range: 169.70 → 📏 Medium IB
Market Structure: ⚖️ Balanced
Trade Highlights
⚠️ No trade triggered
💼 Total Trades: 0
🔢 Support & Resistance Levels
🟩 Resistance Zones:
24,730
24,768 ~ 24,800
24,882
24,980 ~ 25,000
25,100 ~ 25,128
25,180 ~ 25,212
🟥 Support Zones:
24,882
24,800 ~ 24,768
24,730
24,660
24,590
24,530 ~ 24,480
24,461
24,420 ~ 24,400
24,365 ~ 24,330
24,245 ~ 24,240
🔮 What’s Next?
A 3-day Inside Bar Formation generally signals a volatility contraction phase. The tighter the coil, the stronger the potential breakout.
If 24,767 breaks, bulls might regain momentum.If 24,535 fails, we may retest deeper supports from 24,480 downward.
📌 Patience over prediction — let the range resolve.
💬 Final Thoughts
“Inside bars are calm before the storm. Stay alert — breakout decides the next play.”
✏️ DisclaimerThis is just my personal viewpoint. Always consult your financial advisor before taking any action.
Nifty levels - May 15, 2025Nifty support and resistance levels are valuable tools for making informed trading decisions, specifically when combined with the analysis of 5-minute timeframe candlesticks and VWAP. By closely monitoring these levels and observing the price movements within this timeframe, traders can enhance the accuracy of their entry and exit points. It is important to bear in mind that support and resistance levels are not fixed, and they can change over time as market conditions evolve.
The dashed lines on the chart indicate the reaction levels, serving as additional points of significance to consider. Furthermore, take note of the response at the levels of the High, Low, and Close values from the day prior.
We hope you find this information beneficial in your trading endeavors.
* If you found the idea appealing, kindly tap the Boost icon located below the chart. We encourage you to share your thoughts and comments regarding it.
Wishing you success in your trading activities!
Nifty levels - May 14, 2025Nifty support and resistance levels are valuable tools for making informed trading decisions, specifically when combined with the analysis of 5-minute timeframe candlesticks and VWAP. By closely monitoring these levels and observing the price movements within this timeframe, traders can enhance the accuracy of their entry and exit points. It is important to bear in mind that support and resistance levels are not fixed, and they can change over time as market conditions evolve.
The dashed lines on the chart indicate the reaction levels, serving as additional points of significance to consider. Furthermore, take note of the response at the levels of the High, Low, and Close values from the day prior.
We hope you find this information beneficial in your trading endeavors.
* If you found the idea appealing, kindly tap the Boost icon located below the chart. We encourage you to share your thoughts and comments regarding it.
Wishing you success in your trading activities!
Nifty levels - May 13, 2025Nifty support and resistance levels are valuable tools for making informed trading decisions, specifically when combined with the analysis of 5-minute timeframe candlesticks and VWAP. By closely monitoring these levels and observing the price movements within this timeframe, traders can enhance the accuracy of their entry and exit points. It is important to bear in mind that support and resistance levels are not fixed, and they can change over time as market conditions evolve.
The dashed lines on the chart indicate the reaction levels, serving as additional points of significance to consider. Furthermore, take note of the response at the levels of the High, Low, and Close values from the day prior.
We hope you find this information beneficial in your trading endeavors.
* If you found the idea appealing, kindly tap the Boost icon located below the chart. We encourage you to share your thoughts and comments regarding it.
Wishing you success in your trading activities!
Nifty levels - May 09, 2025Nifty support and resistance levels are valuable tools for making informed trading decisions, specifically when combined with the analysis of 5-minute timeframe candlesticks and VWAP. By closely monitoring these levels and observing the price movements within this timeframe, traders can enhance the accuracy of their entry and exit points. It is important to bear in mind that support and resistance levels are not fixed, and they can change over time as market conditions evolve.
The dashed lines on the chart indicate the reaction levels, serving as additional points of significance to consider. Furthermore, take note of the response at the levels of the High, Low, and Close values from the day prior.
We hope you find this information beneficial in your trading endeavors.
* If you found the idea appealing, kindly tap the Boost icon located below the chart. We encourage you to share your thoughts and comments regarding it.
Wishing you success in your trading activities!

Nifty Futures Intraday Trend Analysis for May 08, 2025Based on my analysis, Nifty Futures is likely to exhibit a bearish intraday trend tomorrow, with resistance around 24,500 and strong support near 24,260. This outlook does not factor in potential price gaps in either direction.
Traders are advised to conduct their own technical analysis before initiating any positions. Always trade with a well-defined stop-loss. This information is intended strictly for educational purposes.

Nifty levels - May 08, 2025Nifty support and resistance levels are valuable tools for making informed trading decisions, specifically when combined with the analysis of 5-minute timeframe candlesticks and VWAP. By closely monitoring these levels and observing the price movements within this timeframe, traders can enhance the accuracy of their entry and exit points. It is important to bear in mind that support and resistance levels are not fixed, and they can change over time as market conditions evolve.
The dashed lines on the chart indicate the reaction levels, serving as additional points of significance to consider. Furthermore, take note of the response at the levels of the High, Low, and Close values from the day prior.
We hope you find this information beneficial in your trading endeavors.
* If you found the idea appealing, kindly tap the Boost icon located below the chart. We encourage you to share your thoughts and comments regarding it.
Wishing you success in your trading activities!

NIFTY Wait for a breakout: When the price crosses above the trendline, it could be a bullish signal.
Monitor for a breakdown: If the price breaks below the trendline, it could be a bearish signal.
If you find this helpful and want more FREE forecasts in TradingView, Hit the 'BOOST' button
Drop some feedback in the comments below! (e.g., What did you find most useful?
How can we improve?)
Your support is appreciated!
Now, it's your turn!
Be sure to leave a comment; let us know how you see this opportunity and forecast.
Have a successful week
DISCLAIMER: I am NOT a SEBI registered advisor or a financial adviser. All the views are for educational purpose only

Nifty levels - May 07, 2025Nifty support and resistance levels are valuable tools for making informed trading decisions, specifically when combined with the analysis of 5-minute timeframe candlesticks and VWAP. By closely monitoring these levels and observing the price movements within this timeframe, traders can enhance the accuracy of their entry and exit points. It is important to bear in mind that support and resistance levels are not fixed, and they can change over time as market conditions evolve.
The dashed lines on the chart indicate the reaction levels, serving as additional points of significance to consider. Furthermore, take note of the response at the levels of the High, Low, and Close values from the day prior.
We hope you find this information beneficial in your trading endeavors.
* If you found the idea appealing, kindly tap the Boost icon located below the chart. We encourage you to share your thoughts and comments regarding it.
Wishing you success in your trading activities!

"Nifty 50 at a Crossroads: Rising Wedge Signals Breakout or Brea* A **rising wedge** pattern is clearly forming, marked by two upward sloping blue trendlines.
* Inside this wedge:
* Multiple **price swings** (higher highs and higher lows) are visible.
* Recent breakout attempts are marked with zig-zag arrows showing potential breakout direction
📈 **Bullish Signals:**
1. **Strong Uptrend:**
* A sustained rally from \~23,000 up to the current levels (\~24,500) indicates strong bullish momentum.
2. **Breakout Potential:**
* Price is attempting to break out above the rising wedge pattern.
* Immediate **bullish target zone** is around **24,596 to 24,754**, marked with a green "Target" label.
3. **Volume Surge:**
* Recent bullish candles are supported by increased volume, suggesting real interest in the breakout.
📉 **Bearish Risks:**
1. **Rising Wedge Risk:**
* Rising wedge patterns often lead to **bearish breakdowns**.
* If the support of the wedge is broken, the **first downside target** is marked at **24,369**, and **next support** at **24,291**.
2. **Volume Divergence:**
* Although there's some volume on bullish moves, the consistency is lacking compared to the strong rally before April 23.
**Key Price Levels:**
| 24,754.90 | Resistance | Upper range of rising wedge (target) |
| 24,596.40 | Resistance | First bullish target zone |
| 24,520.00 | Minor Resistance | Recent swing high |
| 24,369.45 | Support | First bearish target if wedge breaks |
| 24,291.25 | Key Support | Critical support, below wedge trendline |
| 23,786.80 | Strong Support | Previous consolidation breakout zone |
**Conclusion:**
* The Nifty is in a **tight rising wedge**, typically a **bearish** reversal pattern. However, if bulls can push past **24,520–24,596**, it may invalidate the pattern and open further upside.
* Until a confirmed breakout or breakdown occurs, traders should remain cautious and wait for **volume-backed confirmation**.

Nifty levels - May 06, 2025Nifty support and resistance levels are valuable tools for making informed trading decisions, specifically when combined with the analysis of 5-minute timeframe candlesticks and VWAP. By closely monitoring these levels and observing the price movements within this timeframe, traders can enhance the accuracy of their entry and exit points. It is important to bear in mind that support and resistance levels are not fixed, and they can change over time as market conditions evolve.
The dashed lines on the chart indicate the reaction levels, serving as additional points of significance to consider. Furthermore, take note of the response at the levels of the High, Low, and Close values from the day prior.
We hope you find this information beneficial in your trading endeavors.
* If you found the idea appealing, kindly tap the Boost icon located below the chart. We encourage you to share your thoughts and comments regarding it.
Wishing you success in your trading activities!


Nifty levels - Apr 30, 2025Nifty support and resistance levels are valuable tools for making informed trading decisions, specifically when combined with the analysis of 5-minute timeframe candlesticks and VWAP. By closely monitoring these levels and observing the price movements within this timeframe, traders can enhance the accuracy of their entry and exit points. It is important to bear in mind that support and resistance levels are not fixed, and they can change over time as market conditions evolve.
The dashed lines on the chart indicate the reaction levels, serving as additional points of significance to consider. Furthermore, take note of the response at the levels of the High, Low, and Close values from the day prior.
We hope you find this information beneficial in your trading endeavors.
* If you found the idea appealing, kindly tap the Boost icon located below the chart. We encourage you to share your thoughts and comments regarding it.
Wishing you success in your trading activities!
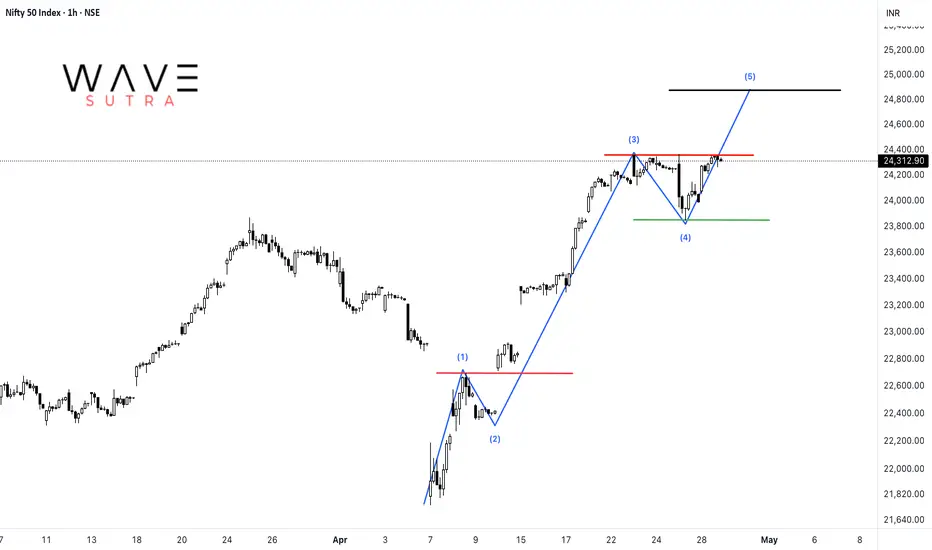
NIFTY: Impulse formationNifty is rising in an impulsive manner of which 4th wave is already concluded at 23847 zone and currently trading under wave-5. This shall take the index towards 24875 zone where wave-5 becomes equal to wave-1.
Nifty Elliott wave update for 29april Tuesday onwardsIn this Video I have explained Elliott wave analysis of Nifty on 3hour, 15 min chart and 5min chart in detail to conclude what are the possible scenarios possible in Nifty index from 29april Tuesday onwards.... Kindly watch full video for detail understanding. It will help you to understand how to use Elliott wave theory practically on charts.
Thank you for watching....

Nifty levels - Apr 29, 2025Nifty support and resistance levels are valuable tools for making informed trading decisions, specifically when combined with the analysis of 5-minute timeframe candlesticks and VWAP. By closely monitoring these levels and observing the price movements within this timeframe, traders can enhance the accuracy of their entry and exit points. It is important to bear in mind that support and resistance levels are not fixed, and they can change over time as market conditions evolve.
The dashed lines on the chart indicate the reaction levels, serving as additional points of significance to consider. Furthermore, take note of the response at the levels of the High, Low, and Close values from the day prior.
We hope you find this information beneficial in your trading endeavors.
* If you found the idea appealing, kindly tap the Boost icon located below the chart. We encourage you to share your thoughts and comments regarding it.
Wishing you success in your trading activities!
