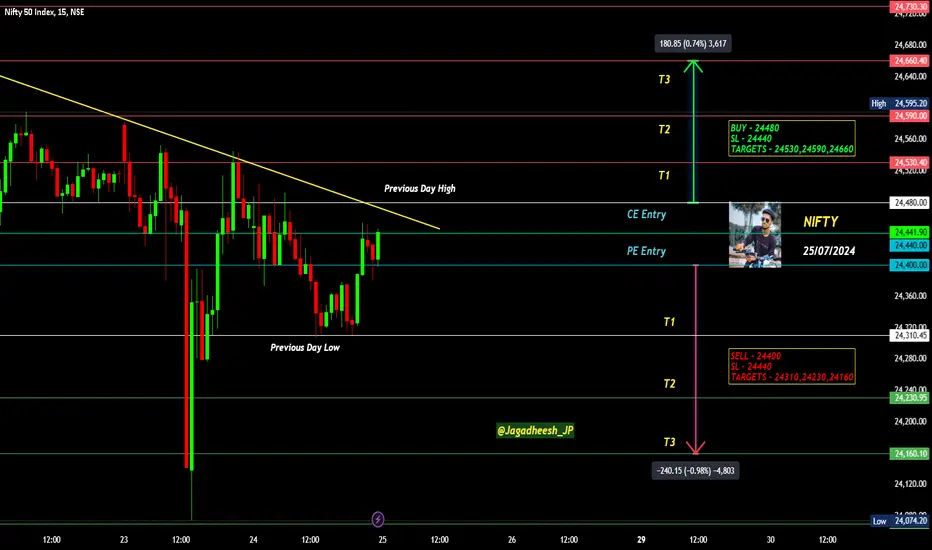
NIFTY INTRADAY LEVELS FOR 25 JULY 2024BUY ABOVE - 24480
SL - 24440
TARGETS - 24530,24590,24660
SELL BELOW - 24400
SL - 24440
TARGETS - 24310,24230,24160
NO TRADE ZONE - 24400 to 24480
Previous Day High - 24480
Previous Day Low - 24310
Based on price action major support & resistance's are here, the red lines acts as resistances, the green lines acts as supports. If the price breaks the support/resistance, it will move to the next support/resistance line. White lines indicates previous day high & low, high acts as a resistance & low acts as a support for next day.
Trendlines are also significant to price action. If the price is above/below the trendlines, can expect an UP/DOWN with aggressive move.
Please NOTE: this levels are for intraday trading only.
Disclaimer - All information on this page is for educational purposes only,
we are not SEBI Registered, Please consult a SEBI registered financial advisor for your financial matters before investing And taking any decision. We are not responsible for any profit/loss you made.
Request your support and engagement by liking and commenting & follow to provide encouragement
HAPPY TRADING 👍
Niftytradesetup
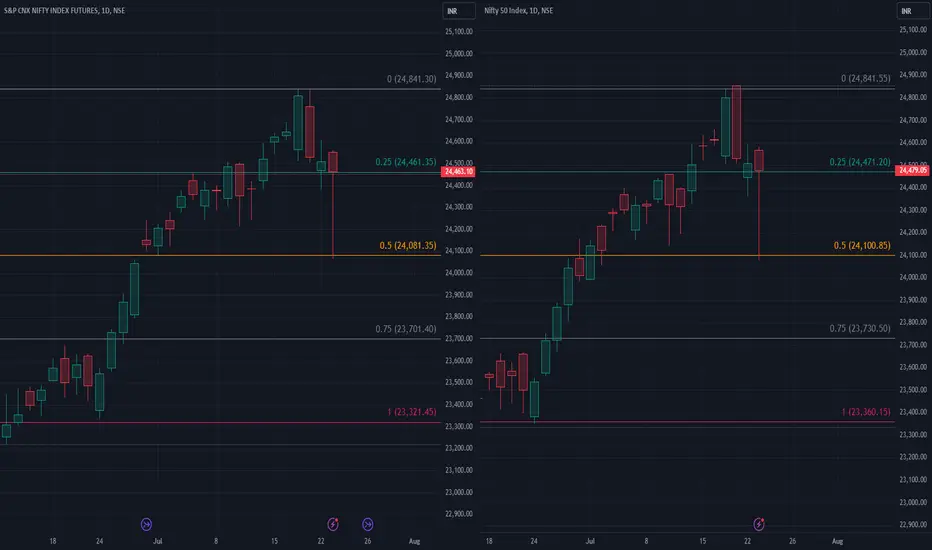
Tale of 2 cities. Unseeing this would be difficult once you see this. The rage that I have drawn here is an exact 3000 point expansion in Nifty spot and Nifty Fut. Both are trading in the top quadrant. 100% and 50 % and both curiously the same: 24841 and 24100.
I am not taking sides. If it breaks lower, it could test 24100 again.
If not, it could either consolidate in the upper quadrant OR break higher.
The run up to the budget had huge expectation of Capex in infra, railways, shipbuilding and fertilizer stocks. We need to see how they fare tomorrow. I am not sure what the industry expectations were.
I will watch out for these levels to take trades.
One Key parameter I follow is advance decline ration. That has improved to 962:1374 today.
Should I look UP? I don't know
Should I look down? I really don't know.
The 2 cities to watch out for are 24841 and 24100.
NIFTY INTRADAY LEVELS FOR 24/07/2024BUY ABOVE - 24530
SL - 24480
TARGETS - 24590,24660,24730
SELL BELOW - 24440
SL - 24480
TARGETS - 24400,24350,24230
NO TRADE ZONE - 24440 to 24530
Previous Day High - 24590
Previous Day Low - 24070
Based on price action major support & resistance's are here, the red lines acts as resistances, the green lines acts as supports. If the price breaks the support/resistance, it will move to the next support/resistance line. White lines indicates previous day high & low, high acts as a resistance & low acts as a support for next day.
Trendlines are also significant to price action. If the price is above/below the trendlines, can expect an UP/DOWN with aggressive move.
Please NOTE: this levels are for intraday trading only.
Disclaimer - All information on this page is for educational purposes only,
we are not SEBI Registered, Please consult a SEBI registered financial advisor for your financial matters before investing And taking any decision. We are not responsible for any profit/loss you made.
Request your support and engagement by liking and commenting & follow to provide encouragement
HAPPY TRADING 👍

NIFTY BUDGET DAY ANALYSIS 23/07/2024BUY ABOVE - 24530
SL - 24480
TARGETS - 24590,24660,24730
SELL BELOW - 24480
SL - 24530
TARGETS - 24440,24400,24350
NO TRADE ZONE - 24480 to 24530
Previous Day High - 24590
Previous Day Low - 24350
Based on price action major support & resistance's are here, the red lines acts as resistances, the green lines acts as supports. If the price breaks the support/resistance, it will move to the next support/resistance line. White lines indicates previous day high & low, high acts as a resistance & low acts as a support for next day.
Trendlines are also significant to price action. If the price is above/below the trendlines, can expect an UP/DOWN with aggressive move.
Please NOTE: this levels are for intraday trading only.
Disclaimer - All information on this page is for educational purposes only,
we are not SEBI Registered, Please consult a SEBI registered financial advisor for your financial matters before investing And taking any decision. We are not responsible for any profit/loss you made.
Request your support and engagement by liking and commenting & follow to provide encouragement
HAPPY TRADING 👍

NIFTY INTRADAY LEVELS FOR 19 JULY 2024BUY ABOVE - 24830
SL - 24780
TARGETS - 24900,24960,25030
SELL BELOW - 24730
SL - 24780
TARGETS - 24660,24580,24530
NO TRADE ZONE - 24730 to 24830
Previous Day High - 24830
Previous Day Low - 24530
Based on price action major support & resistance's are here, the red lines acts as resistances, the green lines acts as supports. If the price breaks the support/resistance, it will move to the next support/resistance line. White lines indicates previous day high & low, high acts as a resistance & low acts as a support for next day.
Trendlines are also significant to price action. If the price is above/below the trendlines, can expect an UP/DOWN with aggressive move.
Please NOTE: this levels are for intraday trading only.
Disclaimer - All information on this page is for educational purposes only,
we are not SEBI Registered, Please consult a SEBI registered financial advisor for your financial matters before investing And taking any decision. We are not responsible for any profit/loss you made.
Request your support and engagement by liking and commenting & follow to provide encouragement
HAPPY TRADING 👍

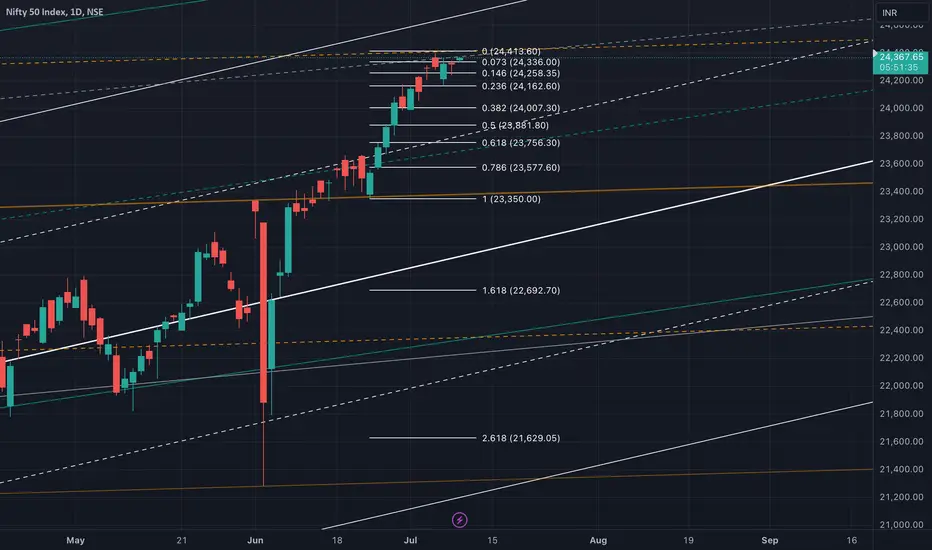
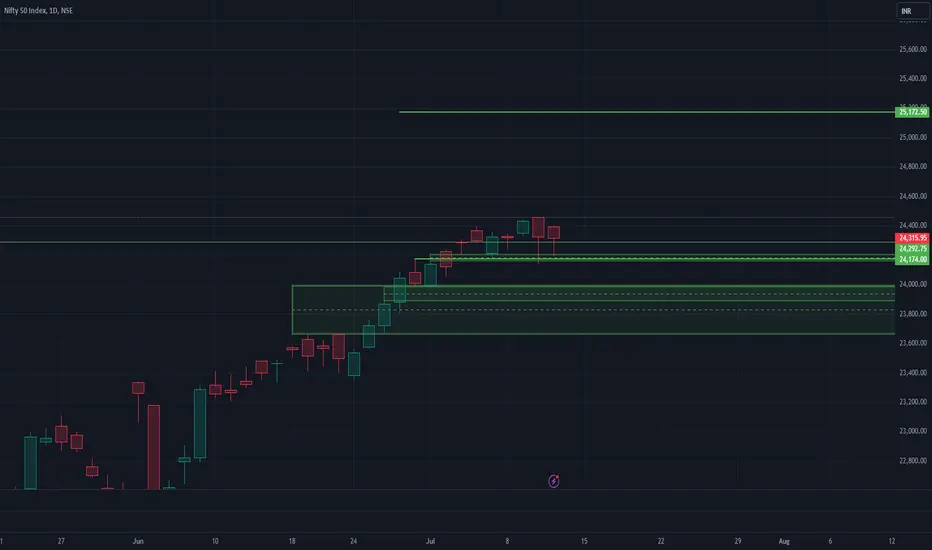
NIFTY - Correction ahead of BudgetAt this juncture, nifty is expected to correct to the mentioned levels & to continue its rally towards 25,000 ~ 25,400 levels before any monthly correction can happen. The correction will be progressing through various barriers of supports(FIBONACCI & T.lines).
SI - 24,162
SII - 24,010
SIII - 23,881 ~ 23,855 levels (V.imp support coincidence of .5% & mid T.line)
The strategy is to take short today after testing the previous High @ 24,401 (the move might start today or 2 days later, Tentative)
Trade Accordingly
All roads lead to Rome Every timeframe in Nifty is for the time being pointing North. But this time with a lot more caution. 24500, 24550 and even 24600 PUTs were added aggressively today. This is the area where we should exercise caution. A covering from the 24600 writers could turn the heat on the writers at the lower strikes.
Trade plan would be to wait for a deep retracement to buy calls and ride back till ATH.

NIFTY INTRADAY ANALYSIS FOR 16/07/2024BUY ABOVE - 24630
SL - 24580
TARGETS - 24700,24760,24830
SELL BELOW - 24530
SL - 24580
TARGETS - 24490,24440,24400
NO TRADE ZONE - 24530 to 24630
Previous Day High - 24630
Previous Day Low - 24530
Based on price action major support & resistance's are here, the red lines acts as resistances, the green lines acts as supports. If the price breaks the support/resistance, it will move to the next support/resistance line. White lines indicates previous day high & low, high acts as a resistance & low acts as a support for next day.
Trendlines are also significant to price action. If the price is above/below the trendlines, can expect an UP/DOWN with aggressive move.
Please NOTE: this levels are for intraday trading only.
Disclaimer - All information on this page is for educational purposes only,
we are not SEBI Registered, Please consult a SEBI registered financial advisor for your financial matters before investing And taking any decision. We are not responsible for any profit/loss you made.
Request your support and engagement by liking and commenting & follow to provide encouragement
HAPPY TRADING 👍

Nifty and BankNifty UpdateHello traders,
Checkout the latest Nifty and BankNifty update and don't forget to watch our previous videos where you can check our levels

25000 OR 24000?Nifty seems to have broken new grounds and that gives it a reason to not fall. Now all it needs is a reason to fly and that could be the budget. Heading into the budget week, immediate target will be ATH, that seems an easy one and the next 25000. If for any reason, of which I am unaware of at present, the index comes back into the lower range, 24000 will be out cushion.
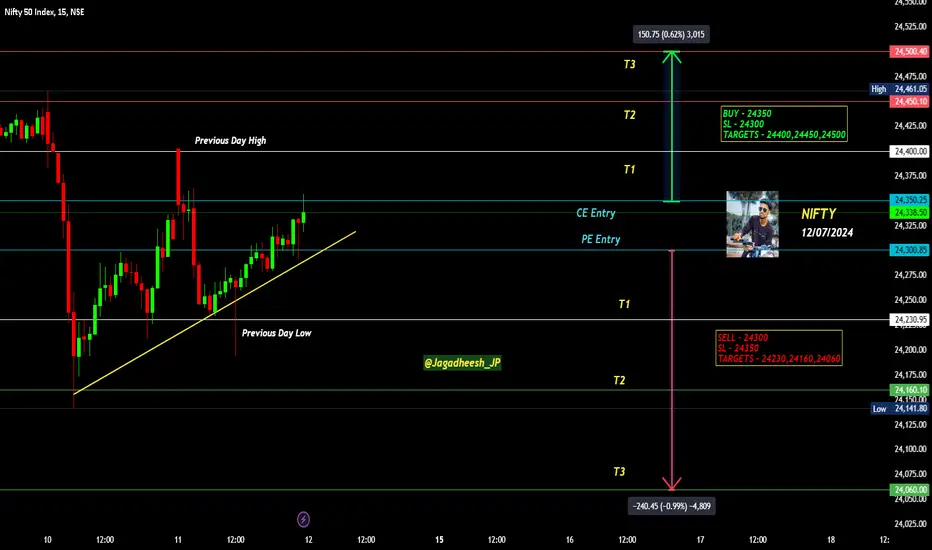
NIFTY INTRADAY LEVELS FOR 12/07/2024BUY ABOVE - 24350
SL - 24300
TARGETS - 24400,24450,24500
SELL BELOW - 24300
SL - 24350
TARGETS - 24230,24160,24060
NO TRADE ZONE - 24300 to 24350
Previous Day High - 24400
Previous Day Low - 24230
Based on price action major support & resistance's are here, the red lines acts as resistances, the green lines acts as supports. If the price breaks the support/resistance, it will move to the next support/resistance line. White lines indicates previous day high & low, high acts as a resistance & low acts as a support for next day.
Trendlines are also significant to price action. If the price is above/below the trendlines, can expect an UP/DOWN with aggressive move.
Please NOTE: this levels are for intraday trading only.
Disclaimer - All information on this page is for educational purposes only,
we are not SEBI Registered, Please consult a SEBI registered financial advisor for your financial matters before investing And taking any decision. We are not responsible for any profit/loss you made.
Request your support and engagement by liking and commenting & follow to provide encouragement
HAPPY TRADING 👍
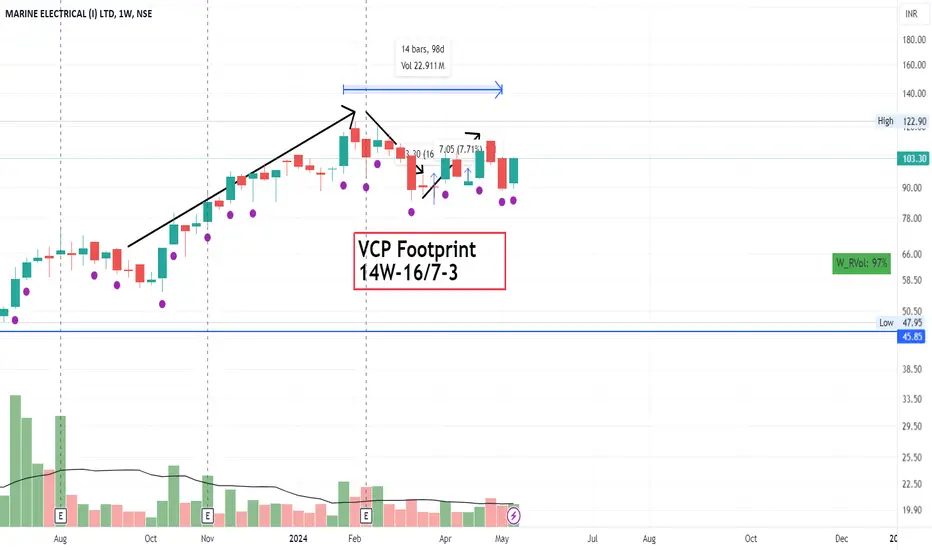
VCP - Excellent Techno Funda PerformerGuys, it seems Marine Electricals getting ready for Super Performance soon. VCP Pattern - 14W-16/7-3 followed by STRONG Order Book both domestic & abroad suggests its a good Techno Funda pick
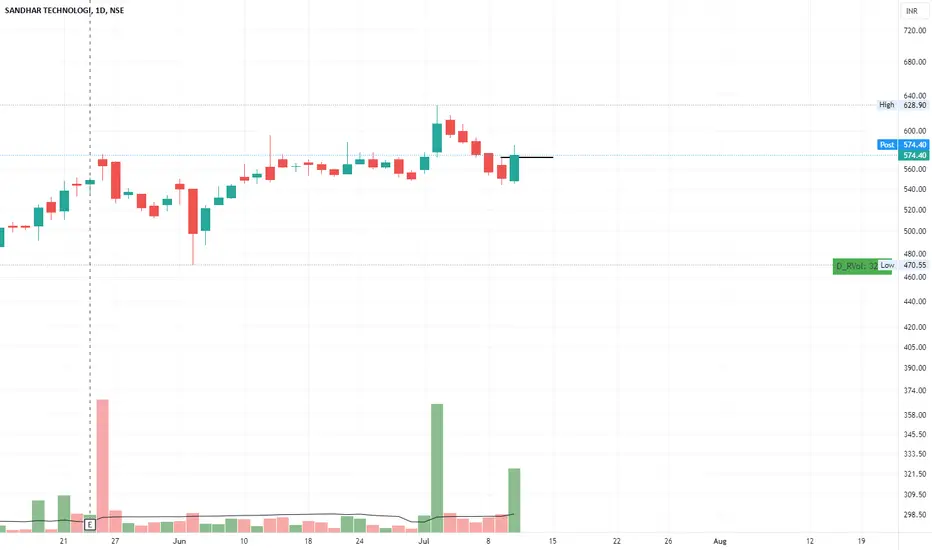
Swing Trade Idea- SANDHAR TechnoSwing Trade Idea- SANDHAR
Entered at 580,
T1 610
T2 630
Let' see how it reacts in this volatile market!
Necklace Pattern=BSOFTBSOFT has shown breakout for chasing it's own Necklace recently.
It will be interesting if it reaches 500 & 588 respectively.

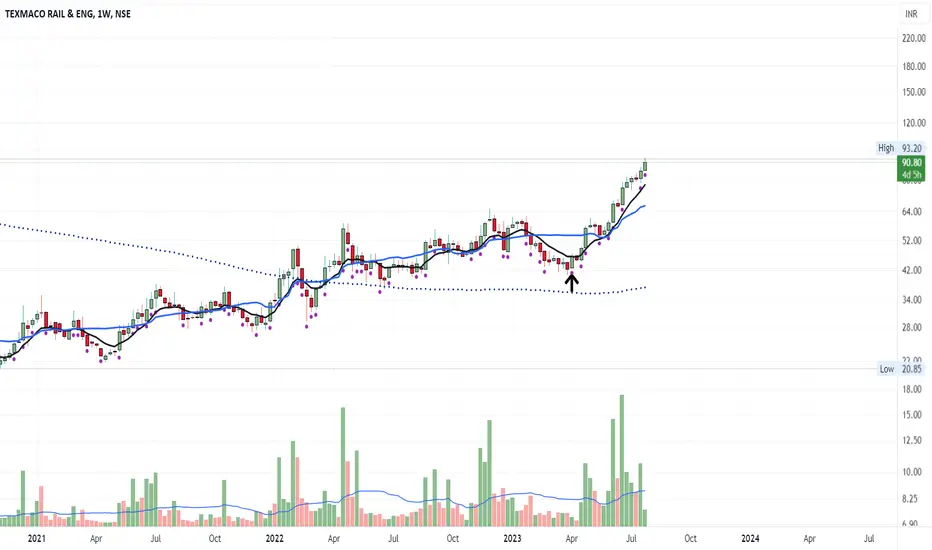
Necklace Pattern=TEXMACO RAILEntered at 46, already 90% Up.
Is it jumping to reach it's ATH?
This is purely for Educational Purpose, Not a Recommendation or up-selling!
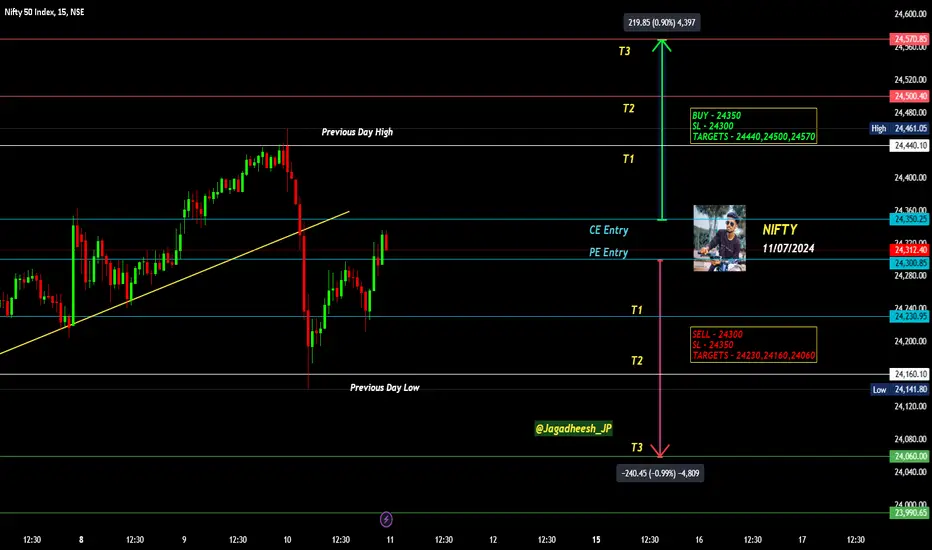
NIFTY INTRADAY LEVELS FOR 11/07/2024BUY ABOVE - 24350
SL - 24300
TARGETS - 24440,24500,24570
SELL BELOW - 24300
SL - 24350
TARGETS - 24230,24160,24060
NO TRADE ZONE - 24300 to 24350
Previous Day High - 24440
Previous Day Low - 24160
Based on price action major support & resistance's are here, the red lines acts as resistances, the green lines acts as supports. If the price breaks the support/resistance, it will move to the next support/resistance line. White lines indicates previous day high & low, high acts as a resistance & low acts as a support for next day.
Trendlines are also significant to price action. If the price is above/below the trendlines, can expect an UP/DOWN with aggressive move.
Please NOTE: this levels are for intraday trading only.
Disclaimer - All information on this page is for educational purposes only,
we are not SEBI Registered, Please consult a SEBI registered financial advisor for your financial matters before investing And taking any decision. We are not responsible for any profit/loss you made.
Request your support and engagement by liking and commenting & follow to provide encouragement
HAPPY TRADING 👍
Nifty_Intraday (11-Jul-2024)The image you provided is a TradingView screenshot showing a 15-minute candlestick chart of the Nifty 50 index from July 9 to July 11. This chart features several technical details:
Date and Time: The chart includes timestamps, helping to track price movements throughout the trading days depicted.
Exponential Moving Average (EMA): A 20-period EMA is plotted, which helps in determining the trend and potential support or resistance areas.
Trading Signals:
-Buy Signal: There's a green arrow pointing upwards with the annotation "Buy Above 24375 Tgt Open for 24500+". This indicates a potential bullish breakout strategy where buying is recommended above 24,375 with an open target extending towards 24,500 or beyond.
-Sell Signal: A red arrow points downwards with the annotation "Sell Below 24250 Tgt 24000-". This suggests a bearish strategy recommending selling below 24,250 aiming for a target around 24,000.

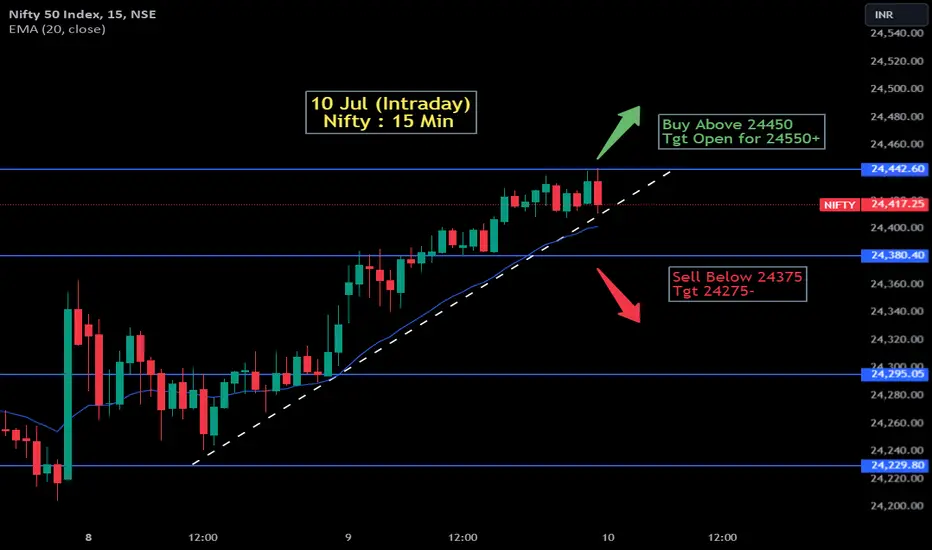
Nifty Intraday (10-Jul-2024)The image displays a chart for the Nifty 50 index from the National Stock Exchange of India, showing intraday movements on a 15-minute time frame. The chart includes details such as:
Date and Time: Published on July 9, 2024, at 18:55 IST.
Index Information: The Nifty 50 Index is shown at various prices, with the current price being 24,417.25, down by 16.80 points.
Technical Analysis: There's a 20-period Exponential Moving Average (EMA) indicated at 24,401.59.
Trading Recommendations:
-Buy Signal: A green arrow points upwards with a note to "Buy Above 24450" targeting an open position above 24,550.
-Sell Signal: A red arrow points downwards suggesting to "Sell Below 24375" with a target (Tgt) of 24,275 or lower.
Nifty Intraday (09-Jul-2024)Description:
Explore intraday trading analysis for Nifty 50. We've identified critical buy and sell levels based on the latest candlestick patterns and EMA trends.
Buy Signal: Consider a long position if Nifty 50 rises above 24,350, with an open target of 24,450+. This move suggests bullish momentum could extend further, offering a potential profit opportunity.
Sell Signal: A short position is advisable if the index drops below 24,265, targeting 24,150-. This setup is based on recent resistance and the potential for downward continuation.
Chart Details:
-Time Frame: 15 minutes
-Indicator: 20-period Exponential Moving Average (EMA)
Trading Strategy:
The strategy utilizes precise entry and exit points to capitalize on short-term price movements. Risk management through stop-loss orders at strategic levels is recommended to minimize potential losses.

Nifty Intraday (08-Jul-2024)It looks like you have provided a trading chart for Nifty 50 Index with specific trading signals for July 8th. Here are the key details from the chart:
Buy Signal:
-Trigger: Above 24,350
-Target: Open for 24,450+
Sell Signal:
-Trigger: Below 24,265
-Target: 24,150-
The chart uses a 15-minute timeframe and shows the price action along with an EMA (20) indicator.

Down by 55% now, one should you buy or avoid it !Here in Aavas Financiers are already declined by 55% in the last few months and currently trading at the 1353 level with strong support at 1335 & 1330. Look like it will take reversal from this level now and again fly high for a strong target as below :
Buy Above 1385 level on a closing basis
Target 1 - 1510
Target 2 - 1588
Target 3 - 1700
Strict Stop loss - 1300
Please consult your financial advisor before taking any trade on my analysis.

Nifty Intraday (05-Jul-2024)The image is a chart displaying the 15-minute price movements of the Nifty 50 Index for July 3rd and 4th, 2024. It includes technical analysis with marked buy and sell signals:
-Buy Signal: A suggestion to buy above 24,350 with a target open for 24,450 or more.
-Sell Signal: A recommendation to sell below 24,275 with a target of 24,125 or lower.
The chart also shows the 20-period Exponential Moving Average (EMA), which helps traders gauge the trend direction and potential support or resistance levels.

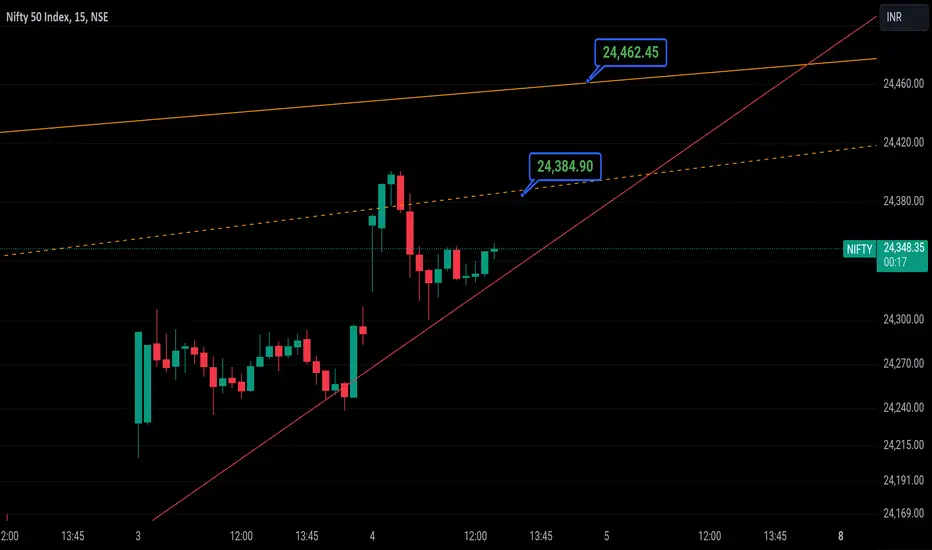
Nifty50 (4th July) 1/1
If candle closes above that dash line or 24384 in hourly then 📈 📈 to 24462
Hourly 🕯 closing below that red line could be 📉 📉
Disclaimer:
It's a personal view not a financial advice and I assume no responsibility and liability whatever outcome arises.