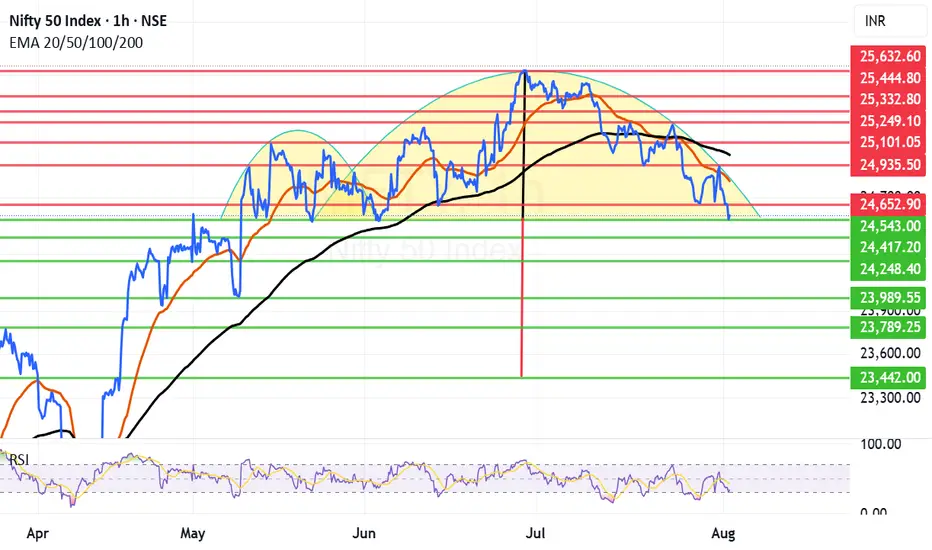
Reverse cup and Handle kind of structure formed in NiftyIn the short term time frame Nifty is seen to be forming reverse cup and handle kind of structure this is considered very bearish structure. However for this bear fest to manifest Nifty needs to close below 24543 or 24417. These 2 levels can save Nifty if not we will see it going into the bear grip.
Thus the most important supports for Nifty remain at 24543 and 24417. Below this level the supports for Nifty will be at 24248, 23989, 23789 and finally major support are is near 23442.
Important resistance areas for Nifty remain at 24652, 24821 (Mother Line Resistance), 24935, 25011 (Father Line Resistance), 25101 and finally 25249. Above 25249 Bulls can become very active.
Till the trade deal chess board and Tariffs do not relent or there is some other very important positive news Nifty will remain under pressure. Let us hope that 24253 or 24417 save us. Long term outlook on Nifty still remains positive. Long term investors should look at the tariff related event as a news that will slowly subside and give way to the Bullish outlook which has been prevailing in the market for decades all together.
Disclaimer: The above information is provided for educational purpose, analysis and paper trading only. Please don't treat this as a buy or sell recommendation for the stock or index. The Techno-Funda analysis is based on data that is more than 3 months old. Supports and Resistances are determined by historic past peaks and Valley in the chart. Many other indicators and patterns like EMA, RSI, MACD, Volumes, Fibonacci, parallel channel etc. use historic data which is 3 months or older cyclical points. There is no guarantee they will work in future as markets are highly volatile and swings in prices are also due to macro and micro factors based on actions taken by the company as well as region and global events. Equity investment is subject to risks. I or my clients or family members might have positions in the stocks that we mention in our educational posts. We will not be responsible for any Profit or loss that may occur due to any financial decision taken based on any data provided in this message. Do consult your investment advisor before taking any financial decisions. Stop losses should be an important part of any investment in equity.
Niftytrend
Long Term Nifty Analysis.(With Economic Commentary). We saw phenomenal resistance by Indian markets today after the Tariff announcements. Nifty bounced back and at one point was 330 points above low of the day. However there was Profit booking and selling on bounce due to prevailing Tariff uncertainties and Nifty came of the peak to close at 24768. Even after losing a lot of ground which it gained it ended up 133 points from the low of the day. Nifty ended the day in the negative losing 87.6 points from yesterday's close. This was much better than estimation of many experts. We might not be out of the woods yet but nevertheless fight back was phenomenal.
Now coming to Tariffs. I am not an expert in economy but let us assume the worst case scenario that trade negotiations fail and this is the tariff stays at 25% + Penalty. Again assuming that we loose 50% of our exports to US due to this decision. Say tariff would apply to 50b worth goods exported by us to USA and we 25b worth business. The impact on GDP will be as under.
GDP Impact = 25b/3.7T= 0.0067 = 0.67% of our GDP will be shaved off..(Rough Estimate). So say our is say 6.5. Then we continue to grow at 5.9 or 5.8. (Again I am not an expert and this estimate is based on a lot of assumption). This loss of GDP can be covered by increasing local consumption or exploring other market. Enhancing ties with markets outside USA. Thus it is not something which is going to kill Indian markets. We survived 1991, We survived Covid, We survived, Ukraine - Russia war, Israel-Iran conflict, Operation Sindoor Lows so we will survive this too and continue thriving. India is destined to become 3rd Largest Economy and unless there are local / internal political mishaps or mess-ups our growth will continue.
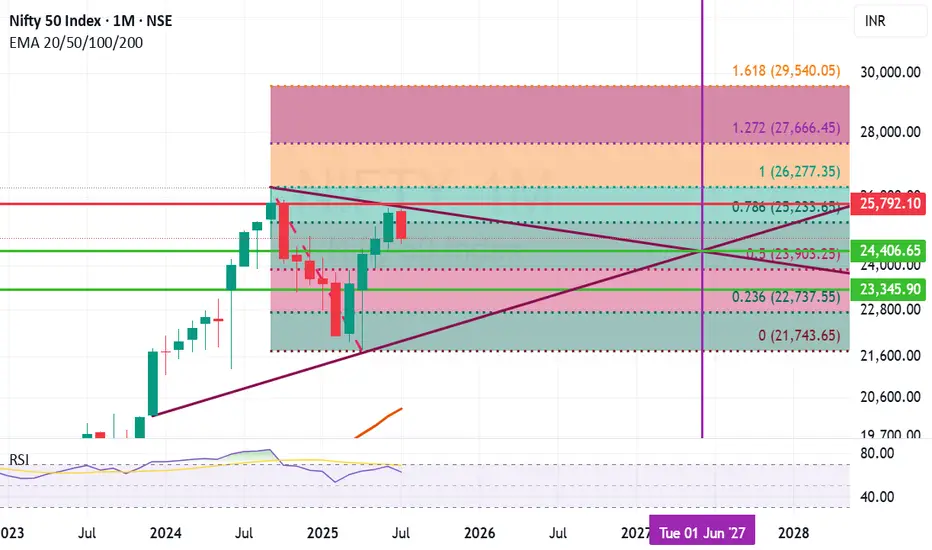
Fibonacci retracement of Nifty ant trend line analysis suggests few important support and resistance levels. The Horizontal line in the chart here suggests the cut off date. The chart suggests that:
Important Supports for Nifty remain at: 24406 (Mid Trend Support), 23903 (Important Fibonacci Support), 23345 (Important Candle support), (Below 23345 Nifty becomes very week and we will be in Bear grip where bears can drag Nifty down to 22737 or even 21742 in unlikely circumstances).
Important Resistance Levels: 25233 (Important Fibonacci resistance), 25792 (Important Candle resistance), 26277 (Previous All Time high), In the long term we might reach 27666 or even 29540 in close to 24 months time.
Conclusion:
Scenario 1) Indian Growth story continues and business thrive the optimistic range for Nifty by June 2027 seems to be the range between 26277 to 29540 or above.
Scenario 2) Indian economy faces changes and internal / external issues hamper progress the pessimistic range for Nifty by June 2027 seems to be anywhere between 23090 to 26277.
Scenario 3) Local or Global catastrophic events unfurl. Global and Indian economy takes a hit (Long drawn wars or local political leadership changes, Covid like events etc.) during this time frame 23090 to 21743 or below..(This does not seem likely but you never say never).
Disclaimer: The above information is provided for educational purpose, analysis and paper trading only. Please don't treat this as a buy or sell recommendation for the stock or index. The Techno-Funda analysis is based on data that is more than 3 months old. Supports and Resistances are determined by historic past peaks and Valley in the chart. Many other indicators and patterns like EMA, RSI, MACD, Volumes, Fibonacci, parallel channel etc. use historic data which is 3 months or older cyclical points. There is no guarantee they will work in future as markets are highly volatile and swings in prices are also due to macro and micro factors based on actions taken by the company as well as region and global events. Equity investment is subject to risks. I or my clients or family members might have positions in the stocks that we mention in our educational posts. We will not be responsible for any Profit or loss that may occur due to any financial decision taken based on any data provided in this message. Do consult your investment advisor before taking any financial decisions. Stop losses should be an important part of any investment in equity.
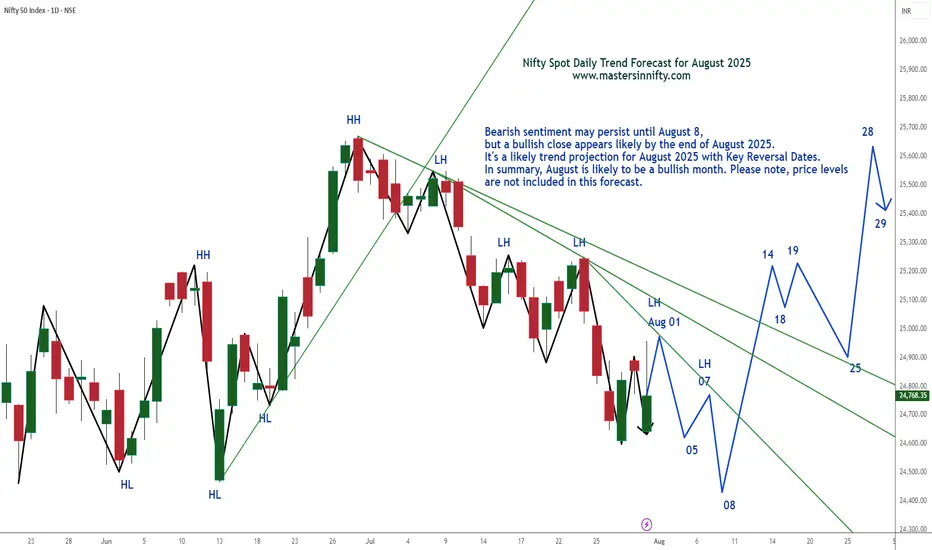
Nifty Spot Index Projection Line for August 2025Bearish sentiment may persist until August 8, but a bullish close appears likely by the end of August 2025.
It's a likely trend projection for August 2025 with Key Reversal Dates. In summary, August is likely to be a bullish month. Please note, price levels are not included in this forecast.
Traders are suggested to conduct own technical studies before entering into the trades and proper risk management is a must.
This is just my personal view.
Best of Luck & Happy Trading.
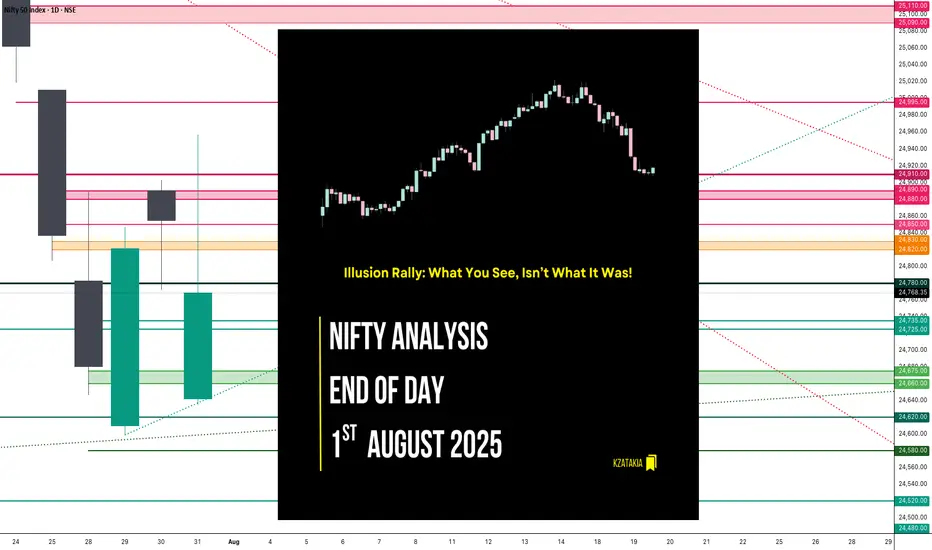
Nifty Analysis EOD – August 1, 2025 – Thursday🟢 Nifty Analysis EOD – August 1, 2025 – Thursday 🔴
🎢 Illusion Rally: What You See, Isn’t What It Was!
🧾 Nifty Summary
As we all expected, a negative gap-down opening occurred due to external news. Nifty opened 183 points lower, tested the 24,660–24,675 support zone, then rebounded sharply after a symmetrical triangle + VWAP breakout. The rally pierced through all key levels like a hot knife through butter, topping at 24,950, only to reverse with equal intensity. Closed at 24,765.
📌 Despite the technical structure, today’s move had no clear technical reasoning — more likely triggered by a mix of tariff news, confidence in Modi, weekly + monthly expiry, and manipulation.
📌 in spite of a bullish candle, strong upper rejection from 24,950 hints weakness. Candle appears bullish on colour, but bears dominated intraday close — forming a bearish Moboroshi Candle (illusion of strength).
📌 Bearish Moboroshi Candle Structure : close > open and close < Previous Close
🔍 Intraday Walk
📉 Gap down of 183 pts
🟢 Support held at 24,660–24,675
🔺 Symmetrical triangle + VWAP breakout
🚀 Sharp upmove to 24,950 zone
🔁 Reversal with same intensity
📉 Closed at 24,765 — below prior close
🖼 5 Min Time Frame Chart with Intraday Levels
📉 Daily Time Frame Chart with Intraday Levels
🕯 Daily Candle Breakdown
Open: 24,642.25
High: 24,956.50
Low: 24,635.00
Close: 24,768.35
Change: −86.70 (−0.35%)
Candle Structure:
✅ Green Candle (Close > Open) → +126.10 pts real body
⬆️ Upper Wick → 188.15 pts (Very Long)
⬇️ Lower Wick → 7.25 pts (Tiny)
Interpretation:
Opened near yesterday's low
Intraday sharp rally towards 24,950+
Faced strong selling at highs
Closed above open, but way below high — signals clear rejection
Candle Type:
📌 Bearish Moboroshi Candle — Appears bullish but hides weakness
🧠 Buyers strong initially, but sellers took control at the top
Key Insight:
Bulls need decisive close above 24,880–24,910
Else, expect drift back toward 24,660–24,675
🛡 5 Min Intraday Chart
⚔️ Gladiator Strategy Update
ATR: 208.29
IB Range: 93.95 → Medium
Market Structure: Unbalanced
Trades Triggered:
✅ 10:40 AM – Long Entry → Trailing Target Hit (R:R – 1:6.25)
📌 Trade Summary: Big R:R win today on breakout with trailing logic execution!
🧱 Support & Resistance Levels
🔺 Resistance Zones:
24,820 ~ 24,830
24,850
24,880 ~ 24,890
24,910
🔻 Support Zones:
24,780
24,725 ~ 24,715
24,660 ~ 24,650
24,620 ~ 24,600
💭 Final Thoughts
"When the move can’t be explained, the best position is caution."
Today's market behavior reinforces the idea that not all moves are technical. Keep your tools sharp, but don’t ignore contextual chaos.
✏️ Disclaimer
This is just my personal viewpoint. Always consult your financial advisor before taking any action.
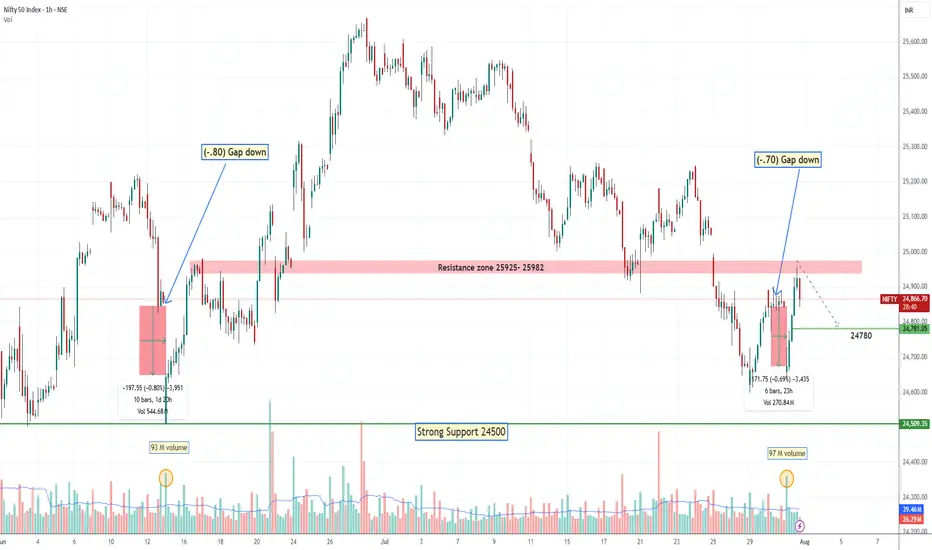
Nifty 24780 Pullback possible on next 1-2 days On 31 July, if someone watch closely price action he could capture Today up move coz Nifty gave almost same price action as 13 June let's try to find what is the Same thing: -
(A)31 July 2025: gap down is (-70%)
volume around 97 million
Bounce Back after gap down around +1%
(B) 13 June: gap down was (-80%)
Volume around 93 million
Bounce back after gap down around +1
On 13 June Nifty faced resistance of 24980 level then retraced. Due to such similarities, we can conclude that it could be pullback around 24780 level although I don't say market will behave same as before, I know every second of market is very dynamic and different from past days, but technical analysis always based on historical data. so, this is just assumption. take the trade on your own analysis & research.
Nifty Analysis EOD – July 30, 2025 – Wednesday🟢 Nifty Analysis EOD – July 30, 2025 – Wednesday 🔴
Trapped in Illusion – A Day of Decoy Moves
Nifty moved 130 points today, falling short of the 2-week average range of 196 points. It formed its IB by 11:40 AM, marking the day's high and low early. For the rest of the session, it hovered between the IB high and the previous day high, eventually closing near the mean.
Despite a close below the open, Nifty managed a green close vs. the previous day—making it a classic "moboroshi candle" day, where visuals deceive sentiment.
📉 Intraday 5 Min Time Frame Chart
🪜 Intraday Walk
IB formed by 11:40 AM
False breakout on both sides trapped traders badly
Nifty stayed stuck between IB high and PDH
Closed slightly above the previous close, but below open
Eyes on breakout of 24,910 for targets of 24,995 and 25,090–25,110
🔄 Trend & Zone Update
📈 Resistance Zone Shifted To: 25,110 ~ 25,090
📉 Support Zone Shifted To: 24,520 ~ 24,480
🕯 Daily Time Frame Chart with Intraday Levels
🕯️ Daily Candle Breakdown
Candle Type: Small Red Hammer‑Like Candle (Decoy / Moboroshi)
Today’s OHLC:
🟢 Open: 24,890.40
🔺 High: 24,902.30
🔻 Low: 24,771.95
🔴 Close: 24,855.05
📈 Change: +33.95 (+0.14%)
📌 Candle Structure:
Real Body: 35.35 pts (Small bearish body)
Upper Wick: 11.90 pts (Very small)
Lower Wick: 83.10 pts (Long)
📌 Key Observations:
Buyers stepped in near 24,770 zone
Closed near open but slightly lower → mild net selling
Long lower wick indicates dip buying support
📌 Implication:
Buyers defended 24,770–24,780 zone
A reclaim of 24,900–24,920 may resume bullish move
A close below 24,770 weakens support
🛡 5 Min Intraday Chart
🛡️ Gladiator Strategy Update
ATR: 195.72
IB Range: 78.15 → Medium
Market Structure: Balanced
💥 Trades Triggered:
🕙 10:25 AM – Short Entry → SL Hit
📌 Trade Summary:
False IB breakouts on both sides led to a stop loss hit—typical trap in a tight consolidation phase.
📌 Support & Resistance Levels
📈 Resistance Zones:
24,880 ~ 24,890
24,910
24,995
25,090 ~ 25,110
📉 Support Zones:
24,830 ~ 24,820
24,780
24,725 ~ 24,715
24,660 ~ 24,650
🔮 What’s Next? / Bias Direction
Awaiting breakout above 24,910 for potential targets of 24,995 and 25,090–25,110. Consolidation may reward patient breakout players in upcoming sessions.
🧠 Final Thoughts
“Structure is key. When levels work, respect them. When they break, adapt.”
Today's range was narrow, but traps show signs of buildup. Be ready when the market unwinds.
✏️ Disclaimer
This is just my personal viewpoint. Always consult your financial advisor before taking any action.

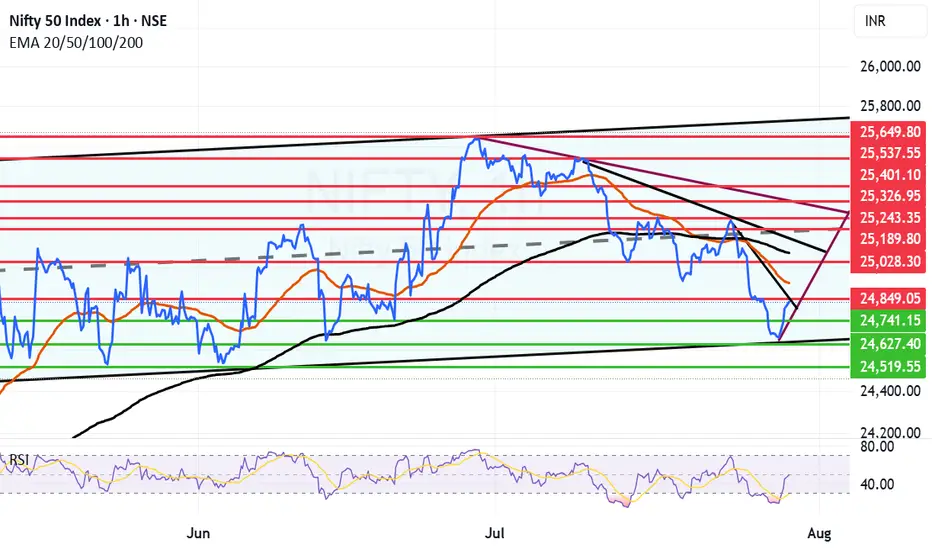
Good turnaround by market as expected from the channel bottom.We had given a message that the market was nearing the bottom and there can be a turnaround sooner than later and market turned around today. This bounce can be currently seen as a technical bounce but it can become a full fledged fightback by bulls if it crosses key resistance levels of Mother line, Father line and Mid-channel resistance. These are the 3 key resistances in front of us currently. All eyes on the important trade deal announcements and with US and China which are on going any news on that from can disrupt the market proceedings in either way. Support and resistance levels for Nifty are as under:
Key Nifty Resistances: 24849 (Trend line resistance), 24922 (Motherline Resistance of hourly chart), 25028, 25070 (Father line resistance), 25189 (Mid-channel resistance), 25243 (Very important resistance for Bulls to conquer). Above 25243 Bulls can gain control of Nifty.
Key Support levels: 25741, 25627 (Channel bottom Support), 24519.
Disclaimer: The above information is provided for educational purpose, analysis and paper trading only. Please don't treat this as a buy or sell recommendation for the stock or index. The Techno-Funda analysis is based on data that is more than 3 months old. Supports and Resistances are determined by historic past peaks and Valley in the chart. Many other indicators and patterns like EMA, RSI, MACD, Volumes, Fibonacci, parallel channel etc. use historic data which is 3 months or older cyclical points. There is no guarantee they will work in future as markets are highly volatile and swings in prices are also due to macro and micro factors based on actions taken by the company as well as region and global events. Equity investment is subject to risks. I or my clients or family members might have positions in the stocks that we mention in our educational posts. We will not be responsible for any Profit or loss that may occur due to any financial decision taken based on any data provided in this message. Do consult your investment advisor before taking any financial decisions. Stop losses should be an important part of any investment in equity.
Nifty Analysis EOD – July 29, 2025 – Tuesday🟢 Nifty Analysis EOD – July 29, 2025 – Tuesday 🔴
Bulls Strike Back After Trendline Trap & Break
Nifty started below the previous day's low, and after marking day low at 24,598.60, it rose to 24,725 where it faced the trendline and CPR zone. A sharp rejection from there quickly pushed Nifty back to the day's open level. A base-building process began, characterized by a low-range but high-volatility phase.
Gradually, Nifty crossed the VWAP and the trendline again, breaking the day's high and CPR zone, ultimately reaching R1 and closing near the highest point at 24,830.40.
In the first half, both long and short traders got trapped in fast swings—refer to the chart for visual cues.
🕯 5 Min Time Frame Chart with Intraday Levels
🔄 Trend & Zone Update
📈 Resistance Zone Shifted To: 25,110 ~ 25,090
📉 Support Zone Shifted To: 24,520 ~ 24,480
🕯 Daily Time Frame Chart with Intraday Levels
🕯 Daily Candle Breakdown
Open: 24,609.65
High: 24,847.15
Low: 24,598.60
Close: 24,821.10
Change: +140.20 (+0.57%)
🕯Candle Structure Breakdown:
Real Body: Green candle (Close > Open):
24,821.10 − 24,609.65 = 211.45 pts (large bullish body)
Upper Wick: 26.05 pts (small)
Lower Wick: 11.05 pts (very small)
🕯Interpretation:
Market opened lower but found strong buying support, rallying to nearly 24,850.
Closed near the day’s high—bulls dominated.
Tiny lower wick shows hardly any selling pressure after the open.
🕯Candle Type:
Bullish Marubozu-type — strong signal of reversal or continuation, indicating control by buyers.
🕯Key Insight:
Strong bounce from sub-24,600 back above 24,800 has improved short-term sentiment.
If 24,830–24,850 breaks in the next session, potential upside till 24,920–24,995.
Support now shifts to 24,700–24,720.
🛡 5 Min Intraday Chart
⚔️ Gladiator Strategy Update
ATR: 202.98
IB Range: 128.5 → Medium
Market Structure: Balanced
Trades Triggered:
🕒 11:10 AM – Long Entry → Target Hit 🎯 (1:3 Risk:Reward)
🧱 Support & Resistance Levels
Resistance Zones:
24,815 ~ 24,830
24,850
24,920
24,995
Support Zones:
24,725
24,693
24,660 ~ 24,650
🧠 Final Thoughts
“Volatility shakes the weak hands; structure empowers the patient.”
Today’s session was a textbook example of how the market tests conviction. After trapping early traders with sharp intraday swings, Nifty rewarded those who respected structure and waited for confirmation. The reclaim of the trendline, VWAP, and CPR zone reinforced the strength of bullish intent. If the momentum continues above 24,850, we may be entering a fresh leg of the uptrend—stay nimble, but don't lose sight of the bigger picture.
✏️ Disclaimer
This is just my personal viewpoint. Always consult your financial advisor before taking any action.

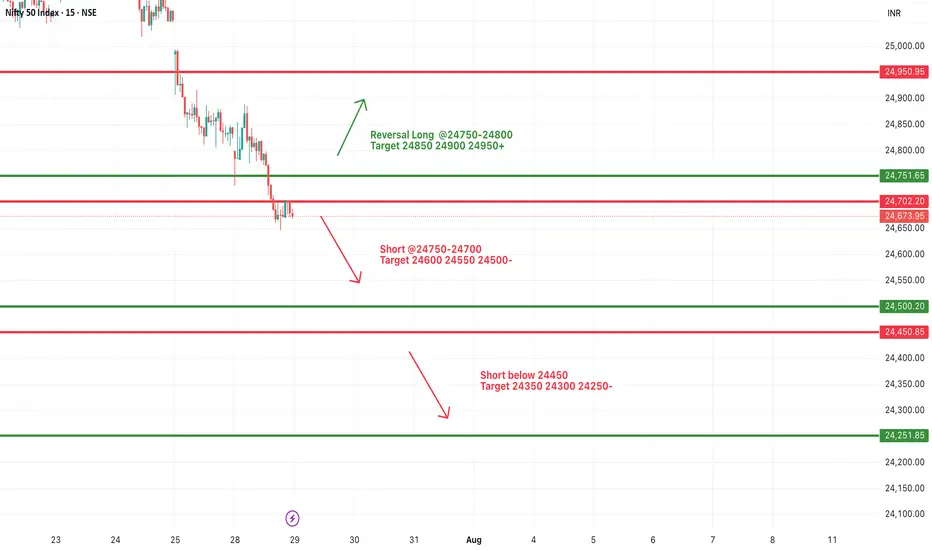
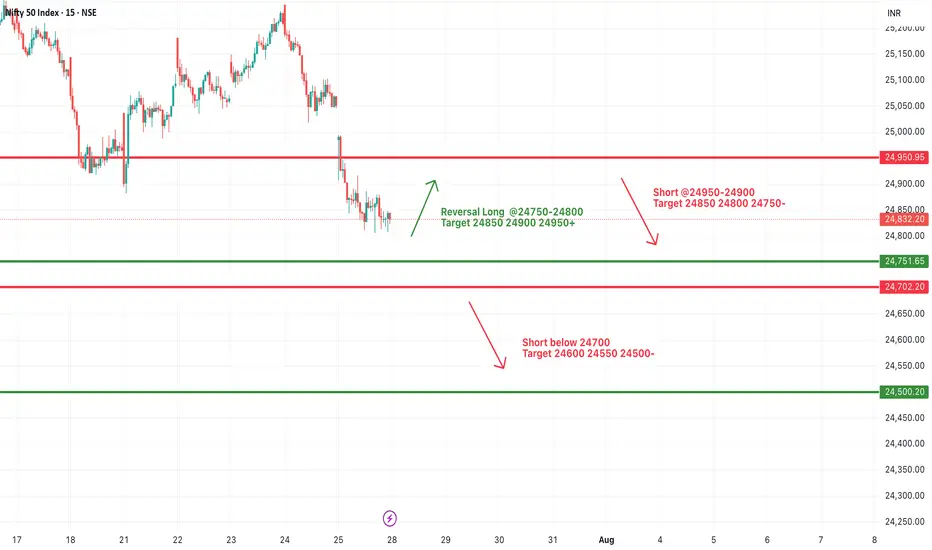
#NIFTY Intraday Support and Resistance Levels - 29/07/2025Nifty is expected to open with a gap-down today, continuing its bearish momentum seen in recent sessions. The index is now trading well below the key resistance zone of 24,750–24,800, with a visible weakness on the chart.
A short opportunity may arise if Nifty stays below the 24,750–24,700 zone. Any pullback toward this level may face selling pressure, and fresh shorts can be considered with downside targets of 24,600, 24,550, and 24,500-.
If the index breaks below the 24,450 level, the selling momentum may intensify, targeting 24,350, 24,300, and 24,250- levels intraday. This level marks a critical support, and traders should closely monitor price action here.
On the other hand, a reversal can only be expected if Nifty reclaims the 24,750–24,800 zone with strength. In that case, a bounce toward 24,850, 24,900, and 24,950+ is possible, but the reversal is only valid if strong bullish price action sustains above 24,800.
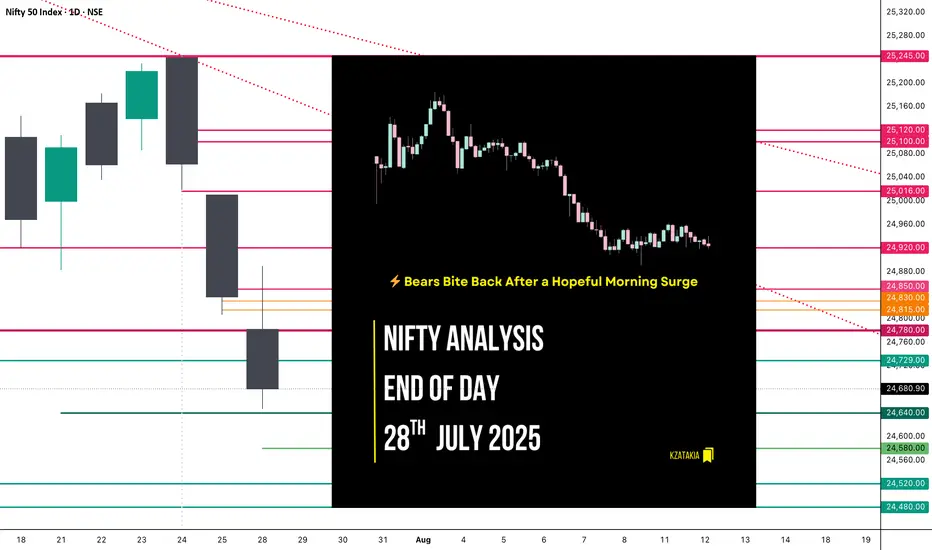
Nifty Analysis EOD – July 28, 2025 – Monday 🟢 Nifty Analysis EOD – July 28, 2025 – Monday 🔴
⚡️ Bears Bite Back After a Hopeful Morning Surge
📊 Nifty Summary
Nifty opened with a minor gap-down of 32 points and slipped an additional 67 points in the first 3 minutes, testing the critical support zone of 24,755 ~ 24,729. After marking a day low at 24,732.70, it witnessed a sharp recovery breaching key levels — CDO, Gap, PDC — and touched the CPR BC level. Rejection from there caused a retracement to the mean, followed by another successful attempt breaching CPR BC and IB High. However, it couldn’t sustain above, as profit booking and pressure from a higher time frame bearish trendline dragged the index below the CPR zone and even past the PDL.
Support at 24,780 offered brief relief, but a bearish triangle formed between the HTF trendline and that support and The breakdown at 12:40 led to a clean move, with the pattern target achieved.
🕯 5 Min Time Frame Chart with Intraday Levels
🔁 Trend & Zone Update
📍 Resistance Zone Shifted To: 25,100 ~ 25,120
📍 Support Zone Shifted To: 24,520 ~ 24,480
🧭 What If Plans – 29th July Outlook
🅰️ Plan A (Contra Long Setup)
If market opens inside the previous day range and finds support at 24,700 ~ 24,729,
→ Potential targets: 24,780, 24,815, 24,840
🅱️ Plan B (Trend is Friend – Short Continuation)
If market opens inside range and faces resistance around 24,830 ~ 24,815,
→ Aim for: 24,780, 24,720, 24,640, 24,580
🔄 On-the-Go Plan
If market Gaps Up/Down outside previous day’s range,
→ Wait for IB formation and act based on structure & S/R levels.
🕯 Daily Time Frame Chart with Intraday Levels
🕯 Daily Candle Breakdown
Open: 24,782.45
High: 24,889.20
Low: 24,646.60
Close: 24,680.90
Change: −156.10 (−0.63%)
🕯 Candle Structure Breakdown:
Real Body: 101.55 pts (Red candle, bearish)
Upper Wick: 106.75 pts (Long — rejection from highs)
Lower Wick: 34.30 pts (Defended slightly)
🕯 Interpretation:
Tried to rally above 24,880 but faced aggressive selling. Closed well below open, forming a bearish rejection candle resembling a shooting star. Bears clearly took control after the intraday bounce attempt.
🕯 Key Insight:
Selling pressure visible from 24,880–24,900 zone.
Close below 24,700 keeps bearish tone intact.
Next Support: 24,650–24,620.
Bulls' challenge: Reclaim and close above 24,850.
🛡 5 Min Intraday Chart
⚔️ Gladiator Strategy Update
ATR: 197.91
IB Range: 122 → Medium
Market Structure: Imbalanced
Trades Triggered:
09:27 – Long Entry → 🎯 Target Hit (1:1.5 R:R)
12:40 – Short Entry → 🎯 Target Hit (1:2.5 R:R)
🧱 Support & Resistance Levels
Resistance Zones:
📍 24,729
📍 24,780
📍 24,815 ~ 24,830
📍 24,850
📍 24,920
Support Zones:
📍 24,640
📍 24,580
📍 24,520 ~ 24,480
💭 Final Thoughts
🧠 “Every breakout starts with hesitation — but not every hesitation leads to a breakout.”
Today’s structure showed strong indecision, but sellers used it to dominate.
Monday’s triangle breakdown proved that structure plus patience = power. Keep your bias flexible and trust your levels.
✏️ Disclaimer
This is just my personal viewpoint. Always consult your financial advisor before taking any action.
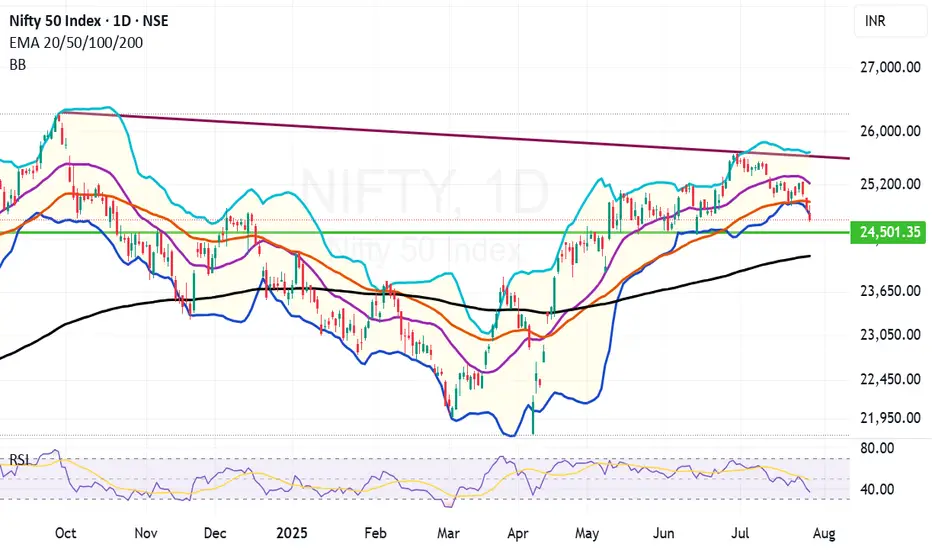
Bollinger band indicates that we might see a recovery soon. Bollinger band in a beautiful tool of Technical analysis. There are three lines in it. The upper bandwidth line, the middle line and the lower band width line.
As you can see in the chart. Whenever the stock or an index price touches or crosses the upper line the indication it gives is that the market is overbought and there is an imminent selling pressure.
Middle line indicates either resistance or support depending on the position of the candle within the band. It further indicates that Middle line will be support when the price is above it. It also indicates that middle Bollinger band will be a resistnace when the candles are below it.
Lower bandwidth line indicates a support zone. When the candles touch or cross it the indication it gives is that the market is oversold and there can be an imminent up move once this phenomenon happens.
Bollinger band in like a channel or a parallel chanel but a more accurate one and a more asymmetric one.
Currently you can see in the chart that Bollinger band has not only touched but also crossed the bottom bandwidth. This is an indication of an over sold market. Thus the indications we get from this tool are that there are very high chances for a short covering recovery or relief rally.
The indication is in sync with Tariff deadline which is tomorrow. Thus any positive announcement on that front can also initiate a strong or mild recovery rally. Thus we might see a bottom formation and recovery rather sooner than later.
Current Nifty closing is at:24680.
Upper band width is at: 25683 (This zone will work as strong resistance zone).
Mid Bandwidth is at: 25217 (This zone will be a Strong resistance).
Mother Line: 24942 (Strong Resistance).
Lower band width is at: 24750 (Weak Resistance).
Nearby support: 24501 (Support).
Father Line: 24157 (Strong Support).
It is a good time to reshuffle your Portfolios and initiate fresh buying in the blue-chip stocks which might be available at a good valuation.
Disclaimer: The above information is provided for educational purpose, analysis and paper trading only. Please don't treat this as a buy or sell recommendation for the stock or index. The Techno-Funda analysis is based on data that is more than 3 months old. Supports and Resistances are determined by historic past peaks and Valley in the chart. Many other indicators and patterns like EMA, RSI, MACD, Volumes, Fibonacci, parallel channel etc. use historic data which is 3 months or older cyclical points. There is no guarantee they will work in future as markets are highly volatile and swings in prices are also due to macro and micro factors based on actions taken by the company as well as region and global events. Equity investment is subject to risks. I or my clients or family members might have positions in the stocks that we mention in our educational posts. We will not be responsible for any Profit or loss that may occur due to any financial decision taken based on any data provided in this message. Do consult your investment advisor before taking any financial decisions. Stop losses should be an important part of any investment in equity.
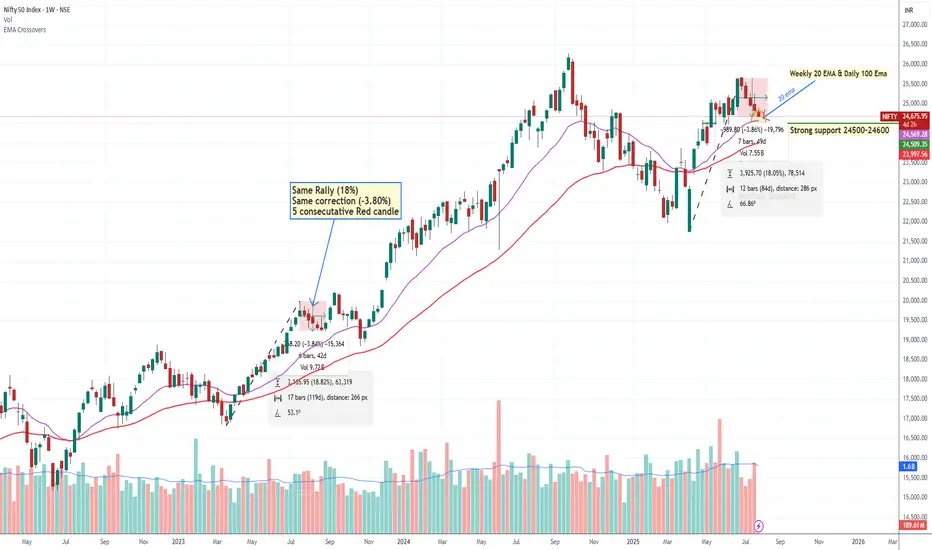
Nifty May Bouncing in Next Week We Are Expecting A bounce back from 24500-24600 level Why? let's Try to understand
(1) Nifty daily Chart 100 EMA
(2) Weekly Chart 200 EMA
(3) there is Multiple support testing around 24500 showing intuitional pending Order.
(4) Nifty bottom out with up move around 18 % & now We are seeing 5 Consecutive Falling
Weekly Candle same pattern happened in July 2023 when nifty Rallied around 18 % and there
was also correction around -3.80%.
(5) A 5-candle rule may apply (Means high possibility of bounce back or pullback if we got 5 consecutive candles either upside or downside)
This is pure technical analysis just based on market behaviour, pattern or historical data. not included any fundamental factor.
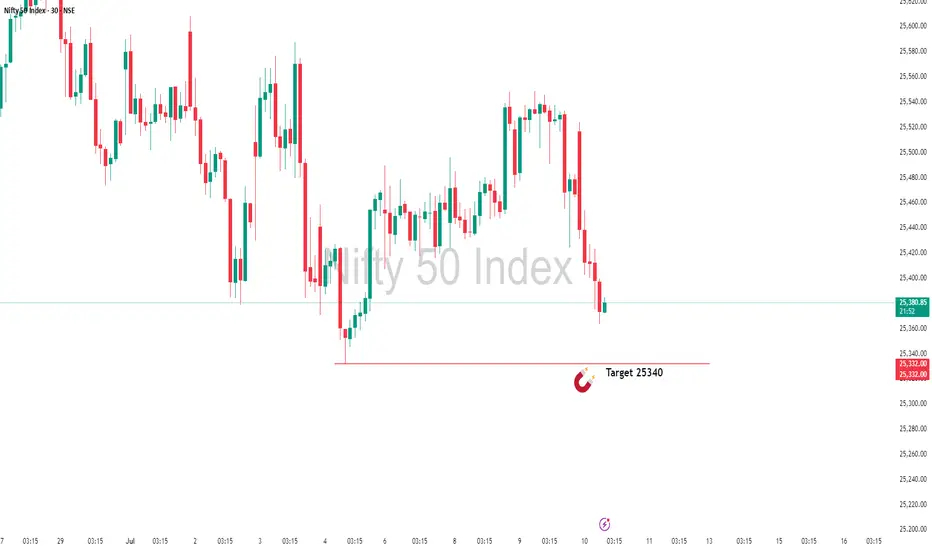
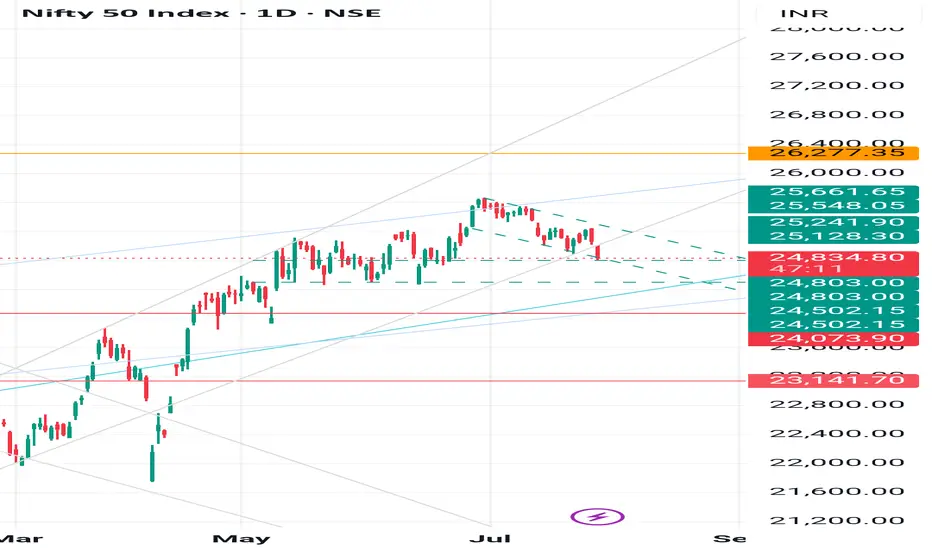
Almost There: Nifty Closing in on My Target Zone 25340In this update, I’m revisiting the setup I shared earlier that points towards NIFTY’s next potential target at 25,340. The analysis covers the key levels, price action structure, and the factors supporting this move. This setup is based on clear technical confirmations and disciplined risk management — not just speculation.
Please remember to follow your own plan and manage your trades responsibly. This is for educational purposes and not financial advice. Let’s see how the price action unfolds!
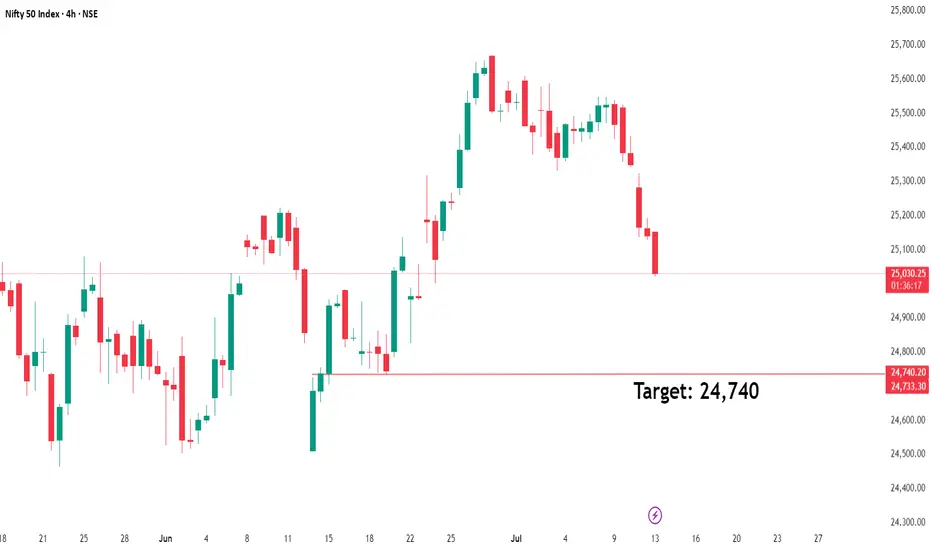
NIFTY 24740: Smart Money Signals Bearish Move IncomingThe directional bias is clear – bearish – and I'm currently waiting for a precise setup to present itself. Based on the Smart Money Concept, we could be looking at a potential short opportunity around the 24740 zone.
📍 Once the setup is confirmed, I’ll be sharing the exact entry and stop-loss levels with you.
Stay tuned – patience here is key. Let the market come to us.
#NIFTY Intraday Support and Resistance Levels - 28/07/2025Nifty is expected to open slightly lower and remains under selling pressure from higher levels. The key intraday zone to watch is 24,750–24,900, which may act as a trigger range for today's direction.
If Nifty sustains above the 24,750–24,800 zone, a short-covering rally may push the index toward 24,850, 24,900, and 24,950+. This zone may offer a reversal opportunity if supported by strong price action.
On the downside, if the index fails to hold above 24,900–24,950, further weakness may be seen below 24,700, opening downside targets at 24,600, 24,550, and 24,500-.
The broader price action suggests a narrow consolidation between 24,700–24,900, with either side breakout likely to lead to intraday momentum. Maintain strict risk management and avoid aggressive trades within this zone.
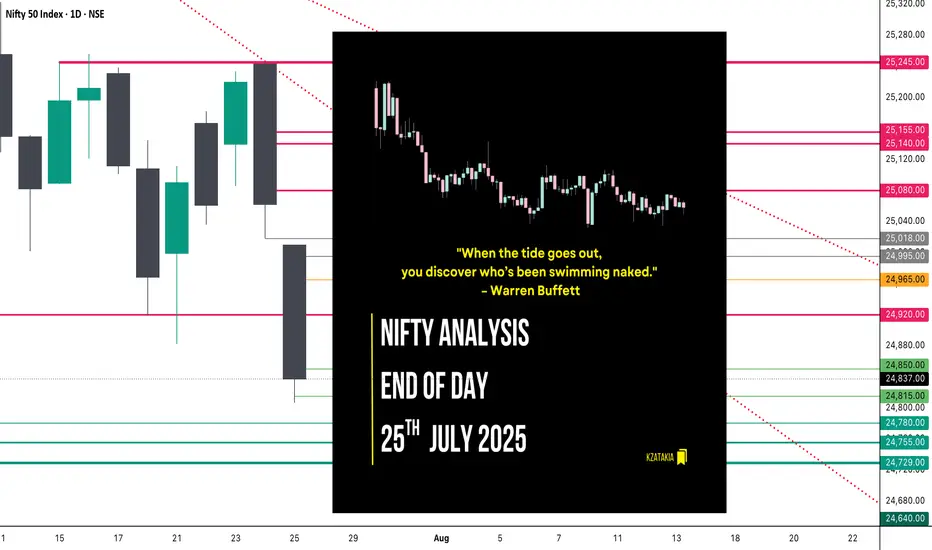
Nifty Analysis EOD – July 25, 2025 – Friday🟢 Nifty Analysis EOD – July 25, 2025 – Friday 🔴
"When the tide goes out, you discover who’s been swimming naked." – Warren Buffett
Nifty GapDowns Below Key Support and Slips Further
The market opened with a sharp GapDown, breaching the previous day's low and instantly shedding 150 points within the first hour. Nifty attempted to find footing near the crucial 21st July low zone of 24,850–24,880, but the support gave way, slipping an additional 50 points.
The day mostly drifted around these lower levels with bearish dominance. Though bulls made an effort to recover late in the session, it lacked strength. The index finally settled at 24,837, decisively closing below the 21st July low — signalling a deeper structural breakdown.
📉 Trend & Zone Update
Resistance Zone Shifted To: 25,144 ~ 25,155
Support Zone Shifted To: 24,729 ~ 24,755
📊 What If Plans – 28th July Outlook
🅰️ Plan A (Contra Long Setup)
If market opens inside the previous day range and finds support at 24,815 ~ 24,850
Then potential targets are 24,920, 24,965, and 25,020
🅱️ Plan B (Trend is Friend – Short Continuation)
If market opens inside range and faces resistance around 24,965 ~ 24,995
Then aim for 24,850, 24,815, 24,780, and 24,730
⏸️ On-the-Go Plan
If market Gaps Up/Down outside previous day’s range
Then wait for the Initial Balance (IB) to form and act based on structure and S/R levels.
🕯 Daily Time Frame Chart with Intraday Levels
🕯 Daily Candle Breakdown
Open: 25,010.35
High: 25,010.35
Low: 24,806.35
Close: 24,837.00
Candle Structure
Body: Strong red candle (−173.35 pts)
Upper Wick: None (open = high)
Lower Wick: 30.65 pts
Interpretation:
A textbook bearish Marubozu — shows sellers had control throughout.
Bears stepped in immediately from open, preventing any bullish response.
Minimal lower wick implies limited buyer defense even at the session low.
Key Insight:
Bears are in command; bulls must reclaim 25,000+ quickly to prevent further downside.
If 24,800–24,820 breaks, eyes shift to 24,700–24,750 zone next.
🛡 5 Min Intraday Chart
⚔️ Gladiator Strategy Update
ATR: 192.95
IB Range: 87.4 → Medium
Market Structure: Imbalanced
Trades Triggered:
🕙 10:10 AM – Short Entry → 🎯 Target Hit (1:2.4 R:R)
🧭 Support & Resistance Levels
Resistance Zones
24,920
24,965
24,995 ~ 25,018
25,080
25,140 ~ 25,155
Support Zones
24,780
24,755 ~ 24,729
24,640
📌 Final Thoughts
When strong candles appear back-to-back with no meaningful recovery in between, it’s not just a correction — it’s a statement. In this market phase, reacting to price structure rather than assumptions will keep you on the right side. Stay nimble, stay prepared.
✏️ Disclaimer
This is just my personal viewpoint. Always consult your financial advisor before taking any action.
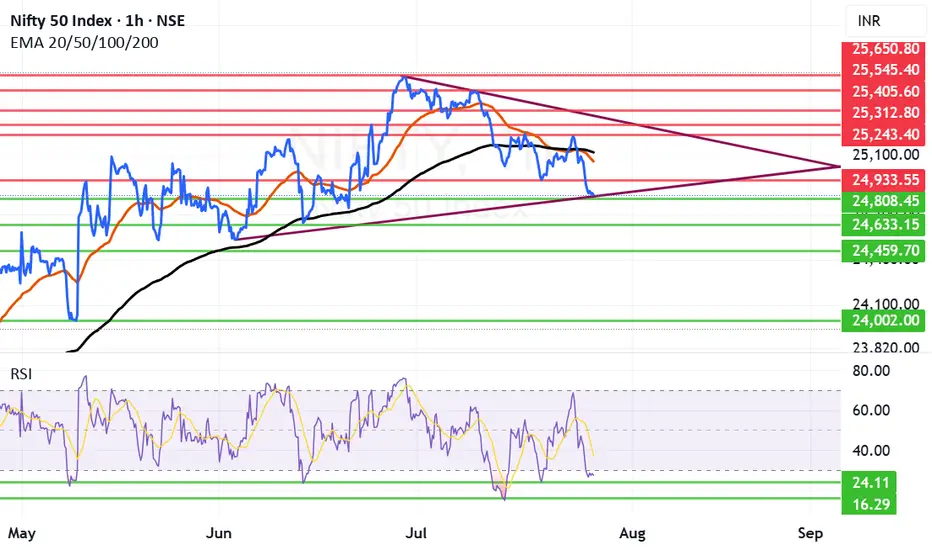
Nifty Chart📉 Nifty Technical Outlook – Bearish Bias with Macro Overhang
Nifty continues to show bearish momentum, having taken strong resistance near the 25450–25800 zone, which aligns with the runaway gap on the daily chart and the 78.6% Fibonacci retracement level from the recent decline.
On the short-term chart, a Head and Shoulder breakdown has already occurred, followed by a retest, which supports the ongoing weak sentiment.
In addition to technical factors, India–US trade talks are currently in focus. Uncertainty around tariffs, tech cooperation, and strategic agreements may keep market participants cautious in the near term. Any negative development could add to downside pressure, while a breakthrough might limit losses.
🔻 Key Technical Levels:
Major Resistance: 25450–25800 (Runaway Gap + Fibo 78.6%)
Immediate Support: 24200 (short-term support zone)
Next Support: 23700 (historical support level)
As long as Nifty stays below 25450, the trend remains bearish, with potential downside toward 24150–24200 and further to 23700, depending on trade talk developments and market sentiment.
📝 Note: This analysis is intended only for study and educational purposes. Please consult a qualified advisor before making any investment decisions. Market behavior is subject to change based on news, global trends, and macroeconomic factors.

Weekly Nifty Analysis Next week, can we have a small bounce in #Nifty?
4 Lower Low
Daily channel Breakdown
Index at crucial weekly support level
Can one bullish week / Doji be expected. One news here or there & boom!
We have monthly expiry this week, let's see.
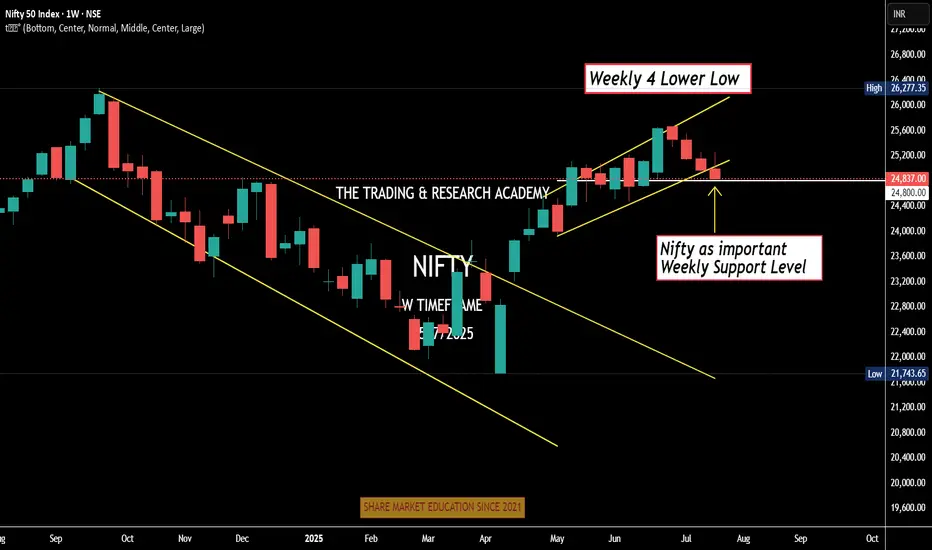
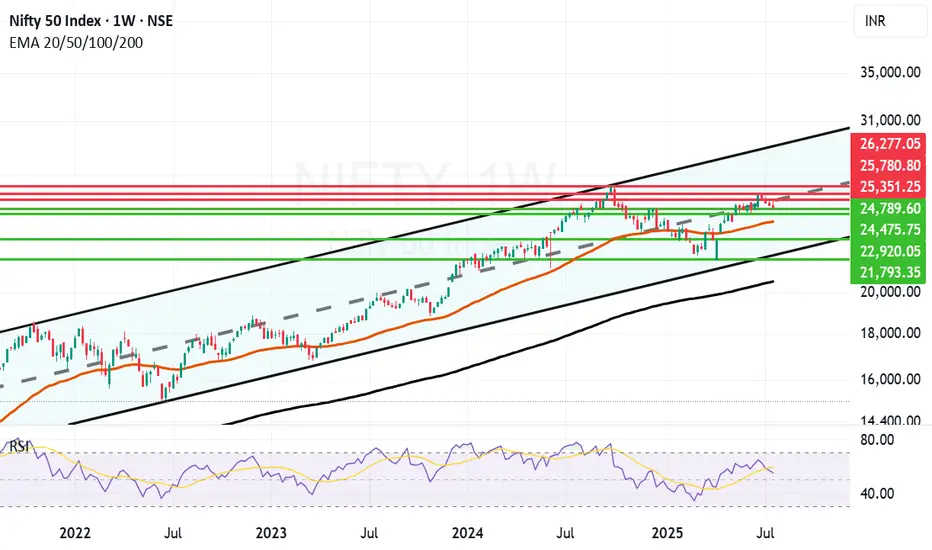
Long term Nifty Outlook Still upbeat. Long term outlook of Nifty is still upbeat. As you can see in the parallel channel in the weekly chart of Nifty. As you can see in the weekly chart Nifty attempted to break free above the Mid-Channel resistance went above it briefly but due to various geopolitical, Tariff and earning related concerns has not yet been successful. In a few years time the channel top can be around 30K and channel bottom seems to be around 21K. Supports for Nifty currently are near 24789, 24475, 23969 (Mother Line support of Weekly chart), 22920 and 21793 (Channel Bottom.) Below that 200 Weeks EMA ot the Father line is at 20577. Resistances for Nifty with long term perspective remain at 25351, 25780 and previous All time high of 26277. Once we get a weekly or monthly closing above 26277 the doors towards 27K+ will open.
Disclaimer: The above information is provided for educational purpose, analysis and paper trading only. Please don't treat this as a buy or sell recommendation for the stock or index. The Techno-Funda analysis is based on data that is more than 3 months old. Supports and Resistances are determined by historic past peaks and Valley in the chart. Many other indicators and patterns like EMA, RSI, MACD, Volumes, Fibonacci, parallel channel etc. use historic data which is 3 months or older cyclical points. There is no guarantee they will work in future as markets are highly volatile and swings in prices are also due to macro and micro factors based on actions taken by the company as well as region and global events. Equity investment is subject to risks. I or my clients or family members might have positions in the stocks that we mention in our educational posts. We will not be responsible for any Profit or loss that may occur due to any financial decision taken based on any data provided in this message. Do consult your investment advisor before taking any financial decisions. Stop losses should be an important part of any investment in equity.
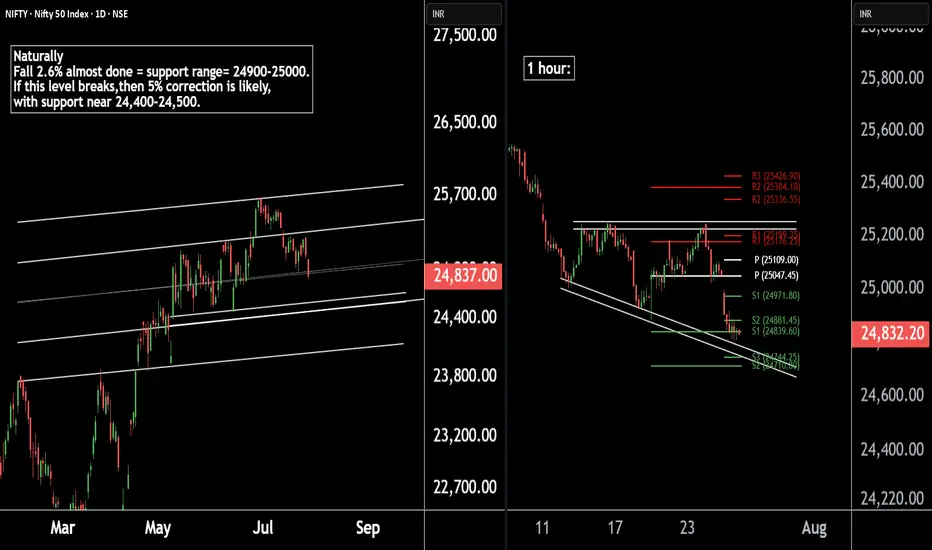
Nifty 50 Update | Technical Levels MappedThere are two chart of Nifty50.
Nifty 50 is trading within a well-defined parallel channel. As part of its natural corrective phase, a potential decline of around 5% cannot be ruled out, with key support anticipated near the 24,400–24,500 zone.
Nifty is forming a broadening wedge pattern on the 1-hour timeframe, with crucial support around 24,740. Additionally, both the weekly and monthly pivot supports are aligned in the 24,740–24,710 zone, reinforcing the significance of this level.
If this level sustain then we may see higher prices in Nifty50.
Thank You !!
Nifty Next Week: Can Nifty make a comeback after drubbing?Nifty received proper drubbing after falling below critical supports of Mother and Father line. Trump's warning signals for IT companies and the continuing deadlock in Trade deal with US weighing on Indian markets. Additionally the earning season also giving many disappointing and few good result has broken the back of the Bull rally and now Nifty is reeling under 25K levels.
Only silver line in the cloud seems to be that RSI is below 30. Currently RSI is at 27.52. Usually RSI has found support near 24 if not 24 it might bounce back from 16. So hopefully we can see some short covering in the beginning or middle of next week. Also next week the decision for Tariffs should come. If the result will be in favour of India we might see a strong come back as lot of sectors / Large cap stocks currently are looking oversold.
The Supports for Nifty Remain at: 24808 (Strong support), 24633, 24459 Below 24459 the index will be in firm grip of Bears who might try to drag Nifty towards 24K levels or even below that in unlikely circumstances.
The Resistances for Nifty Remain at: 24933, 25058 (Mother Line Resistance of Daily Chart), 25119 (Father Line Resistance) and 25243. After we get a closing above 25243 the Bulls can gain some momentum.
Disclaimer: The above information is provided for educational purpose, analysis and paper trading only. Please don't treat this as a buy or sell recommendation for the stock or index. The Techno-Funda analysis is based on data that is more than 3 months old. Supports and Resistances are determined by historic past peaks and Valley in the chart. Many other indicators and patterns like EMA, RSI, MACD, Volumes, Fibonacci, parallel channel etc. use historic data which is 3 months or older cyclical points. There is no guarantee they will work in future as markets are highly volatile and swings in prices are also due to macro and micro factors based on actions taken by the company as well as region and global events. Equity investment is subject to risks. I or my clients or family members might have positions in the stocks that we mention in our educational posts. We will not be responsible for any Profit or loss that may occur due to any financial decision taken based on any data provided in this message. Do consult your investment advisor before taking any financial decisions. Stop losses should be an important part of any investment in equity.
Reliance: 24837 - 1st target exact doneAs posted yesterday, 24836.65 this target is done today.
Now sideways move are expected for 1-2 sessions and 24545 is expected slowly.
Keep an eyes on this level.
As soon as this is done we can expect big upside moves with rapid action. 👍🚩
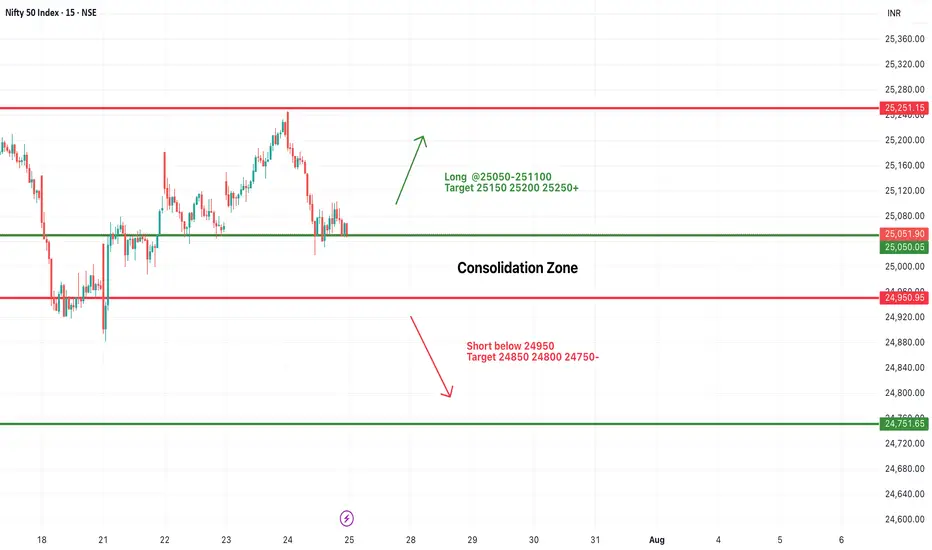
#NIFTY Intraday Support and Resistance Levels - 25/07/2025Nifty is expected to open with a slight gap-down and is currently trading within a tight consolidation zone between 24,950 and 25,050. This narrow 100-point range has acted as a critical zone over the past sessions, indicating indecision and low conviction among traders.
A sustained move above 25,050–25,100 may provide a long opportunity with potential upside targets of 25,150, 25,200, and 25,250+. Strong bullish momentum will only be confirmed if Nifty manages to close above 25,250, which may push the index further toward 25,350–25,400 in the coming days.
On the other hand, a breakdown below 24,950 will shift the bias toward bearishness. A short setup could then target 24,850, 24,800, and 24,750- levels.
Until then, expect sideways price action between 24,950 and 25,050. Traders should wait for a breakout or breakdown before entering fresh trades. Avoid aggressive entries inside this tight band.