#NIFTY Intraday Support and Resistance Levels - 19/02/2025A flat opening today in nifty, with the index currently positioned near 23000-22950. If Nifty moves above 23050, a long position can be considered, targeting 23150, 23200, and 23250+.
However, a reversal short trade can be initiated around 23000-22950, with downside targets of 22900, 22850, and 22800. On the bearish side, a breakdown below 22750 will likely lead to further declines, with short targets set at 22650, 22550, and 22500.
Since the price is currently moving within the 22950-23000 range, the market is likely to open flat and may remain range-bound initially. The decisive move will come if it either breaks above 23050 for an uptrend or falls below 22750 for a bearish move. Should wait for a breakout confirmation before entering positions.
Niftytrend

Nifty stopped by Trendline and Mid-Channel Resistance. Nifty again today was stopped by the trendline and mid channel resistance inside the falling channel. A closing above mid-channel around 22967 will enable some strength to Nifty. However closing above the Mid-Channel will not be enough as there are 50 hours resistance line or the Mother line of hourly chart nearby as well. This Mother line is at 23043. The next resistance if we get a closing above 23043 will be near 23200. After this hurdle is crossed the next hurdle is near 23307. 23307 is the Father line of hourly chart. Post crossing this area the channel top will be near 23494. Supports for Nifty right now are at 22802, 22745. If 22745 is broken channel bottom support is near 22451 and post that trend bottom support near 22114. The closing was negative today but shadow of the candle is neutral to positive. Which can be considered a possible sign of reversal. However it is to early to call it a clear reversal until we get a closing above 23494.
Disclaimer: The above information is provided for educational purpose, analysis and paper trading only. Please don't treat this as a buy or sell recommendation for the stock or index. The Techno-Funda analysis is based on data that is more than 3 months old. Supports and Resistances are determined by historic past peaks and Valley in the chart. Many other indicators and patterns like EMA, RSI, MACD, Volumes, Fibonacci, parallel channel etc. use historic data which is 3 months or older cyclical points. There is no guarantee they will work in future as markets are highly volatile and swings in prices are also due to macro and micro factors based on actions taken by the company as well as region and global events. Equity investment is subject to risks. I or my clients or family members might have positions in the stocks that we mention in our educational posts. We will not be responsible for any Profit or loss that may occur due to any financial decision taken based on any data provided in this message. Do consult your investment advisor before taking any financial decisions. Stop losses should be an important part of any investment in equity.

NIFTY : Trading levels and Plan for 19-Feb-2025We will analyze potential trade setups for NIFTY based on three different opening scenarios: Gap-Up, Flat, and Gap-Down. The plan is designed to help traders navigate the market effectively while managing risk.
📍 Scenario 1: Gap-Up Opening (100+ Points)
If NIFTY opens with a gap-up above 22930, we need to carefully assess the price action at key resistance zones.
✅ Plan of Action:
If the index sustains above 22950, it may move towards the 23039-23065 resistance zone.
A strong breakout above 23065 can push NIFTY towards 23178. However, watch for rejection signs near resistance.
If price struggles at 23039-23065, it may provide a short opportunity with a downside target of 22895-22949.
🛑 Invalidation: If NIFTY breaks and sustains above 23065, bearish trades should be avoided.
🎯 Bullish Target: 23178
🔻 Bearish Target: 22895
📍 Scenario 2: Flat Opening
A flat opening near 22,923 requires patience as price discovery takes place.
✅ Plan of Action:
If price remains between 22,895 - 22,949, it's a No-Trade Zone 📌 – avoid choppy action.
A breakout above 22,950 can push the index towards the 23039-23065 resistance area.
A breakdown below 22,895 may lead to a test of the 22,755-22,779 support zone.
If NIFTY takes support at 22,755, it may provide a buying opportunity.
🚨 No Trading in Choppy Zone: Avoid entering positions unless there is a clear breakout or breakdown.
🎯 Bullish Target: 23039
🔻 Bearish Target: 22,755
📍 Scenario 3: Gap-Down Opening (100+ Points)
If NIFTY opens below 22,850, it suggests weakness and a test of key support zones.
✅ Plan of Action:
If price holds 22,755-22,779, a bounce-back move can be expected.
A strong breakdown below 22,755 can drag NIFTY towards the 22,648-22,672 weak buyer’s support.
If the market finds demand at 22,648, it could lead to an intraday reversal opportunity.
📢 Watch out for panic selling near support zones – look for reversal signs before going long.
🎯 Bullish Target: 22,923
🔻 Bearish Target: 22,648
🎯 Risk Management & Pro Tips for Options Traders
📌 Avoid buying options immediately after market opens – wait for direction confirmation.
📌 Use stop-loss wisely – protect capital in volatile conditions.
📌 Time decay matters! If trading options, avoid holding losing positions for too long.
📌 Watch for wicks & rejection candles near key levels to time your entries better.
📌 Summary & Conclusion
✅ Key Resistance Levels: 23039-23065, 23178
✅ Key Support Levels: 22,755-22,779, 22,648-22,672
✅ No Trade Zone: 22,895 - 22,949
🚀 Bullish above: 22,950
📉 Bearish below: 22,755
⚠️ Disclaimer: I am not a SEBI-registered analyst. This analysis is for educational purposes only. Trade at your own risk! 💡

NIFTY 18 FEB 2025 - Key Levels 📊 Intraday Key Levels & Market Outlook 🔥
🚀 Current Market Price (CMP): 22,963.50
📈 Bullish Above (Resistance Levels):
🔴 23,037.40 – Key resistance zone, potential rejection area.
🔴 23,127.90 - 23,180.60 – Major resistance, break above could trigger strong bullish momentum.
🔴 23,311.70 - 23,322.65 – Critical supply zone, major breakout level.(IT' PNEED TO TOUCH BUT MAY BE NOT TODAY)
📉 Bearish Below (Support Levels):
🟠 22,835.90 - 22,816.60 (Key Yellow Zone) – This acts as a bullish/bearish pivot:
Above this, buyers may dominate.
Below this, sellers could take control.
🟢 22,665.90 - 22,624.80 – Demand zone, possible bullish bounce.
🟢 22,550.00 (New Support) – Additional key level, could act as strong support if price drops further.
📌 Trading Plan:
🔹 Above 22,835.90 – Bullish bias; look for buying setups.
🔹 Below 22,816.60 – Bearish bias; look for shorting opportunities.
🔹 Breakout traders should wait for confirmation before entering trades.
#Trading #StockMarket #Intraday #PriceAction #TradingView

#NIFTY Intraday Support and Resistance Levels - 18/02/2025Today will be flat opening expected in nifty. After opening important level is 23000. If nifty starts trading above 23050 then possible upside rally in opening session. If nifty not sustain above level and starts trading below 22950 then sharp downside expected upto 22800 and this can be extend further for 200+ points if nifty gives breakdown of 22750 level.

Great 234 point comeback by Nifty from lows of the day. Nifty made a great comeback of 234 points from lows of the day that is 22725 to close at 22959. The momentum has to carry forward tomorrow in order for any rally to sustain. Only when we get a closing above Mother and Father line Bulls can take a sigh of relief. Mother line and Father line are at 23530 and 23587 respectively. Before we reach there there are cyclical resistances 3 months or older at 22984, 23229 and 23435. Supports for Nifty will be at 22725, 22438 and 22159. If we get a weekly closing below 22159 the next supports will be at 21810 and 21302 only. So despite a good closing we are not out of danger zone as of now. Shadow of the candle is neutral as of now.
Disclaimer: The above information is provided for educational purpose, analysis and paper trading only. Please don't treat this as a buy or sell recommendation for the stock or index. The Techno-Funda analysis is based on data that is more than 3 months old. Supports and Resistances are determined by historic past peaks and Valley in the chart. Many other indicators and patterns like EMA, RSI, MACD, Volumes, Fibonacci, parallel channel etc. use historic data which is 3 months or older cyclical points. There is no guarantee they will work in future as markets are highly volatile and swings in prices are also due to macro and micro factors based on actions taken by the company as well as region and global events. Equity investment is subject to risks. I or my clients or family members might have positions in the stocks that we mention in our educational posts. We will not be responsible for any Profit or loss that may occur due to any financial decision taken based on any data provided in this message. Do consult your investment advisor before taking any financial decisions. Stop losses should be an important part of any investment in equity.

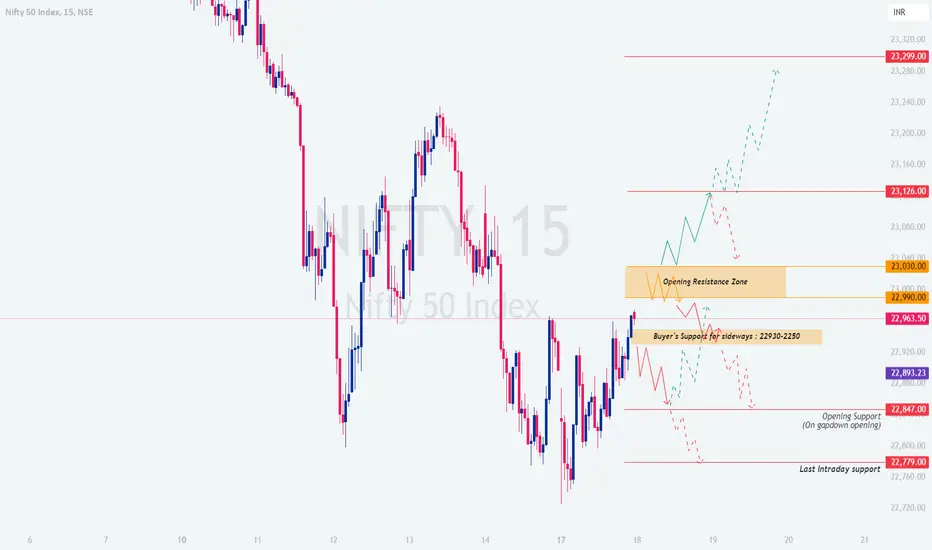
NIFTY : Trading levels and Plan for 18-Feb-2025
The market structure and price action suggest a key decision-making zone around 22,990-23,030. Based on the opening price, we will approach the trade accordingly.
🔹 1. Gap-Up Opening (100+ Points Above Previous Close)
If NIFTY opens with a gap-up above 23,030, it will directly enter the resistance zone. Here’s how to plan:
A rejection from 23,126 can trigger a short trade targeting 22,990. Confirmation is needed via bearish candles.
If NIFTY sustains above 23,126, a further rally towards 23,299 is possible. Look for a breakout retest before entering long positions.
Avoid fresh longs near resistance unless volume confirms breakout strength.
📌 Pro Tip: If opening above resistance, avoid chasing longs immediately; wait for a pullback.
🔹 2. Flat Opening (Near Previous Close: 22,954-22,990)
If price holds 22,990 and bounces, expect a push towards 23,030 and possibly 23,126.
A breakdown below 22,963 can lead to a drop towards 22,847.
Consider sideways movement between 22,990-23,030 as a no-trade zone unless a clear trend emerges.
📌 Pro Tip: Flat opens demand patience—wait for clear directional movement before entering.
🔹 3. Gap-Down Opening (100+ Points Below Previous Close)
If NIFTY opens below 22,847, it enters the support zone. Here’s how to approach:
A bullish rejection from 22,779 can offer a good long trade towards 22,847-22,963.
If the support fails, expect a deeper correction towards 22,720.
Sideways action in the 22,779-22,847 zone suggests waiting for trend confirmation.
📌 Pro Tip: Don’t rush into long trades unless price action confirms demand at support.
🔸 Risk Management & Options Trading Tips 🛡️
Keep SL tight, especially if trading near resistance/support zones.
Use option spreads to reduce risk in high-volatility conditions.
Avoid overtrading—stick to planned levels and execution strategies.
Watch open interest data to confirm market direction.
📌 Summary & Conclusion
✅ Resistance Levels: 23,030 → 23,126 → 23,299✅ Support Levels: 22,963 → 22,847 → 22,779✅ Trade Carefully in No Trade Zone: 22,990-23,030
🎯 The market is at a crucial level; patience and confirmation-based entries are key! Let the price action guide your trades.
⚠️ Disclaimer: I am not a SEBI-registered analyst. This analysis is for educational purposes only. Trade at your own risk! 🚀
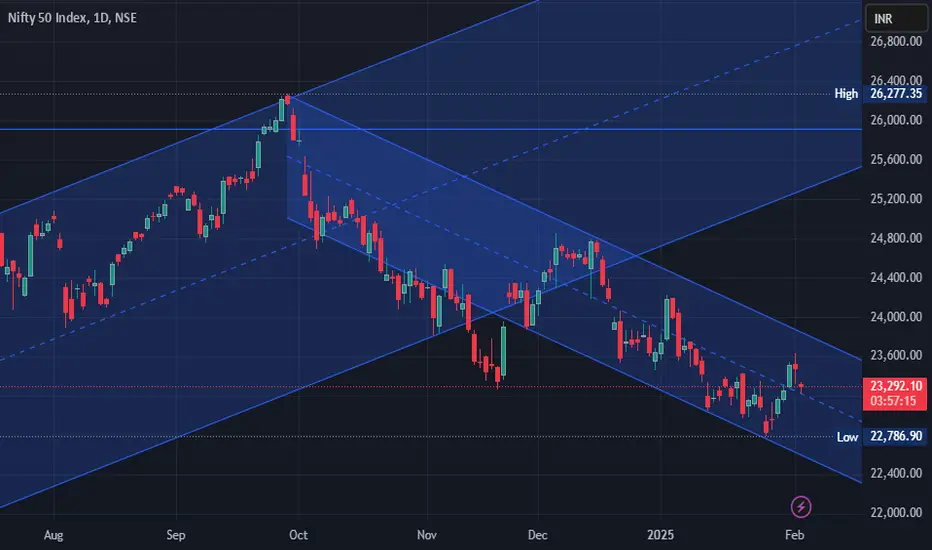
Nifty50 in negative zone : Be cautiousHello Friends,
After analyzing the long-term chart of the Nifty50 Index, I believe it has entered a negative zone. Therefore, I advise caution before taking long positions. It is wise to avoid speculation and naked derivative positions. If you decide to trade, please do so with strict stop-loss orders; otherwise, it may be best to refrain from initiating fresh positions.
I believe the Nifty50 has strong support at 22000 levels. However, any entry at those levels should depend on market movement and sentiment at that time.
It is important to note that this is not the time to book losses or exit in a panic, nor to re-enter at 22000 levels. I recommend holding existing positions and staying patient.
These are merely my observations regarding the market, and readers may have differing opinions.

#NIFTY Intraday Support and Resistance Levels - 17/02/2025Flat opening expected in nifty. After opening nifty will face strong resistance at 23000 level and expected downside movement upto the 22800 in opening session. For today's session, 22800 is the important support if nifty break this support and starts trading below 22750 then sharp downside rally possible upto 22500 level. Any major upside rally only expected if nifty starts trading and sustain above the 23050 level.

NIFTY : Trading levels and plan for 17-Feb-2025
🔍 Market Context: NIFTY has shown a strong downtrend with critical resistance and support levels forming significant zones. The price action near key levels will determine the direction for the day. Let’s break down possible scenarios.
1. Gap-Up Opening (100+ Points Above 22,996) If NIFTY opens above 22,996 , it enters the "Opening Resistance/Support Zone". Sellers may step in around this zone, leading to a possible rejection and downside move toward 22,918 . If the price sustains above 23,135 , bullish momentum could extend toward the 23,359 resistance zone. Profit booking is expected around 23,359 , making it a key level to watch for reversals.
🔹 Action Plan: ✅ If NIFTY faces rejection at 22,996 , consider short trades with a target of 22,918 .✅ If price sustains above 23,135 , go long with a target of 23,359 .✅ If NIFTY reaches 23,359 , consider partial profit booking.
💡 Tip: In a gap-up scenario, option premiums inflate. Consider spreads instead of naked options to control risk.
2. Flat Opening (Between 22,918 - 22,996) A flat open indicates uncertainty, keeping price inside the No Trade Zone (22,912 - 22,996) . A breakout above 22,996 signals bullish momentum toward 23,135 . A breakdown below 22,918 invites selling pressure toward the 22,743 - 22,677 support zone.
🔹 Action Plan: ✅ Avoid taking trades within 22,912 - 22,996 until a clear breakout occurs.✅ If price breaks 22,996 , go long with a stop-loss below 22,900 .✅ If price breaks below 22,918 , go short targeting 22,743 .
💡 Tip: Flat openings often trap traders. Wait for 15-30 minutes before entering trades.
3. Gap-Down Opening (100+ Points Below 22,743) A gap-down opening below 22,743 signals bearish sentiment. The 22,508 level is a critical intraday support – breaking below it can accelerate selling pressure. If NIFTY bounces back from 22,508 , it could trigger an intraday pullback toward 22,743 .
🔹 Action Plan: ✅ If price sustains below 22,743 , go short with a target of 22,508 .✅ If price holds 22,508 and reverses, consider long trades for an intraday recovery.✅ A move above 22,743 can lead to short covering toward 22,918 .
💡 Tip: In a gap-down scenario, IV (Implied Volatility) spikes, making option premiums expensive. Selling OTM call options can be a profitable strategy.
⚠ Risk Management & Options Trading Tips
🔹 Always use stop-loss – Never trade without a predefined risk level.🔹 Position sizing is key – Avoid over-leveraging.🔹 Trade with confirmation – Enter only after clear price action signals.🔹 Manage time decay – If buying options, choose ATM or ITM strikes to reduce theta decay.
📌 Summary & Conclusion
✅ Key Levels to Watch:
Resistance: 22,996 / 23,135 / 23,359
Support: 22,918 / 22,743 / 22,508
✅ Trading Plan Overview:
Gap-Up: Watch for rejection at 22,996 , possible breakout toward 23,135 .
Flat Open: No Trade Zone between 22,912 - 22,996 – wait for breakout.
Gap-Down: If below 22,743 , bearish sentiment dominates with 22,508 as the key support.
💡 Final Tip: Trade with discipline and follow your plan. Avoid emotional decisions – the market rewards patience! 🚀
📢 Disclaimer: I am not a SEBI registered analyst . This trading plan is for educational purposes only . Please do your own research before taking any trades. 📊

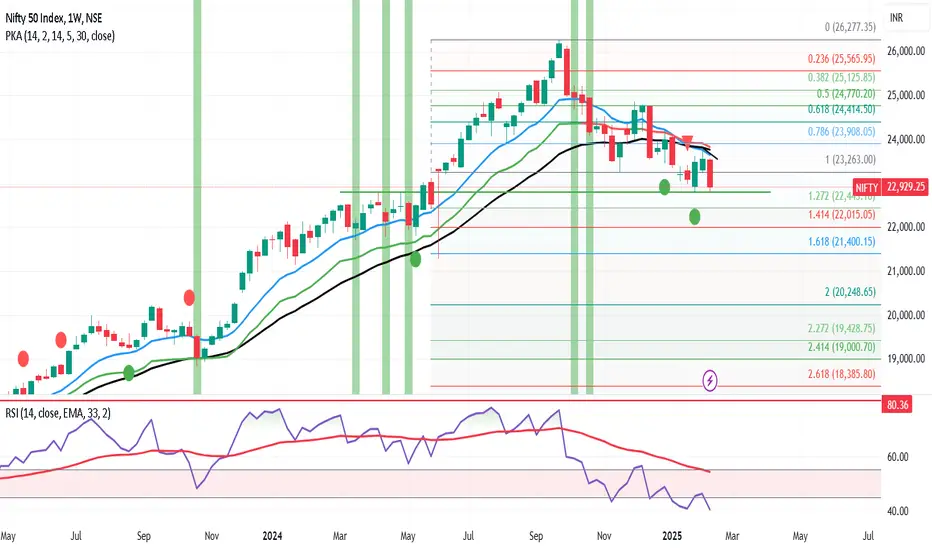
Market Update: Nifty Faces Bearish Pressure, 17-21st feb
Nifty closed at 22,929 this week, marking a decline of 630 points from the previous week's close. The index reached a high of 23,568 and a low of 22,774. As highlighted in my previous post, the bearish sentiment in Nifty remains intact, as both the monthly and weekly timeframes show negative trends. Until there is a significant reversal on these timeframes, the bearish outlook is expected to continue.
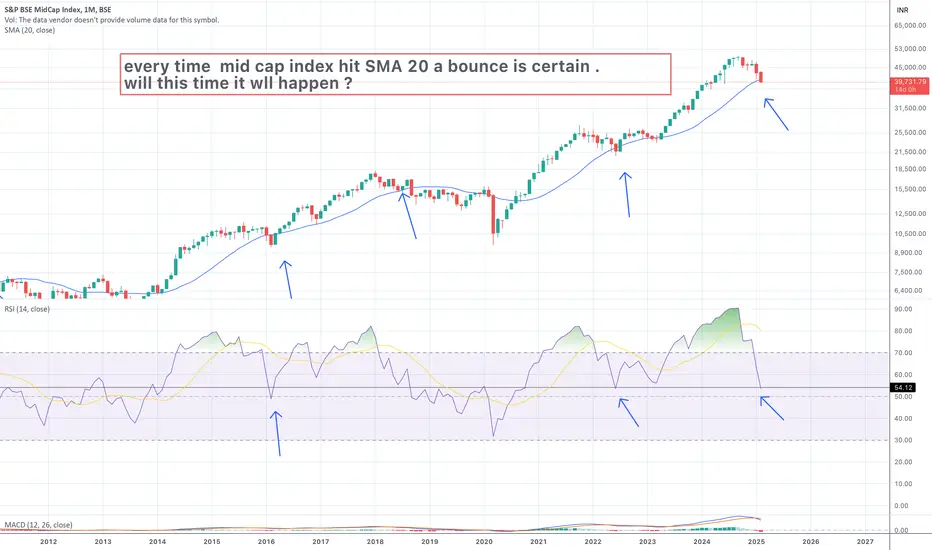
Looking ahead to next week, I anticipate Nifty will move within a range of 23,450 to 22,400 . The 22,300/22,400 zone offers strong support, and if this level is breached, we could see Nifty heading towards the 21,800 levels. Given this volatility, Nifty might not be the ideal index for small investors, particularly those heavily invested in mid and small-cap stocks. Let’s now take a closer look at the mid-cap and small-cap indices.
The Mid-Cap Index is currently near its key support level of 48,700 on the monthly chart. If it manages to hold this support next week, a potential reversal could follow, offering some relief to investors. On the other hand, the Small-Cap Index is still far from its crucial support of 14,500, which suggests that we could witness further downside of 4-5% in this segment . This could add more pressure on small-cap stocks, which are already facing a tough environment.
On a global front, the S&P 500 has finally broken through the strong resistance at 6,100 and closed above this level. If it manages to sustain above 6,100, we could see it reach 6,225 or even 6,376. This could potentially provide some tailwinds for the Indian markets, but for now, it seems that the Indian market remains under the tight grip of bearish forces.
In conclusion, while there are some signs of potential recovery in specific indices, the overall sentiment remains cautious. Investors should stay vigilant, especially in mid and small-cap segments, as the road ahead could be bumpy.
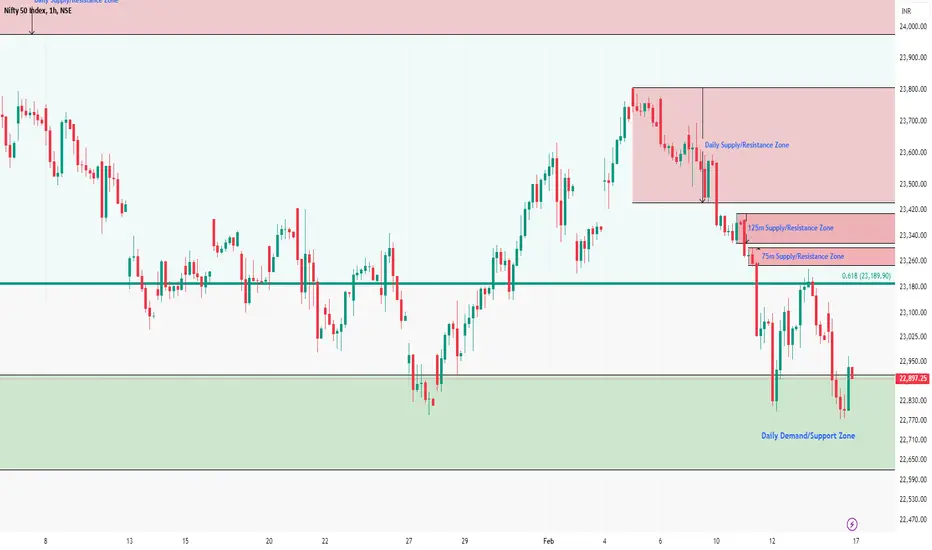
Nifty Intraday Support & Resistance Levels for 17.02.2025Friday’s session saw Nifty opening with a gap-up, but it failed to sustain the momentum. After hitting a high of 23,133.70, it reversed sharply, making a low of 22,774.85, testing the Daily Demand Zone (22,642.60 - 22,910.15) for the third time. A partial recovery followed, but Nifty still closed at 22,929.25, losing 102 points from the previous close. The Weekly Trend (50 SMA) and Daily Trend (50 SMA) remain sideways, signaling indecision.
Demand/Support Zones
Near Demand/Support Zone (Daily): 22,642.60 - 22,910.15 (Tested multiple times)
Far Support Level: 21,281.45 (Low of 4th June 2024)
Far Demand/Support Zone (Daily): 20,769.50 - 20,950
Supply/Resistance Zones
Near Supply/Resistance Zone (75m): 23,248.45 - 23,301.75
Near Supply/Resistance Zone (125m): 23,316.30 - 23,409.65
Near Supply/Resistance Zone (Daily): 23,443.20 - 23,807.30
Far Supply/Resistance Zone (Daily): 23,976 - 24,196.45
Far Supply/Resistance Zone (Weekly): 24,180.80 - 24,792.30
Outlook
Nifty’s repeated tests of the daily demand zone suggest that buyers are still active, but a break below 22,640 - 22,600 could trigger further downside toward 21,281. On the upside, a move above 23,250 - 23,300 could open the door for a push toward 23,800 - 24,000.
Nifty did well to hold on to crucial support. Can it hold ?Nifty did well today to bounce back from the lows of the day at 22774 to close at 22929. Holding this support is key. Under the pressure of relentless selling the market is in bear grip as of now. This is a good time to identify long term investment opportunities. Gaining immediate profits and fast recovery looks little difficult as of now. (You can not be 100% sure about the tops and bottoms of the market.) Next few months will give ample opportunities to average/add on bounce only. Mother father line supports and Resistances are the key to any investment during the bear phase of market. Patience of investors will be tested in the coming few weeks and months. Reshuffling your portfolios in favour of Fundamentally strong stocks that are going or still above 50 and 200 weeks EMA or Mother father line will be key. This is a stock pickers market. The forth that had build up post COVID rally is being cleared. Corrections are healthy sign for long term investors. Stock market is a place where money is transferred from the impatient to the patient. Pain will remain in the market for a short to medium term but hopefully great time and great rally awaits us in medium to long term. This next few weeks and probably months will test the new investors. Those who have seen a few Bull and Bear cycles know that good times do return eventually on the browsers.
Nifty Supports remain at: 22758, 22159, 21810 and finally 21302.
Nifty Resistances remain at: 23128, 23259 and 23435. Major hurdles for Bulls remain near Mother line at 23554 and Father line 23594. After a closing above 23838 only Bulls can be back into the game.
Disclaimer: The above information is provided for educational purpose, analysis and paper trading only. Please don't treat this as a buy or sell recommendation for the stock or index. The Techno-Funda analysis is based on data that is more than 3 months old. Supports and Resistances are determined by historic past peaks and Valley in the chart. Many other indicators and patterns like EMA, RSI, MACD, Volumes, Fibonacci, parallel channel etc. use historic data. There is no guarantee they will work in future as markets are highly volatile and swings in prices are also due to macro and micro factors based on actions taken by the company as well as region and global events. Equity investment is subject to risks. I or my clients or family members might have positions in the stocks that we mention in our educational posts. We will not be responsible for any Profit or loss that may occur due to any financial decision taken based on any data provided in this message. Do consult your investment advisor before taking any financial decisions. Stop losses should be an important part of any investment in equity.

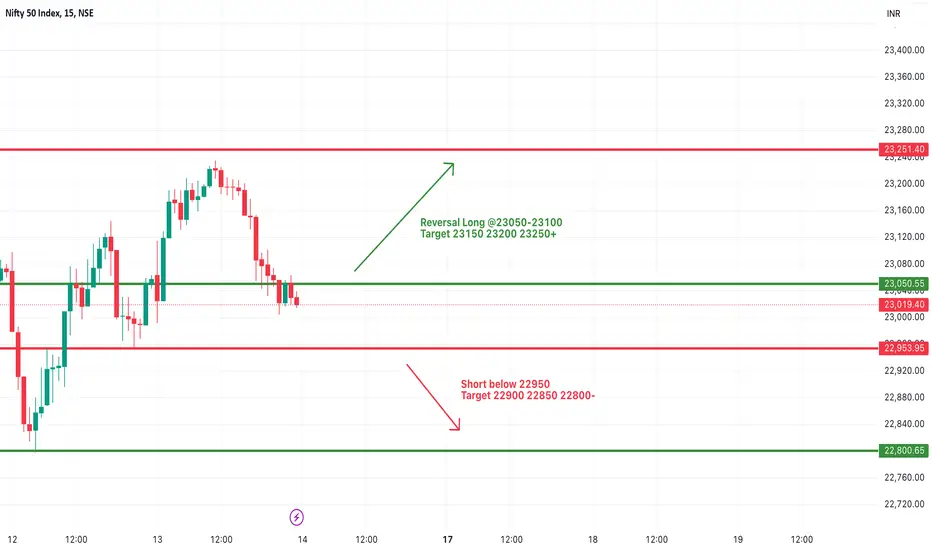
Nifty 14th FEB 2025 – Key Support & Resistance ZonesNifty Analysis – Key Support & Resistance Zones
🔹 Support Zones (Green):
22,935 - 22,926: Strong support area where buyers may step in. A break below this level could lead to further downside.
🔹 Resistance Zones (Red):
23,296 - 23,317: First major resistance zone.
23,382 - 23,400: Another key resistance area.
23,440 - 23,479: Strong resistance—breakout above this could signal bullish momentum.
📊 Current Trend:
✅ Trading Plan:
Bullish Scenario: Watch for a breakout above 23,153 for a potential move toward 23,296+.
Bearish Scenario: A breakdown below 23,019 could push the price toward 22,935 - 22,926.
📢 Keep an eye on price action near these levels and manage risk accordingly!

#NIFTY Intraday Support and Resistance Levels - 14/02/2025Gap up opening expected in nifty. After opening possible nifty will trade in between range of 23050 to 23250 in today's session. Any major and further downside only expected if nifty starts trading below the 22950 level. Upside 23250 will act as a strong resistance for nifty. Any strong bullish rally possible if nifty gives breakout of this resistance level.
NIFTY : Trading levels and Plan for 14-FEB-2025🔹 Key Levels:
📌 Resistance Zones:
🔴 Last Intraday Resistance: 23,262 – 23,306
🔴 Opening Resistance: 23,119 – 23,185
📌 Support Zones:
🟢 Opening Support/Resistance: 23,015 – 23,019
🟢 Buyer’s Support at Golden Retracement: 22,922 – 22,880
🟢 Stronger Buyer’s Support for Sideways/Consolidation: 22,677 – 22,742
📌 EMA: Price is reacting to the moving average, which could act as dynamic support/resistance.
📊 1️⃣ Gap-Up Opening (100+ points above previous close)
If NIFTY opens above 23,185:
Watch for rejection at 23,262 – 23,306: If price struggles, consider a short trade with SL above 23,320. Target: 23,185 – 23,100.
Sustained breakout of 23,306? Expect bullish momentum. Enter on a retest for targets 23,350 – 23,400.
Avoid impulsive longs at open: Wait for price to consolidate before entering trades.
💡 Pro Tip: If price rejects 23,262, sellers might step in aggressively. Consider buying Put options cautiously.
📊 2️⃣ Flat Opening (±50 points from previous close)
If NIFTY opens near 23,000 - 23,100:
Opening Support/Resistance Zone (23,015 – 23,019): This level will decide the market direction.
Break above 23,100? Expect bullish movement to 23,185. Go long above 23,105 with SL at 23,050.
Break below 23,015? Expect downside movement toward 22,922. Short below 23,010 with SL at 23,050.
💡 Pro Tip: In a flat opening, let price settle before making a decision. Patience pays!
📊 3️⃣ Gap-Down Opening (100+ points below previous close)
If NIFTY opens near 22,880 or below:
22,880 – 22,922 is a retracement support: If price holds, expect a bounce back. Go long above 22,900 with SL at 22,850.
Break below 22,880? Next major support is 22,677 – 22,742. Short below 22,870 with SL at 22,950.
If price reaches 22,677 and holds, expect a bounce. Look for buying opportunities around this level.
💡 Pro Tip: In a gap-down, avoid panic trades. Wait for proper confirmation before entering.
⚠️ Risk Management Tips for Options Trading
📌 Never chase a trade. Let price confirm the level before entering.
📌 Use stop-losses strictly. Protect your capital at all times.
📌 Avoid trading in the No Trade Zone. This is where stop-losses get hunted easily.
📌 Monitor IV (Implied Volatility). If IV is high, options premiums might be inflated. Consider spreads instead of naked options.
🔥 Summary & Conclusion
✅ Key Resistance: 23,119 – 23,185 / 23,262 – 23,306
✅ Key Support: 23,015 – 23,019 / 22,922 – 22,880 / 22,677 – 22,742
✅ Gap-Up: Watch resistance at 23,262. Breakout = bullish, rejection = short.
✅ Flat Opening: Wait for breakout/breakdown from Opening Support before entering.
✅ Gap-Down: 22,880 is crucial. Holding = bounce, breakdown = more downside.
🎯 Stick to the plan, follow discipline, and manage your risks!
⚠ Disclaimer: I am NOT a SEBI-registered analyst. This analysis is for educational purposes only. Trade at your own risk.

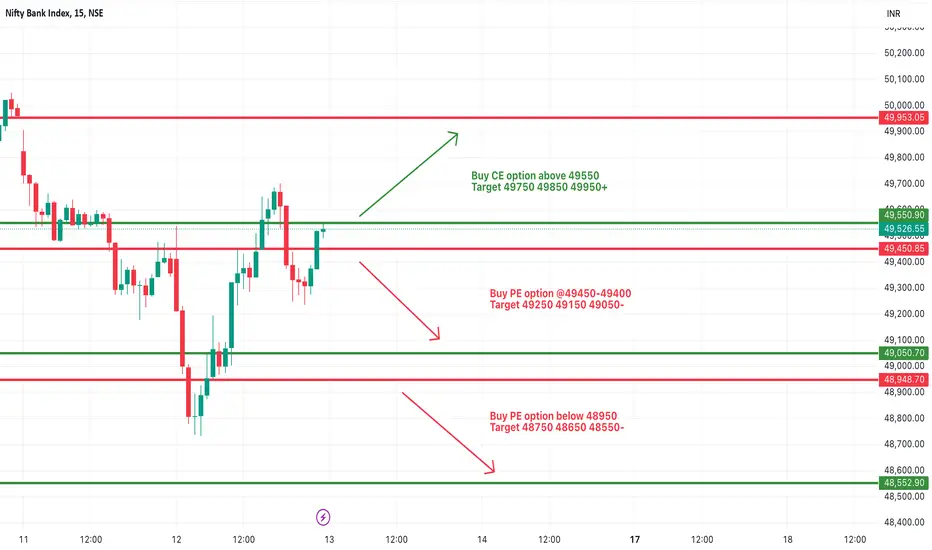
[INTRADAY] #BANKNIFTY PE & CE Levels(13/02/2025)Today will be slightly gap up opening expected in banknifty. Any bullish rally only expected if banknifty starts trading and sustain above 49550 level. Further downside expected below the 49450 level. This downside can goes upto 49050 and extend next 400-500+ points in case starts trading below 48950 level.
#NIFTY Intraday Support and Resistance Levels - 13/02/2025Today will be flat or slightly gap up opening expected in nifty. After opening if nifty sustain above 23050 level then only expected upside rally upto the 23250 level. This level will act as a strong upside resistance for today's session. Any bullish rally can give reversal from this level. Below 23000 level sharp downside expected in today's session.

NIFTY 13th Feb 2025 Above the yellow zone → Bullish momentum is likely, meaning the price may rise toward the red resistance zones.
Below the yellow zone → Bears might take control, pushing the price toward the green support zones.
Green zones → Strong support levels, where price could bounce.
Red zones → Resistance levels, where price might face selling pressure.

NIFTY : Trading Levels and Plan for 13-Feb-2025
🔹 Key Levels:
📌 Resistance: 23,205 / 23,298 – 23,332 (Last Intraday Resistance)
📌 Support: 22,970 / 22,873 – 22,893 / 22,660 / 22,508
📌 No Trade Zone: 23,049 - 23,103 (Avoid trading inside this range)
📊 1️⃣ Gap-Up Opening (100+ points above previous close)
If NIFTY opens above 23,205:
Watch for rejection at 23,298 – 23,332: If price struggles, consider a short trade with SL above 23,350. Target: 23,205 – 23,100.
Sustained breakout of 23,332? Expect bullish momentum. Enter on a retest for targets 23,400 – 23,450.
Avoid impulsive longs at open: Wait for price to consolidate before entering trades.
💡 Pro Tip: If price rejects 23,298, sellers might step in aggressively. Consider buying Put options cautiously.
📊 2️⃣ Flat Opening (±50 points from previous close)
If NIFTY opens near 23,000 - 23,100:
No Trade Zone (23,049 - 23,103): Avoid trading here. Wait for price to break out clearly.
Break above 23,103? Expect bullish movement to 23,205. Go long above 23,105 with SL at 23,050.
Break below 23,049? Expect downside movement toward 22,970. Short below 23,045 with SL at 23,100.
💡 Pro Tip: In a flat opening, let price settle before making a decision. Patience pays!
📊 3️⃣ Gap-Down Opening (100+ points below previous close)
If NIFTY opens near 22,873 or below:
22,873 as support? If price holds, expect a bounce back. Go long above 22,900 with SL at 22,850.
Break below 22,873? Next major support is 22,660. Short below 22,870 with SL at 22,950.
If price reaches 22,660 and holds, expect a bounce. Look for buying opportunities around this level.
💡 Pro Tip: In a gap-down, avoid panic trades. Wait for proper confirmation before entering.
⚠️ Risk Management Tips for Options Trading
📌 Never chase a trade. Let price confirm the level before entering.
📌 Use stop-losses strictly. Protect your capital at all times.
📌 Avoid trading in the No Trade Zone. This is where stop-losses get hunted easily.
📌 Monitor IV (Implied Volatility). If IV is high, options premiums might be inflated. Consider spreads instead of naked options.
🔥 Summary & Conclusion
✅ Key Resistance: 23,205 / 23,298 – 23,332
✅ Key Support: 22,970 / 22,873 – 22,893 / 22,660 / 22,508
✅ No Trade Zone: 23,049 - 23,103
✅ Gap-Up: Watch resistance at 23,298. Breakout = bullish, rejection = short.
✅ Flat Opening: Wait for breakout/breakdown from No Trade Zone before entering.
✅ Gap-Down: 22,873 is crucial. Holding = bounce, breakdown = more downside.
🎯 Stick to the plan, follow discipline, and manage your risks!
⚠ Disclaimer: I am NOT a SEBI-registered analyst. This analysis is for educational purposes only. Trade at your own risk.
