BANKNIFTY : Trading levels and Plan for 13-Jan-2025Bank Nifty Trading Plan for 13-Jan-2025
Key Levels to Watch:
🔹 Last Intraday Resistance: 49,596 – 49,666
🔹 Opening Resistance Zone: 49,164 – 49,270
🔹 Opening Support/Resistance: 48,802
🔹 Support Zone on Day Chart: 48,484
🔹 Major Support Level: 47,788
Gap-Up Opening (+200 Points Above)
If Bank Nifty opens above 49,270:
📈 Plan for Long Trades:
Look for bullish momentum towards the Last Intraday Resistance Zone (49,596 – 49,666).
A breakout above 49,666 with strong volume can push prices toward 49,800 or higher.
Enter long trades only after confirmation with a strong bullish candle.
Stop Loss: Below 49,270 for a favorable risk-reward ratio.
📉 Rejection Scenario:
If the price fails to hold above 49,666, book profits on long trades and wait for a pullback near the Opening Resistance Zone (49,164 – 49,270) for re-entry.
💡 Tip: Hedge gap-up trades with put options to manage volatility.
Flat Opening (±50 Points Around 48,779)
If Bank Nifty opens near 48,779:
⚠️ Wait for Directional Clarity:
Avoid entering trades immediately. Let the price action define the trend between 48,484 (Support) and 49,270 (Resistance).
🟢 Bullish Breakout Plan:
A breakout above 49,270 may lead to a rally toward 49,596 – 49,666.
Go long only after a retest of the breakout level with a stop loss below 48,802.
🔴 Bearish Breakdown Plan:
If the price breaks below 48,484, it could slide toward 47,788.
Consider shorting only if strong selling pressure is observed. Keep a stop loss above 48,802.
💡 Tip: Avoid overtrading in flat openings. Wait for the first 30 minutes to confirm the trend.
Gap-Down Opening (-200 Points Below)
If Bank Nifty opens below 48,484:
🔻 Reversal Plan:
Look for buying opportunities near 47,788 (Major Support).
If a bullish reversal is confirmed, go long with a target toward 49,164 – 49,270.
🚨 Breakdown Scenario:
If the price breaks below 47,788, expect further downside.
Avoid catching a falling knife—wait for consolidation before considering long trades.
💡 Tip: Use ATM or ITM options to benefit from intraday volatility in a gap-down scenario.
Summary:
For a Gap-Up Opening , focus on a breakout above 49,666 but be cautious around key resistance levels.
For a Flat Opening , wait for a decisive breakout or breakdown from the range 48,484 – 49,270.
For a Gap-Down Opening , 47,788 will act as a critical support zone. Look for reversal opportunities or breakdown trades.
💡 Risk Management Tip: Avoid over-leveraging, and consider straddle/strangle strategies to capture volatile moves.
Disclaimer:
I am not a SEBI-registered analyst. This trading plan is for educational purposes only. Please consult a certified financial advisor before making trading decisions. Trade wisely! 💼
Niftytrend

NIFTY : Trading Plan and Important levels for 13-Jan-2025Key Levels to Watch:
Profit Booking Zone: 23,775 – 23,830
Last Intraday Resistance: 23,663
Opening Resistance: 23,588 – 23,613
No Trading Zone: 23,437 – 23,470
Opening Support: 23,339
Initial Support: 23,250
Buyer's Support Zone: 23,057 – 23,094
Gap Up Opening (100+ Points Above)
If Nifty opens above 23,613:
Monitor price action near the 23,663 resistance zone. A breakout with strong volume above this level can lead to a rally towards the Profit Booking Zone at 23,775–23,830. Consider initiating long positions if confirmation occurs.
If the price struggles near 23,663, wait for a rejection pattern and evaluate for potential pullback trades back to the Opening Resistance zone (23,588–23,613).
💡 Risk Management Tip: When trading gap-ups, avoid entering impulsively. Let the price settle for the first 15 minutes. Use tight stop losses for trades near resistance zones.
Flat Opening (±50 Points Around 23,437)
If Nifty opens within the No Trading Zone (23,437–23,470):
Stay cautious and avoid taking trades until the price breaks out of this consolidation range.
A breakout above 23,470 with strength can lead to a move toward the Opening Resistance zone (23,588–23,613). Enter long positions only after a successful retest of this breakout.
A breakdown below 23,437 could push the price toward Opening Support (23,339). Short positions can be initiated after confirmation.
💡 Risk Management Tip: Avoid overtrading in no-trade zones. Patience is key to spotting high-probability setups.
Gap Down Opening (100+ Points Below)
If Nifty opens below 23,339:
Watch for buying opportunities in the Initial Support zone (23,250). If the price forms a bullish reversal pattern, consider entering long trades targeting the Opening Resistance zone (23,588–23,613).
If selling pressure persists and Nifty moves toward the Buyer's Support Zone (23,057–23,094), this zone becomes crucial for long trades with tight stop losses.
A breach of 23,057 with strong volume can lead to further downside. Avoid long trades until support is regained.
💡 Risk Management Tip: In gap-down scenarios, avoid catching falling knives. Use smaller lot sizes and wait for strong reversal signals before entering trades.
Summary & Conclusion
For a gap up, focus on levels above 23,613 and monitor the resistance zones carefully for breakouts or rejections.
For a flat opening, wait for a breakout or breakdown from the No Trading Zone (23,437–23,470) to avoid false moves.
For a gap down, be patient around Initial Support (23,250) or Buyer's Support Zone (23,057–23,094) for reversal trades.
💡 Options Trading Tip: Use OTM strikes near key levels for intraday trades. Always hedge your positions, especially in volatile conditions.
Disclaimer:
I am not a SEBI-registered analyst. This plan is for educational purposes only. Please consult with your financial advisor before taking any trades. Trade responsibly!

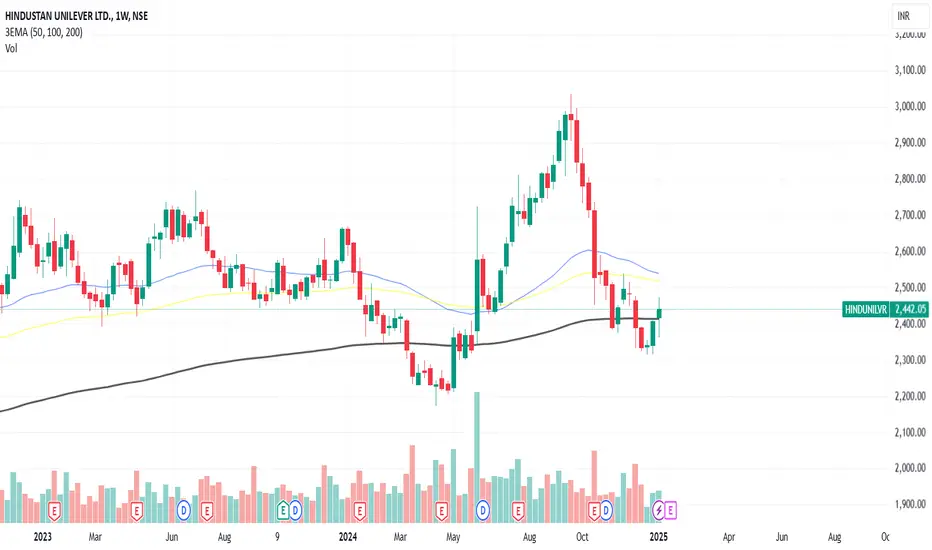
Long in HINDUNILVR HINDUNILVR is on the 200EMA support and it's a high possibility for 2550 first target.
#Nifty50 What Lies Ahead for Nifty & S&p500,13-17th Jan 2025The Nifty Index experienced a sharp decline this week, closing at 23,431, a significant 570 points below the previous week's close. While the index reached a high of 24,089, it ultimately succumbed to selling pressure, finding support at 23,344. As forecasted, the Nifty traded within the predicted range of 24,500 to 23,300. For the upcoming week, I anticipate the index to remain confined within a range of 23,950 to 22,900 .
Given the prevailing bearish sentiment, a potential short-term bounce could unfold next week to lure in unsuspecting buyers before a renewed downward move. Historically, whenever the Nifty has breached the support of the 50-week Exponential Moving Average (WEMA50), it has typically undergone a 5-6% correction. Based on the current level of 23,431, the Nifty may find crucial support near the 22,200-22,400 zone.
Turning to the US markets, the S&P 500 found support at the 100-day Exponential Moving Average (DEMA100) level of 5,817 and closed at 5,827. The upcoming week will be pivotal. If the S&P 500 successfully defends the 5,807 low, a potential rally towards the 5,926-5,944 range could materialize. However, a weekly close below the 5,800 mark would signal a significant bearish turn for global markets, potentially triggering a deeper correction towards the 5,637 or even 5,504 levels.
Wishing readers a very happy Lohri and Makar Sakranti.

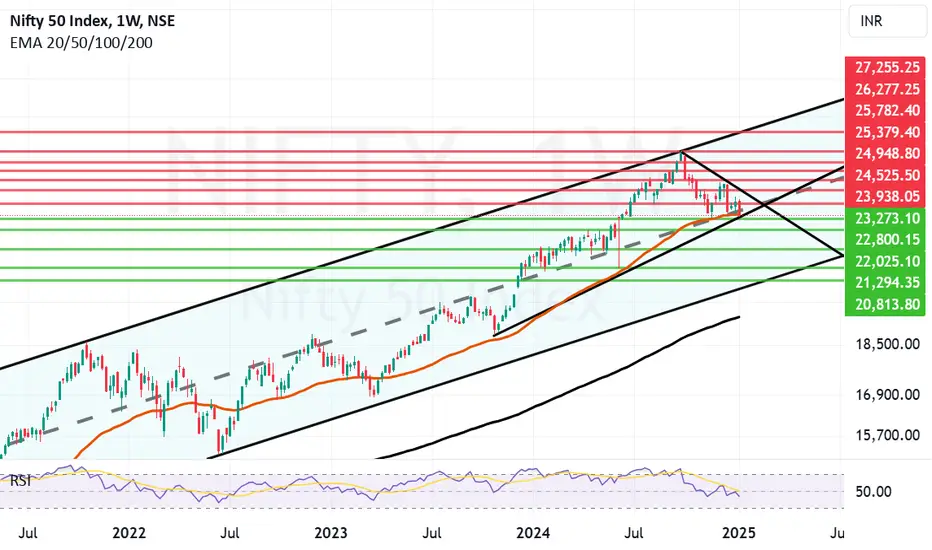
Nifty looking weak after closing below Mid-channel. Nifty looking very weak after closing below Mid-channel support and 50 weeks EMA Mother line support. Mother line support or the 50 Week EMA was at 23442 and the closing we got is at 23431. If Nifty does not recover quickly and claims the Mid-Channel and 50 Weeks EMA, we might be in for more fall with supports at 23273, 22800 (Major Support Zone). If we get a weekly closing below 22800 we will fall totally into bear territory. In such a scenario bears can drag Nifty further down to 22025, 21294 or even near channel bottom of 20813. 20813 will again be a major Parallel chanel bottom support. Resistances on the upper side will be at 23442, 23938, 24525 and 24948 before we can reclaime 25K levels. Later in the year when we get a closing above 25K levels we may again face the 25782, 26277 previous Nifty peak will be major resistances. Nifty channel top post recovery seems to be at 27255. We may reach there in hopefully by mid or end H2 2025. Value Investors can start looking out for bottom fishing and value buying opportunities specially in the Large and selective mid and small caps.
Disclaimer: The above information is provided for educational purpose, analysis and paper trading only. Please don't treat this as a buy or sell recommendation for the stock or index. We do not guarantee any success in highly volatile market or otherwise. Stock market investment is subject to market risks which include global and regional risks. I or my clients might have positions in the stocks that we mention in our posts. We will not be responsible for any Profit or loss that may occur due to any financial decision taken based on any data provided in this message. Do consult your investment advisor before taking any financial decisions. Stop losses should be an important part of any investment in equity.
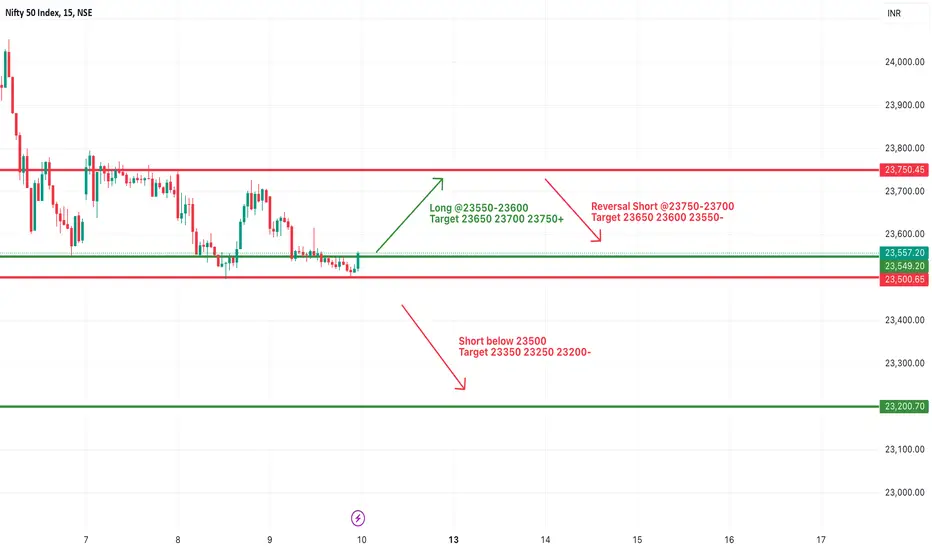
#NIFTY Intraday Support and Resistance Levels - 10/01/2025Today will be flat opening expected in nifty. After opening important level for nifty is 23500 level. In case nifty starts trading below this level then expected strong downside movement in index. Above this level expected nifty will consolidate in between range of 23550-23750 levels. Below 23500 level next support for nifty will be 23200 so 250-300+ points rally expected below this level.
NIFTY : Trading Plan and Levels for 10-Jan-2025
Introduction:
Nifty has been consolidating within a defined range, with 23,622 acting as immediate resistance and 23,490 providing opening support. The "No Trade Zone" marked around 23,557-23,622 highlights areas of indecision where price movement lacks clarity. This trading plan evaluates different opening scenarios, including gap-up, flat, and gap-down openings, considering a gap of 100+ points.
Scenarios for 10-Jan-2025:
Gap Up Opening (100+ Points Above 23,622):
If Nifty opens above 23,622:
Monitor Retest of 23,622: A retest and hold of this level can be a potential opportunity to go long, with the first target at 23,787 and a stretch target at 23,843. Place a stop loss below 23,600 to protect capital.
Failure to Hold 23,622: If the price fails to sustain above 23,622, expect a correction toward 23,557. Wait for a reversal signal before taking any fresh positions.
Options Trading Tip: For a gap-up opening, consider buying call options close to the money if 23,622 holds as support. Avoid buying options with low liquidity.
Flat Opening (Near 23,557):
If Nifty opens near 23,557:
Focus on Breakout or Breakdown: Let the price action settle for the first 30 minutes. A breakout above 23,622 offers a long opportunity, with targets at 23,787-23,843.
Break Below 23,490: A breach of 23,490 could lead to a bearish move toward 23,364. Avoid long positions unless there’s a recovery signal around 23,490.
Risk Management Tip: Use proper position sizing. Avoid risking more than 2% of your capital on any single trade.
Gap Down Opening (100+ Points Below 23,490):
If Nifty opens below 23,490:
Watch for Reversal at 23,364: This support zone may attract buyers. Look for bullish reversal patterns to go long, targeting 23,490.
Break Below 23,364: A breach below 23,364 could lead to a significant downside toward 23,251. Aggressive short positions can be taken only after confirmation with a stop loss above 23,364.
Options Trading Tip: For a bearish gap-down, consider buying put options near resistance levels or selling call spreads for a safer risk-reward ratio.
Summary and Conclusion:
Nifty’s price action around 23,622 and 23,490 will determine the market’s trend for the day. Avoid trading within the "No Trade Zone" (23,557-23,622) unless a clear breakout or breakdown is visible. Risk management is key, especially in volatile conditions. Always use stop losses and stick to your trading plan.
Disclaimer:
I am not a SEBI-registered analyst. This trading plan is for educational purposes only. Please consult your financial advisor before taking any trades. Trade responsibly.

Bearish or Bounce Ahead?
Here’s my detailed analysis and outlook for Nifty based on daily and weekly charts:
Daily Chart Insights
Trend:
Nifty is in a clear downtrend with lower highs and lows since breaking 24,000.
Currently consolidating near 23,500, which acts as a critical support zone.
Volume Profile:
High selling volume on down days shows persistent institutional pressure.
Buyers are defending 23,500, but no strong confirmation of reversal yet.
Key Levels:
Resistance:
23,800-23,850: Immediate resistance with heavy Call OI.
24,050: Higher timeframe resistance.
Support:
23,500: Immediate support.
23,400-23,350: Breach could lead to more downside.
Indicators:
RSI: Near oversold (~40), but no bullish divergence.
Moving Averages: Below 50-DMA and 200-DMA, confirming bearish momentum.
Weekly Chart Insights
Trend:
Downtrend continues, with Nifty failing to reclaim critical levels like 24,200.
Last week’s bearish candle shows sellers remain dominant.
Volume Profile:
Increased selling volume on red candles confirms institutional sell-off.
Buyers look weak below 23,500.
Key Levels:
Resistance:
24,000-24,200: Strong supply zone.
24,400: Major resistance for any upside rally.
Support:
23,400-23,350: Breakdown could lead to 23,000.
23,000: Psychological and historical support zone.
Indicators:
RSI: Around 35, nearing oversold territory but with downside room.
MACD: Bearish crossover confirms momentum on the downside.
Prediction for the Month
Bearish Case (High Probability):
Failure to reclaim 23,800 could continue the downtrend.
Breach of 23,500 may lead to:
Target 1: 23,350.
Target 2: 23,000.
Bullish Case (Low Probability):
Breakout above 23,800 could trigger a short-term rally:
Target 1: 24,050.
Target 2: 24,400.
Outlook:
The market remains moderately bearish for the next month unless strong buying emerges at 23,500 or a breakout above 23,800 occurs.
What’s your view? Let’s discuss!
Disclaimer: This is my personal analysis and not financial advice. Please trade responsibly.

Prospects of Further downside in Nifty hanging by the thread. Pretty bad closing by Nifty today which has further downside in Nifty hanging by the thread. As you can see we are near the bottom of the pennant structure. If the downside is broken by any chance possibility of further downside can not be ruled out. However if the support of today's low is maintained possibility of upside will open up. Silver lining in the cloud is DII being on buying side and RSI has take an upward turn with closing above yellow line.
The supports for Nifty now are at 23463 Bollinger lower band support, 23380 and 23365 (Final Support).
Resistances on the upper side for Nifty are at 23682 (Bollinger mid band), 23722 (Mother line resistance), 23787 (Bollinger upper band), 23889 and finally 23980 (Father line resistance). Above 23980 closing the door for further up side will open. With Medium term targets being at 24073, 24103, 24232, 24302 and finally 24401. Above 24401 closing Bulls can jump back to business.
Disclaimer: The above information is provided for educational purpose, analysis and paper trading only. Please don't treat this as a buy or sell recommendation for the stock or index. We do not guarantee any success in highly volatile market or otherwise. Stock market investment is subject to market risks which include global and regional risks. I or my clients might have positions in the stocks that we mention in our posts. We will not be responsible for any Profit or loss that may occur due to any financial decision taken based on any data provided in this message. Do consult your investment advisor before taking any financial decisions. Stop losses should be an important part of any investment in equity.

#NIFTY Intraday Support and Resistance Levels - 09/01/2025Flat opening expected in nifty. After opening expected downside rally from the resistance zone near 23750 level. This downside movement can goes upto 23550 level. Any bullish rally only expected if nifty starts trading and sustain above 23800 level. This bullish rally can goes upto 24050 level after the breakout. Downside below 23500 level sharp fall expected in nifty upto the 23200 level.

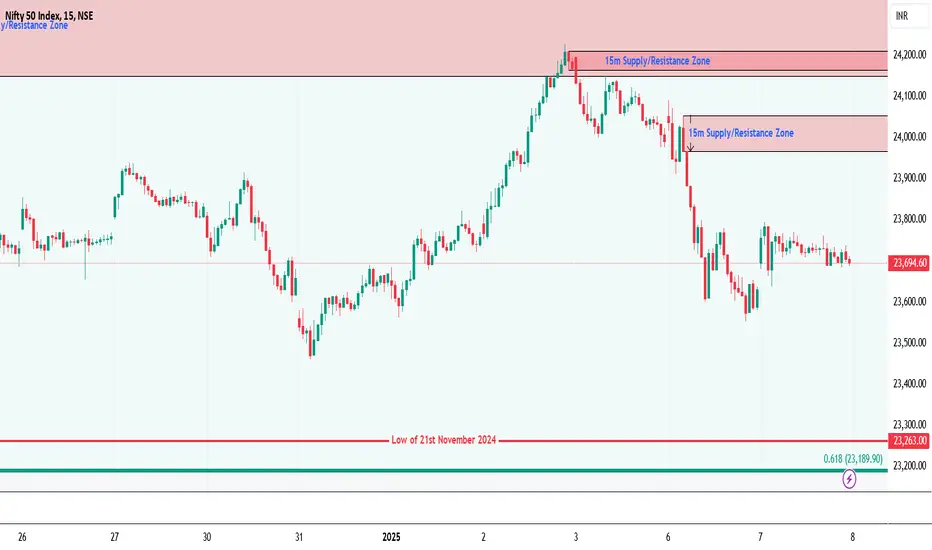
Nifty Intraday Support & Resistance Levels for 09.01.2025On Wednesday, Nifty opened with a gap-up and touched a high of 23,751.85. However, it couldn’t sustain the momentum and dropped to a low of 23,496.15. It managed to close at 23,688.95, losing a modest 19 points over the previous close. The Weekly and Daily Trends (50 SMA) remain sideways, reflecting indecision in the market.
Demand/Support Zones
Near Demand/Support Zone (30m): 23,496.15 - 23,559.20
Near Support Level: 23,263 (low of 21st November 2024)
Far Support Level: 23,189.88 (61.8% FIBO retracement)
Far Demand/Support Zone (Daily): 21,791.95 - 22,910.15
Supply/Resistance Zones
Near Supply/Resistance Zone (15m): 23,966.95 - 24,054.30
Near Supply/Resistance Zone (15m): 24,164.90 - 24,210.30
Far Supply/Resistance Zone (Daily): 24,149.85 - 24,394.45 (tested)
Far Supply/Resistance Zone (Weekly): 24,567.65 - 25,234.05 (tested)
Outlook
Despite a gap-up start, Nifty struggled to hold gains. Watch for a breakdown below the support at 23,189 for potential bearish action. On the upside, crossing 24,400 could signal recovery.

NIFTY : Trading levels and Plan for 09-Jan-2025Trading Plan for NIFTY - 9-Jan-2025
Intro - Plan vs. Actual for 8-Jan-2025
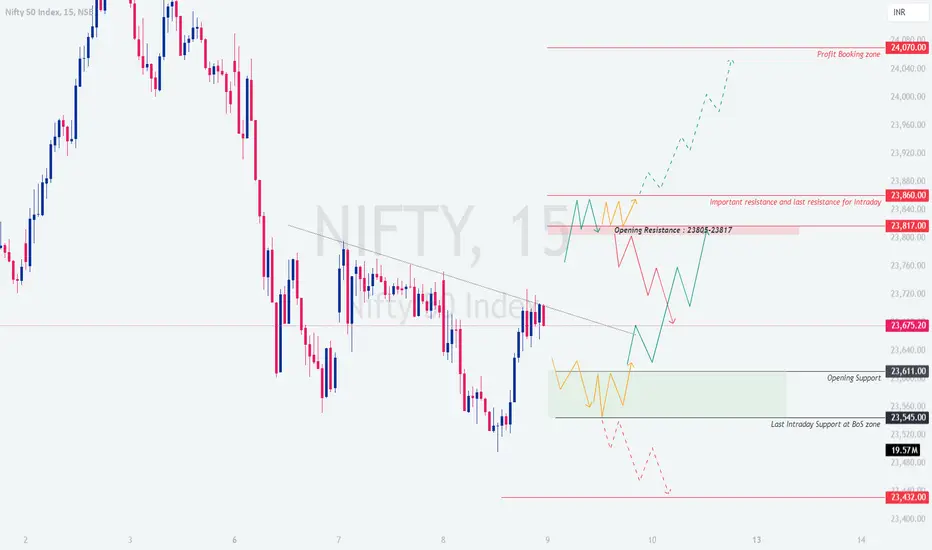
Yesterday's plan highlighted key levels, with 23,483 - 23518 acting as support and excalty from those level saw a smart recovery. and ended up at flat not. The yellow trend marked the sideways movement, while bearish momentum was evident in the red trend zone.
Today's chart builds upon the prior analysis, with updated levels and a strategy for all opening scenarios.
Trading Scenarios for 9-Jan-2025
Gap-Up Opening (Above 23,860)
If Nifty opens above 23,860 , monitor for rejection near the Profit Booking Zone (24,070) . Look for a bearish hourly candle close in this zone to consider selling opportunities, targeting 23,817 (opening resistance). If strength persists, expect a bullish breakout, targeting 24,150+ .
Action Plan: Wait for rejection candles in the profit booking zone for a potential short. For bullish trades, buy only on sustained breaks above 24,070 .
Risk Management: Use 23,950 as a stop-loss for shorts and 23,860 for longs, based on hourly closes.
Flat Opening (Between 23,611-23,817)
A flat opening around the 23,675 zone requires caution. Watch for price action at 23,817 . A failure to break this resistance could lead to bearish moves, targeting 23,611 and 23,545 . Conversely, a breakout above 23,817 may turn bullish, with upside potential toward 23,860 .
Action Plan: Wait for price confirmation near 23,817 . Use stop-losses 20-30 points above or below breakout/rejection levels.
Risk Management: Trade with minimal risk exposure during the opening 30 minutes to let the trend settle.
Gap-Down Opening (Below 23,545)
In case of a gap-down, observe the 23,545 level for signs of support. Failure to hold may lead Nifty toward the Last Intraday Support Zone (23,432) . Bulls may defend this zone aggressively, offering a potential buying opportunity.
Action Plan: Look for long opportunities only near 23,432 , with targets back toward 23,545-23,611 . If selling persists, avoid aggressive longs below 23,432 .
Risk Management: Use 23,400 as a strict stop-loss for longs in the gap-down scenario.
Tips for Options Trading
Focus on weekly ATM options to minimize premium decay.
Avoid holding positions during volatile periods unless you have a strict exit strategy.
Use spreads to hedge directional trades, especially in uncertain market conditions.
Summary and Conclusion
The market's reaction to the key levels will determine the trend.
Respect the zones: 23,817 as resistance and 23,611 as support.
Patience during the opening 30 minutes can lead to better trade entries.
Yellow indicates sideways, green indicates bullish, and red indicates bearish trends.
Disclaimer : This analysis is for educational purposes only. I am not a SEBI-registered analyst. Please consult your financial advisor before trading.
Parallel Channel hourly candles suggests Nifty is delicate zone.Parallel Channel of Nifty suggest that we are in delicate zone with shadow of the candle being positive. Nifty has thrice taken support on the channel bottom as you can see in the chart. A strong support zone for Nifty is seeing strong buying emerging near the channel bottom. This strong support zone is between 23509 and 23263.
The Three important resistances however are not allowing Nifty to grow further. These 3 resistance are:
1) Mother line resistance near 23775.
2) Father and trend line combine resistance near 24010.
3) Third important resistance for Nifty to conquer will be near 24288 which is the mid channel resistance.
When we will get a closing above 24288 the Bull can breath a little easy and try and push Nifty upwards towards 24510, 24779 or even above 25K.
The zone between 25033 and 25200 will again be a tough zone to conquer as the Nifty will again hit the top of the parallel channel.
Conclusion: All is good till we do not get a closing below 23K levels. Below 23K levels weekly closing Bears will have position to overpower the market and drag Nifty further down. For long term investors this is good opportunity to invest big go long and hold on.
Today ONGC, Reliance, ITC, Asian Paints, Dr Reddy, Wipro and TCS are the few large cap stocks which saw buying.
The laggards for Nifty today were Apollo Hospitals, Trent, Shriram Finance, Bajaj Auto, ultratech and few other Large cap stocks.
Disclaimer: The above information is provided for educational purpose, analysis and paper trading only. Please don't treat this as a buy or sell recommendation for the stock or index. We do not guarantee any success in highly volatile market or otherwise. Stock market investment is subject to market risks which include global and regional risks. I or my clients might have positions in the stocks that we mention in our posts. We will not be responsible for any Profit or loss that may occur due to any financial decision taken based on any data provided in this message. Do consult your investment advisor before taking any financial decisions. Stop losses should be an important part of any investment in equity.

#NIFTY Intraday Support and Resistance Levels - 08/01/2025Flat opening expected in nifty near the 23750 level. No major changes in yesterday's levels due to the consolidation movement. Expected downside movement if nifty trading below 23750 level this downside movement can goes upto 23550 level. Any major upside rally only expected above the 23800 level.

Nifty Intraday Support & Resistance Levels for 08.01.2025On Tuesday, Nifty opened with a gap-up but traded within a narrow range, touching a high of 23,795.50 and a low of 23,637.80. The index ended the session at 23,707.90, gaining 92 points over the previous close. Both, the Weekly and Daily Trends (50 SMA) remain sideways, indicating a lack of strong directional momentum.
Demand/Support Zones
Near Support Level: 23,263 (Low of 21st November 2024)
Far Support Level: 23,189.88 (61.8% FIBO retracement)
Far Demand/Support Zone (Daily): 21,791.95 - 22,910.15
Supply/Resistance Zones
Near Supply/Resistance Zone (15m): 23,966.95 - 24,054.30
Near Supply/Resistance Zone (15m): 24,164.90 - 24,210.30
Far Supply/Resistance Zone (Daily): 24,149.85 - 24,394.45 (tested)
Far Supply/Resistance Zone (Weekly): 24,567.65 - 25,234.05 (tested)
Outlook
After recent volatility, the Nifty appears to be consolidating within a narrow range. A break above the 24,400 resistance could trigger further upside, while support at 22,900 - 23,200 remains critical for bulls to defend. Watch these levels for potential breakout or breakdown opportunities.
Nifty's Key Levels & Trade Plan for 08/01/25
Hi Guys,
Here’s the breakdown of my Nifty analysis for today:
Resistance Levels:
23,800: Immediate resistance.
23,880: Strong selling zone; breakout could lead to 24,050.
Support Levels:
23,600: Key support with high Put OI.
23,500: Psychological level; a breakdown could take us to 23,400.
My Trade Plan:
Buy Above 23,810:
Target 1: 23,880
Target 2: 24,050
Stop-Loss: 23,780
Sell Below 23,590:
Target 1: 23,500
Target 2: 23,400
Stop-Loss: 23,620
View:
The market looks range-bound between 23,600 and 23,800 unless we see a breakout or breakdown with strong volume. Stay cautious of false moves!
Disclaimer:
This is purely my personal analysis and not financial advice. Please trade based on your own research and risk management.
What’s your view on today’s price action? Let’s discuss!

NIFTY : Trading levels and Plan for 08-JAN-2025Nifty Trading Plan for 08-Jan-2025
Intro: Review of 07-Jan-2025 Plan
Yesterday's trading plan accurately highlighted the Opening Resistance Zone (23,849-23,888) , which acted as a cap for bullish momentum, and the Opening Support Zone (23,673-23,604) , which provided a bounce. The market respected these levels with a predominantly sideways movement (Yellow Trend). The Best Buying Zone (23,251-23,362) remained untouched, keeping the downside potential intact.
For 08-Jan-2025, we focus on three opening scenarios: Gap-Up, Flat, or Gap-Down, with actionable strategies and clear risk management guidelines.
Opening Scenarios:
Gap-Up Opening (100+ points above previous close):
If Nifty opens above 23,888 , the Opening Resistance Zone (23,849-23,888) will likely act as a critical area.
A breakout above 23,888 with volume could push Nifty toward the next resistance at 24,081 . Go long on confirmed breakout candles with small retracements.
A rejection near 23,888 could result in a pullback to test 23,673-23,604 . Wait for reversal confirmation before entering short positions.
less
Copy code
Risk Management Tip: Avoid aggressive CE buying after a large gap-up; instead, use intraday dip-buying strategies or spreads for better risk control.
Flat Opening (Near previous close):
A flat opening around 23,694 could lead to a range-bound session (Yellow Trend). This scenario requires patience and precise execution:
A bullish breakout above 23,849 could lead to upside momentum, targeting 23,888 and 24,081 .
On the downside, a breakdown below 23,604 could initiate bearish momentum, with targets at 23,483-23,518 .
vbnet
Copy code
Risk Management Tip: Use option straddle strategies to benefit from potential sideways movements. Avoid overtrading in choppy market conditions.
Gap-Down Opening (100+ points below previous close):
If Nifty opens below 23,604 , focus on the Opening Support Zone (23,483-23,518) for potential reversals.
A bounce from 23,483-23,518 can provide a buying opportunity, targeting 23,604 and above.
A breakdown below 23,483 may trigger a bearish trend (Red Trend) toward the Best Buying Zone (23,251-23,362) . Wait for proper confirmation before initiating short trades.
less
Copy code
Risk Management Tip: For gap-down scenarios, use PE options or bear put spreads with defined risks. Be cautious of sharp reversals after a gap-down.
Key Levels to Watch:
Support Zones: 23,673-23,604, 23,483-23,518, and 23,251-23,362.
Resistance Zones: 23,849-23,888 and 24,081.
Summary & Conclusion:
Nifty is trading within a structured range, offering clear opportunities for intraday trades based on levels. Stick to disciplined execution, and do not chase trades without confirmation. Use options strategies to manage risk and maximize returns in volatile conditions.
Disclaimer: I am not a SEBI-registered analyst. This analysis is for educational purposes only. Please consult your financial advisor before making any trading decisions.

#NIFTY Intraday Support and Resistance Levels - 07/01/2025Expected nifty will open gap up in today's session near 23800 level. After opening any bullish movement expected if it's starts trading and sustain above 23800 level. Below 23750 downside rally expected upto the 23550 and this rally expected for further 200-250+ points movements in case nifty gives breakdown of 23450 level. 23450-23550 in this range possible some consolidation movements in market.

NIFTY : Bearish Trend, but a Bounce Might Be Coming
NSE:NIFTY has been trending lower, with sellers clearly in control. However, it looks like the market is taking a breather, and there’s a chance for a short-term bounce before the downtrend continues.
What’s Happening?
1. Resistance Zones:
- 23,770: This is the first hurdle for the price to cross. Sellers have been strong here.
- 23,833 and 23,935: If 23,770 breaks, these are the next levels where selling pressure might kick in.
2. Support Levels:
- 23,439: The first key level where buyers could step in.
- 23,303: A stronger support zone if the decline deepens.
3. Trendline Resistance:
There’s a clear downward trendline acting as a ceiling, making it hard for the price to move higher.
4. Current Setup:
The price is hovering around 23,629 after a sharp drop. It feels like the market is pausing to decide its next move. A bounce toward 23,770 looks possible, but the bigger picture still leans bearish.
How to Trade This:
- If you’re bullish:
Watch for a breakout above 23,770 with good buying momentum. If it happens, there’s room for the price to climb to 23,833 or even 23,935.
- If you’re bearish:
Look for the price to struggle near 23,770 or start falling again. That could be your signal to go short, with targets at 23,439 and 23,303.
Bottom Line:
The market still looks weak, but there’s a chance for a small bounce before sellers take control again. Keep an eye on how the price behaves around 23,770—it’ll tell us whether buyers are gaining strength or if the downtrend is here to stay.
What do you think? Are you leaning bullish or bearish? Share your thoughts in the comments!
Only for educational purposes.
This content is not a recommendation to buy and sell.
Not SEBI REGISTRAR.

#NIFTY Intraday Support and Resistance Levels - 06/01/2025Gap up opening expected in nifty. After opening nifty will trade in between the zone of 24000-24200 level. If nifty gives breakout of 24200 level and starts trading above 24250 then expected strong bullish rally in today's session. Similarly, In case nifty starts trading below 23950 level then bearish rally expected in nifty. This downside movement can goes upto 23750 level.

Nifty Intraday and Swing Trade Analysis For 06/01/25 And weekly
In this post, I’m sharing my detailed analysis of Nifty 50’s recent price action, focusing on intraday and swing trades. This setup incorporates technical patterns, volume confirmation, and Smart Money Concepts (SMC) to identify high-probability trade opportunities.
Key Observations
Bearish Momentum Across Timeframes: Both daily and intraday charts show strong bearish trends validated by supply zones and volume spikes.
Critical Levels Identified:
Resistance: 24,200 - 24,400 (Supply Zone).
Support: 23,950 (Intraday) and 23,700 - 23,500 (Swing Levels).
Volume Profile: Volume spikes on breakdowns confirm institutional involvement.
Trade Plan: Intraday
Scenario 1: Sell Below 23,950
Entry: Below 23,950 (confirmed breakdown).
Stop Loss: Above 24,050.
Target 1: 23,900.
Target 2: 23,850.
Rationale: Break below 23,950 signals bearish continuation with strong seller dominance.
Scenario 2: Buy Above 24,050
Entry: Above 24,050.
Stop Loss: Below 23,950.
Target 1: 24,100.
Target 2: 24,150.
Rationale: Reclaiming 24,050 indicates a potential bullish reversal.
Confidence Level: Moderate (requires strong buying volume).
SWING TRADING
Scenario 1: Swing Sell Below 23,900
Entry: Below 23,900.
Stop Loss: Above 24,150.
Target 1: 23,700.
Target 2: 23,500.
Rationale: A breakdown below 23,900 aligns with the long-term bearish structure and supply rejection.
Scenario 2: Swing Buy Above 24,200
Entry: Above 24,200.
Stop Loss: Below 24,000.
Target 1: 24,400.
Target 2: 24,600.
Rationale: Clearing the supply zone at 24,200 would confirm a trend reversal.
Confidence Level: Moderate.
Advanced Concepts Used
Smart Money Concepts (SMC):
Supply Zone: 24,200 - 24,400.
Demand Zone: 23,700 - 23,500.
Liquidity Trap: Below 23,950.
Volume Confirmation:
Selling volume spikes during breakdowns confirm bearish moves.
Low-volume retracements suggest weak buying interest.
Indicators:
RSI: Below 50 on daily charts, supporting bearish momentum.
MACD: Bearish crossover on daily charts aligns with the trend.
Moving Averages: Price below the 20 EMA and 50 EMA reinforces bearish bias.
Why This Trade Setup Stands Out
This analysis combines the best of price action, volume confirmation, and advanced SMC tools. Each level and decision is backed by data and market behavior, ensuring a methodical approach to trading.
Disclaimer
The views and trade ideas shared in this post are for informational and educational purposes only. They are not financial advice and should not be construed as a recommendation to buy, sell, or hold any securities or financial instruments. Trading involves significant risk, and you should carefully consider your financial situation, objectives, and risk tolerance before making any trading decisions.

NIFTY : Trading Levels and plan for 06-Jan-2025 Nifty Trading Plan for 6-Jan-2025
Introduction
The chart shared yesterday highlighted key zones and potential movements. The Opening Resistance Zone of 24,312 acted as a strong supply area, while the Support Zone between 23,970-24,016 was well respected. Actual price movement closely aligned with the predicted Yellow (Sideways) and Green (Bullish) trends, allowing traders to capitalize on the directional moves.
Today’s chart brings us new levels and strategies for varying opening scenarios. Let's dive into the details for 6-Jan-2025!
Trading Plan for 6-Jan-2025
Gap-Up Opening (100+ Points Above 24,016):
If Nifty opens with a significant gap-up:
Immediate resistance lies at 24,170-24,196. Wait for price action near this level.
Bullish Scenario: If prices sustain above 24,196 for 15 minutes, enter a long position with targets at 24,312 and 24,550. Use a stop-loss below 24,170.
Sideways Possibility: If price struggles near 24,170, expect a sideways trend, as shown in Yellow. Avoid overtrading here.
Flat Opening (Near 23,990):
If Nifty opens flat:
The key Opening Support Zone is at 23,973-23,902. This area serves as a no-trade zone unless there is a clear breakout or breakdown.
Bullish Scenario: Look for sustained buying above 24,016, targeting 24,170 initially and then 24,312.
Bearish Scenario: If prices fall below 23,902, expect a move toward the next support zone at 23,814. Use a tight stop-loss above 23,902.
Gap-Down Opening (100+ Points Below 23,970):
If Nifty opens with a gap-down:
Immediate focus should be on the First Support Zone at 23,814.
Bearish Scenario: If prices fail to hold 23,814, expect a sharp move toward 23,623 (Last Intraday Support).
Bullish Reversal Opportunity: If prices recover quickly and reclaim 23,970, consider going long for a target of 24,016. Stop-loss below 23,814.
Avoid aggressive shorting unless price action confirms weakness below 23,814.
Risk Management Tips for Options Traders:
Use smaller lot sizes to manage risk during volatile openings.
Focus on ATM (At the Money) options to reduce premium decay in uncertain conditions.
Avoid trading during the first 15 minutes unless clear trend confirmation is seen.
Always maintain a stop-loss and adhere to it.
Summary and Conclusion:
Today’s plan focuses on the key zones of resistance and support. The Opening Resistance Zone at 24,170-24,196 will be crucial for bullish continuation, while the Support Zones at 23,814 and 23,623 must be monitored for bearish breakdowns. Follow the Yellow, Green, and Red trends for guidance, and remember to prioritize risk management over aggressive trades.
Disclaimer: I am not a SEBI-registered analyst. This trading plan is for educational purposes only. Traders are advised to conduct their analysis or consult a financial advisor before executing any trades.
