#NIFTY50 TRADE SETUP - 30TH DECEMBER !!Nifty 50 Chart Analysis - 1 day Chart VieW
NSE:NIFTY
Nifty 50 Chart Analysis - Detailed Breakdown
Key Observations:
1. Current Price Zone: The Nifty index is trading at 23,832, with the price consolidating near recent lows.
2. Key Resistance Zones:
- 24,197.50: A significant resistance level, aligning with prior price rejections and a potential reversal area.
- 24,069.95: Intermediate resistance that needs to be cleared for bullish continuation.
3. Key Support Zones:
- 23,586.25: A strong support zone where buyers might step in, preventing further downside.
- 23,262.15: A deeper support level, marking the lower boundary of the recent bearish structure.
4. Market Sentiment: The price action indicates uncertainty, with equal probabilities of breakout above the resistance or breakdown below support.
Price Movement Summary:
- Upside Potential: A breakout above 24,197.50 could push the index towards 24,300+ levels. Thiszone has been highlighted in the chart as a bullish target area (marked in red box).
- Downside Risk: If the index breaks below 23,586.25, it could test 23,262.15 or lower, as depictedin the bearish target zone.
Trading Plan:
1. Bullish Plan:
- Entry: Above 24,069.95.
- Target 1: 24,197.50.
- Target 2: 24,300+.
- Stop-Loss: Below 23,961.55 (current pivot zone).
2. Bearish Plan:
- Entry: Below 23,586.25.
- Target 1: 23,536.60.
- Target 2: 23,262.15.
- Stop-Loss: Above 23,832.45.
Summary:
- Nifty is at a critical juncture, with immediate resistance at 24,069.95 and support at 23,586.25.
- Traders should wait for confirmation (breakout or breakdown) before initiating positions.
- Risk management is crucial as the index approaches year-end volatility.
Disclaimer:
This content is for educational purposes only. It is not a recommendation to buy or sell any financial instrument.The creator is not a SE-BI-registered advisor. Please consult with a certified professional before making investment decisions.
Niftytrend

#Nifty50 Outlook for upcoming week 30-3rd Jan 2025The Nifty roared this week, gaining a solid 226 points, closing at a strong 23813! It reached a peak of 23938 before dipping to 23647. As predicted, the Nifty stayed within the 24100-23000 range, forming an interesting inside candle pattern. Excitingly, a bullish "W" pattern has emerged on the weekly chart!
If the Nifty can hold above the crucial 23900 level next week, we could see it trading between 24300 and 23400 . However, while a bounce is expected, the bearish Monthly chart might tempt big players to unload their positions. Stay alert!
Across the pond, the S&P500 took a 2.5% hit, closing at 5970 after reaching a high of 6049. The 5870-5850 support zone is critical. A breach could trigger a faster selloff, potentially testing the 5637/5551 support levels. For an upward move, the S&P500 needs to conquer 6050, paving the way for resistance levels at 6094/6142/6225.
Bottom line: Use any bounce next week as an opportunity to lock in profits. Stay informed and trade wisely!"
Wishing everyone a very happy & prosperous New Year.

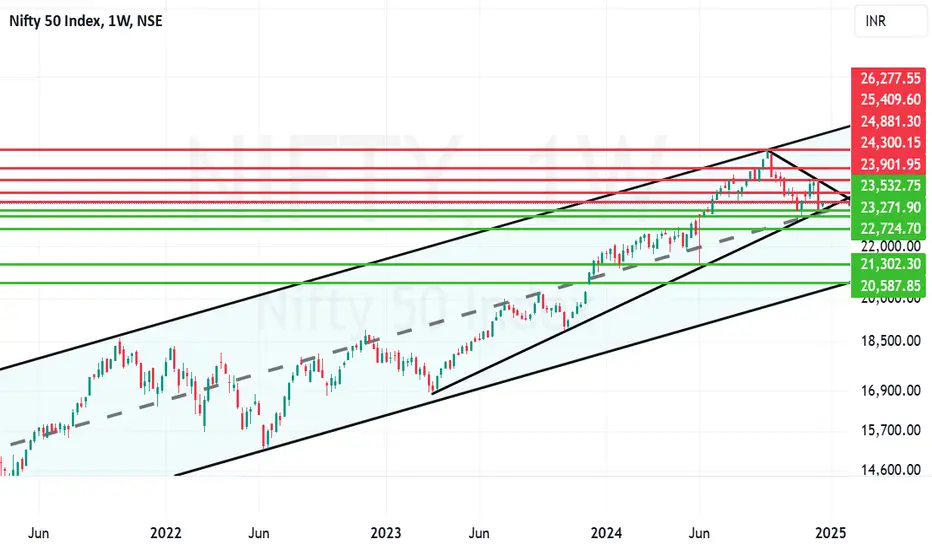
Nifty on Weekly chart delicately placed. (Medium Term Outlook)Nifty is placed delicately on a weekly chart. Shadow of the candle is slightly positive but as the closing of the year looms large FIIs and the Bears might again try to sell on rise. On the positive side if FII will be on the buying side for the 2025 beginning and create fresh positive positions we might see a positive rally on the upside. The supports for Nifty remain at 23532, 23271 and 22724. 22724 is a very important support below which we might see a free fall which as of now can range till 21302 or even 20587. However there does not seem any trigger as of now which can bring Nifty to this levels but you never say never. On the positive side if there is a fresh buying trigger and a positive rally overall the resistances on the upper side seem to be near 23901, 24300, 24881 and finally 25409. 25409 is a strong resistance and closing above it will not only open the doors for touching the previous highs 26277 but also push Nifty towards making new highs.
Nifty IntradayPure technical levels...
if the early morning momentum continues during after noon session can test 24100 levels
currently forming a flag with lesser volume and also forming a base
Momentum has to be there for upside

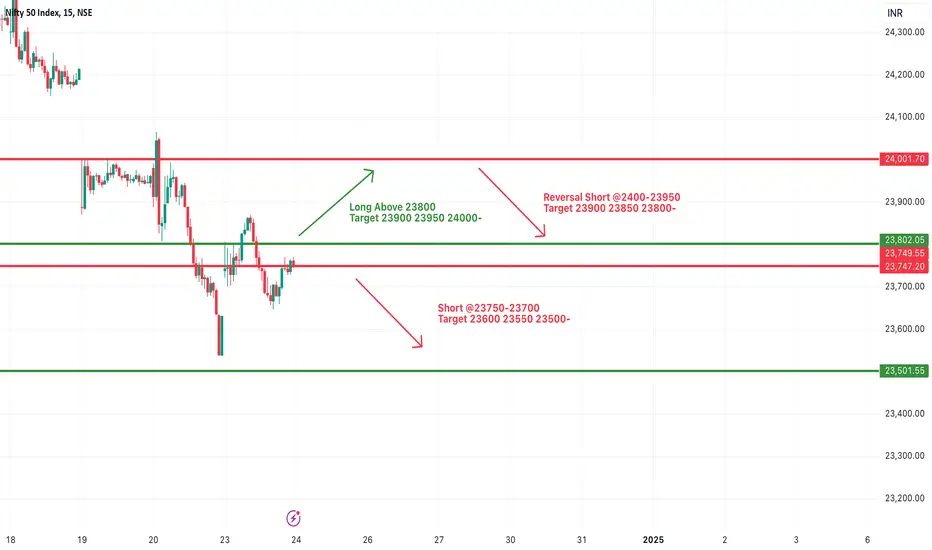
#NIFTY Intraday Support and Resistance Levels - 27/12/2024Gap up opening expected in nifty above the 23850 level. After opening if it's sustain above this level then expected movement upto 24000 level. 23700-23850 levels are the consolidation zone for nifty. Any major downside expected below the 23700 level.

NIFTY : Trading levels and plan for 27-Dec-2024Trading Plan for Nifty – 27-Dec-2024
Intro: Yesterday's Plan vs. Actual
In yesterday’s plan, we highlighted the Golden Retracement Zone (23,603-23,703) and Last Resistance Zone for Intraday (23,891) as key levels to watch. The market opened near the consolidation zone (Yellow Trend), showing initial resistance at 23,760. The breakout towards 23,891 confirmed our bullish outlook (Green Trend), while reversals near the Profit Booking Zone (24,018-24,058) validated the importance of profit-taking zones.
Let’s now craft a detailed plan for 27-Dec-2024, keeping education and execution in focus.
Detailed Trading Plan for 27-Dec-2024
Gap-Up Opening (+100 points or more above 23,850):
A significant gap-up indicates strength, with Nifty likely testing the Last Resistance Zone for Intraday at 23,891. Sustained trading above 23,891 could lead to a rally toward the Profit Booking Zone at 24,018-24,058. This zone should be treated as a target for intraday traders, with potential reversals expected near 24,058.
⚠️ Action Plan: Avoid chasing the gap-up blindly. Instead, wait for a retest of 23,891 for long entries. If the price holds, aim for 24,018 and beyond.
💡 Risk Management Tip: Use trailing stop losses for options trades near resistance zones to lock in profits.
Flat Opening (Near 23,760-23,850):
A flat opening suggests indecision, with Nifty likely oscillating within the Golden Retracement Zone (23,703-23,760) initially. A breakout above 23,760 could push the index towards 23,891, while a breakdown below 23,703 may trigger bearish momentum towards 23,608.
⚠️ Action Plan: Observe the first 30 minutes of price action. For bullish trades, wait for confirmation of a breakout above 23,760. For bearish trades, look for rejection at 23,703, targeting lower levels.
💡 Risk Management Tip: Straddle or strangle strategies in options can be effective in such scenarios to capture directional moves.
Gap-Down Opening (-100 points or more below 23,760):
A gap-down opens the door for bearish moves, with immediate support at 23,608. A breakdown below 23,608 can extend the decline towards the Last Support Zone at Extended Retracement (23,495-23,446). Watch for potential reversals in this demand zone for contrarian trades.
⚠️ Action Plan: Avoid panic selling at the open. Look for a bounce at 23,495 for long entries with tight stop losses. If bearish momentum sustains below 23,495, initiate short trades targeting lower levels.
💡 Risk Management Tip: For bearish trades, consider bear put spreads to manage risk in a trending market.
Summary and Conclusion
For 27-Dec-2024, the key levels to watch are 23,891 on the upside and 23,608 on the downside. Gap-up openings need patience for confirmation, while flat and gap-down scenarios offer better risk-reward opportunities. Manage your trades with proper hedging strategies and always prioritize disciplined exits.

Nifty Intraday Trade Setup & technical analysis |27th Dec 2024Nifty moments for option and future trading 27/Dec/2024
follow us for more updates information.
message us for any stocks related information.

#NIFTY Intraday Support and Resistance Levels - 26/12/2024Gap up opening expected in nifty near the 23800 level. Currently nifty trading in between the consolidation zone of 23700-23850 level. Any major directional rally only expected after breakout of this zone. Strong downside movement expected if nifty starts trading below 23700 level. Upside movement possible if nifty starts trading and sustain above the 23850 level.


NIFTY : Trading Plan and level for 26-Dec-2024Trading Plan for 26-Dec-2024 – Nifty
Introduction:
The trading plan for 25-Dec-2024 focused on critical zones identified on the uploaded chart. The Golden Retracement Zone (23,603–23,703) acted as a pivot for potential reversals, while the Last Resistance Zone for Intraday (23,891–23,933) served as a crucial barrier. The day saw the index testing the retracement zone, respecting support at 23,608 , and moving toward the resistance zone. The Yellow, Green, and Red trends indicated sideways, bullish, and bearish phases, respectively, providing actionable setups. Today’s plan builds on these zones with further analysis.
Scenario 1: Gap-Up Opening (200+ Points)
If Nifty opens above 23,933 :
The index enters the Profit Booking Zone (24,043–24,078) , where strong resistance can lead to rejection ( Red Trend ). A sustained move above 24,078 could trigger bullish momentum ( Green Trend ).
Action Plan:
Look for shorting opportunities near 24,043 with a stop-loss above 24,100 , targeting 23,891 .
If prices sustain above 24,078 , initiate long positions with a target of 24,200+ .
If Nifty retraces back into the Last Resistance Zone (23,891–23,933) , watch for consolidation ( Yellow Trend ).
Scenario 2: Flat Opening (Within 50 Points)
If Nifty opens near 23,730–23,760 :
Monitor price action at the Retracement Zone (23,608–23,703) .
Action Plan:
A breakdown below 23,608 can trigger bearish momentum toward 23,495 . Initiate shorts with a stop-loss above 23,640 .
If prices sustain above 23,703 , look for long positions targeting 23,891 .
Wait for the first 15-30 minutes for market sentiment before initiating trades.
Scenario 3: Gap-Down Opening (200+ Points)
If Nifty opens near 23,495–23,446 :
The Last Intraday Support Zone is critical. Watch for bounce signals ( Green Trend ).
Action Plan:
Go long above 23,495 with a target of 23,608 . Use a stop-loss below 23,430 .
If prices break 23,446 decisively, expect bearish momentum toward lower levels ( Red Trend ). Avoid aggressive trades until a clear direction is established.
Risk Management Tips for Options Trading:
Always trade with defined targets and stop-losses .
Avoid over-leveraging, especially near resistance and support zones.
Allow the market to settle for at least 15-30 minutes before initiating trades.
Use trailing stop-losses to protect profits in trending moves.
Trade with appropriate position sizing to limit losses.
Summary and Conclusion:
Nifty is trading near critical levels, and today’s trading plan highlights actionable zones for all opening scenarios. Focus on Golden Retracement and Resistance Zones for probable reversals and momentum plays. Patience and disciplined execution with proper risk management are key to capitalizing on market opportunities.
Disclaimer:
I am not a SEBI-registered analyst. This trading plan is shared purely for educational purposes. Traders are advised to conduct their research or consult a financial advisor before taking any positions.

Year 2025 and Beyond: Where to Place Your Bets?S&P 500:
US indices may continue their upward trend until the first quarter of 2025. The ultimate target appears to be above 6300, where they may peak and begin a significant correction. A global stock sell-off could potentially trigger a stock market crash similar to that of 2008.
India's Nifty 50:
India's Nifty 50 may find support around the 23,000–22,700 range and resume its upward movement in the final fifth wave, targeting a peak near 29,000. The Nifty 50 is likely to follow a trend similar to the S&P 500. The bullish cycle that began in 2009 is expected to conclude near the 29,000 level. Subsequently, a significant sell-off in Indian indices could trigger a major bear market, potentially erasing up to 50% of market capitalization from its peak.
Gold:
Gold may continue its consolidation for another month or two. A final surge toward the $3,000–$3,100 range is expected to mark the end of the rally that began in December 2015 at the $1,050 level. However, the bear market in equities is unlikely to spare even the perceived safe haven, leading to a pullback in gold prices as well.
Brent Crude:
Since March 2020, Brent crude experienced a remarkable rise, surging from $15 per barrel to $139 per barrel by March 2022. Over the past 33 months, it has already corrected by more than 47%. Brent crude is still expected to decline further, potentially reaching $50 per barrel within the next 3 to 6 months. However, the current inflationary trend could drive Brent prices beyond $160 per barrel later in 2025, before eventually succumbing to a deflationary trend that may persist for several years.
US Dollar Index:
The US Dollar Index peaked at around 114 in September 2022. Since then, it declined to 100 by July 2023 before starting to rise again in a corrective A-B-C pattern, forming part of a larger (A)-(B)-(C) decline. The Wave C of (B) is expected to conclude near 109, followed by another decline toward 98 by the first half of 2025. However, a renewed bullish trend in the US Dollar Index could reinforce the "Cash is King" narrative during a global equity market downturn.
USD/INR:
The bullish trend in USD/INR, which began in January 2008 at the 39 level, has seen the Indian Rupee weaken by over 60% against the US Dollar over the past 17 years. In the short term, USD/INR may peak around 86. However, the Rupee is likely to weaken further, reaching 90 against the US Dollar by the second quarter of 2025.
US Govt. 10 years bond yield:
The long-term yield on U.S. Government 10-year bond's yield indicates rising interest rates for this decade. In the short term, the yield may ease to 3%-2.6% by the second quarter of 2025. However, fears of a U.S. Government default could push the yield to 10% or higher over the next couple of years. The "Bond Ghost," along with a global equity rout, may haunt investors again in 2025-2026.
Bitcoin (BTC):
Bitcoin's bullish trend may continue until the first quarter of 2025, albeit at a slower pace. BTC still has the potential to reach around $115k-$120k, concluding the bullish run that began in November 2022 from the level of $15,500. Over the past decade and a half, BTC has significantly outpaced any other asset class globally. However, global risk aversion, which may start with an initial global equity market sell-off, could pause Bitcoin's bullish journey for the rest of 2025. Before the end of 2025, BTC might lose up to 50% of its value from its peak.
In the longer run, however, BTC has the potential to become the most valuable asset class globally, even after experiencing a 50% erosion in its value.

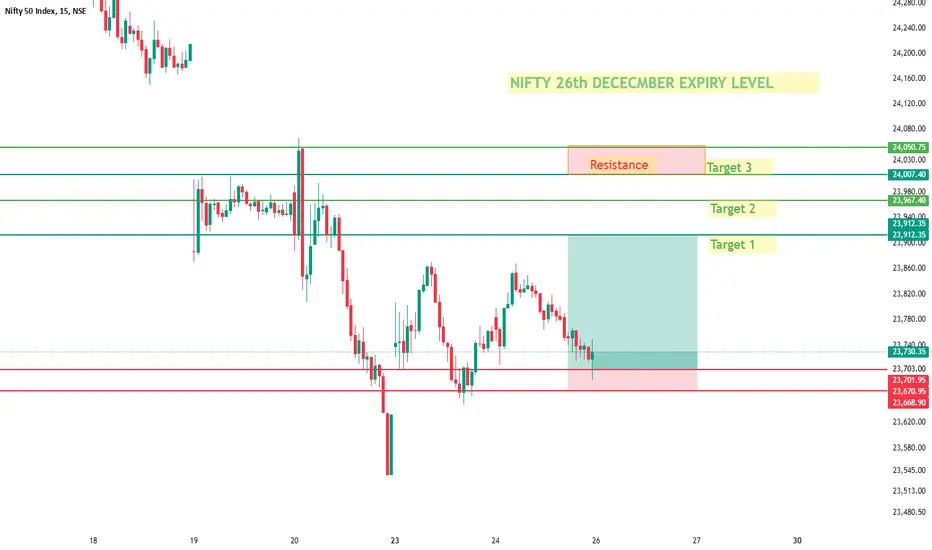
NIFTY 50 26th DECEMBER 2024Stop-Loss (Red Zone)(23670):
Your stop-loss is set below the recent swing low, which is a good strategy as it protects against potential downside movement if the price reverses.
Entry Zone:(23700)
It seems you are entering a long position (buy) in a consolidation phase after the price formed a possible higher low. This suggests you expect the price to move up toward the targets.
Target Levels (Green Lines):
1st Target (23,910.70):
This is a reasonable target, as it aligns with a previous resistance zone (from the left side of the chart). If the price reaches this level, a partial profit booking strategy can be applied.
2nd Target (23,965.75):
This is just above the 1st target, closer to the next resistance level. It's a logical continuation of the trend if momentum sustains.
3rd Target (24,010.20):
#NIFTY Intraday Support and Resistance Levels - 24/12/2024Flat opening expected in nifty. After opening if nifty starts trading above 23800 level then possible it will consolidate in between 23800-24000 level. Below 23750 downside expected upto the 23500 level. 24000 level will act a strong resistance for today's session. Any upside rally can reversal from this level.
NIFTY 50 : Mapping the future through harmony.Timeframe : Monthly
Tool : Fibonacci
My view in simple terms if Fractals were really to follow, NIFTY is yet to see more 10% gutter movement before it rallies.
Just an opinion, Your inputs, Suggestions and views are always welcomed.
Thank you for dropping by.

NIFTY : Trading Levels and Plan for 24-Dec-2024Plan vs. Actual Performance (23-Dec-2024) - Nifty:
In today’s session, Nifty closely followed the levels and zones highlighted in the trading plan:
The index opened within the Opening Resistance/Support Zone (No Trade Zone) , as indicated in the plan. Price action remained muted here, showing indecision, aligning with the expectation of limited opportunities in this area.
The attempted move towards the Last Intraday Resistance Zone (23,953-24,058) failed, with prices reversing near resistance, confirming the bearish projection (red trend).
Later in the session, the index approached the Buyer’s Support Zone (23,194-23,281) . Prices showed signs of stabilization, reflecting the plan's green trend projection for potential reversal or support testing.
Key Takeaway: The plan accurately captured the market's reaction to critical levels, reinforcing the importance of patience in the No Trade Zone and the effectiveness of the support/resistance zones for planning entries.
This reflects the value of adhering to a well-defined trading framework.
This analysis will help us prepare for the trading day on 24-Dec-2024, considering different opening scenarios.
Trading Plan for 24-Dec-2024
Gap Up Opening (100+ points above 23,747.20)
If the market opens above 23,847.20, it indicates a strong bullish sentiment. The first resistance level to watch is 23,863.00 (Opening Resistance). If the price sustains above this level, the next target is 23,976.00 (Last Intraday Resistance for retracement).
In case the price breaks above 23,976.00, the next target is 24,009.00. A sustained move above this level can lead to the Profit Booking zone at 24,128.00.
If the price fails to sustain above 23,863.00, look for a potential retracement to 23,739.30. This could indicate a sideways trend (yellow line) or a bearish reversal (red line).
Flat Opening (around 23,747.20)
A flat opening suggests indecision in the market. The immediate level to watch is 23,739.30. If the price holds above this level, it could indicate a bullish trend (green line) towards 23,863.00.
If the price breaks below 23,739.30, the next support level is 23,611.00 (Opening Support Zone at Buyer’s retracement zone). A break below this level could lead to a bearish trend (red line) towards 23,547.00.
Monitor the price action around 23,863.00 for potential resistance. A break above this level could lead to targets of 23,976.00 and 24,009.00.
Gap Down Opening (100+ points below 23,747.20)
A gap down opening below 23,647.20 indicates bearish sentiment. The first support level to watch is 23,611.00. If the price holds above this level, it could indicate a potential retracement (yellow line) towards 23,739.30.
If the price breaks below 23,611.00, the next target is 23,547.00. A sustained move below this level could lead to further downside towards 23,447.00.
In case of a retracement, monitor the price action around 23,739.30 for potential resistance. A break above this level could lead to targets of 23,863.00 and 23,976.00.
Risk Management Tips for Options Trading
Always use stop-loss orders to limit potential losses.
Avoid over-leveraging your positions; trade within your risk tolerance.
Diversify your trades to spread risk across different assets or strategies.
Keep an eye on implied volatility, as it can significantly impact options pricing.
Regularly review and adjust your trading plan based on market conditions.
Summary and Conclusion
In summary, the trading plan for 24-Dec-2024 involves monitoring key support and resistance levels based on the opening scenario. By understanding the potential price movements and trends (yellow for sideways, green for bullish, and red for bearish), traders can make informed decisions. Always practice good risk management to protect your capital.
Disclaimer : I am not a SEBI registered analyst. This analysis is for educational purposes only and should not be considered as financial advice. Always do your own research before making any trading decisions.

#NIFTY50 - 24TH DECEMBER !!NSE:NIFTY
NIFTY CHART ANALYSIS (24TH DEC)
Important Levels:
1. Resistance Levels:
- 24,259.50: Key resistance zone where selling pressure might build.
- 23,926.95: Immediate resistance near the current price.
2. Support Levels:
- 23,398.85: Major support level below the current price where buyers could step in.
3. Trendline:
- A downward trendline acts as dynamic resistance, connecting lower highs and reinforcing the bearish momentum.
Analysis:
- The price is in a bearish trend, consistently making lower highs and lower lows.
- Current Scenario: The price is near the trendline and could face rejection, continuing the downward move toward 23,398.85.
- Alternative Scenario: A breakout above the trendline might invalidate the bearish setup, potentially leading to a test of 23,926.95 or higher.
Only for educational purposes.
This content is not a recommendation to buy and sell.
Not SEBI REGISTRAR.

A Smart Comeback by Nifty but is it a dead cat bounce?Today we saw a smart comeback by Nifty but a confirmation candle and a positive closing to the week an ensure if it is not a dead cat bounce (Only a Technical bounce before Nifty falls again). Further ground has to be covered by Nifty before we reach the Bull territory. The closing today was good above the Father line and indicates positivity but whether the bounce sustains or not is a question that will be answered later in the week.
Right now the supports for Nifty remain at: 23691 (200 days EMA) or the Father line, 23588, 23258 (Mid channel support), 22499 and 21572.
Resistances on the upper side are at: 23871, 24053, 24183, 24359 (50 day's EMA) or the Mother line resistance, 24552 and finally 24721 (Important Fibonacci resistance). Bulls can get a prominence only after we get a closing above this level.
Disclaimer: The above information is provided for educational purpose, analysis and paper trading only. Please don't treat this as a buy or sell recommendation for the stock. We do not guarantee any success in highly volatile market or otherwise. Stock market investment is subject to market risks which include global and regional risks. We will not be responsible for any Profit or loss that may occur due to any financial decision taken based on any data provided in this message.

#NIFTY Intraday Support and Resistance Levels - 23/12/2024Gap up opening expected in nifty near the 23800 level. After opening if nifty sustain above 23800 then possible upside movements upto 24000. 24000 level will act as a strong resistance zone for today's session. Possible nifty will reversal from this level upto the 23800 and this can be extend for further downside rally upto 23500 if nifty starts trading below 23750 level.

NIFTY : Trading Levels and Plan for 23-Dec-202423-Dec-2024 Nifty Trading Plan
On last trading session prices met with the targets on breaking and sustaining below mentioned levels and met with all targets on down side. Strategies for upcoming trading session
Color-Coding:
Yellow: Sideways trend. Green: Bullish trend. Red: Bearish trend.
23-Dec-2024 Trading Scenarios:
Gap Up Opening (+100 points):
If Nifty opens above 23,953 but below 24,058 , expect initial resistance at 24,058 . Watch for rejection signals such as bearish candlestick patterns (e.g., pin bars or engulfing) to initiate short trades targeting 23,747-23,603 .
However, if prices sustain above 24,058 , this zone transforms into support, indicating bullish sentiment. Enter long trades cautiously above 24,058 with targets of 24,300-24,400 . Use a stop loss at 23,950 .
Flat Opening:
A flat opening near 23,631-23,603 suggests the no-trade zone remains intact. Wait for a breakout above 23,747 or a breakdown below 23,603 .
Above 23,747: Long trades targeting 23,953-24,058 .
Below 23,603: Short trades targeting 23,281-23,194 . Use stop losses based on an hourly close for safer risk management.
Gap Down Opening (-100 points or more):
A gap down below 23,603 places immediate focus on the buyer’s support zone at 23,281-23,194 . Look for bullish reversal patterns (e.g., hammer or bullish engulfing) within this zone to initiate long trades.
If prices break below 23,194 , bearish momentum could intensify. Short trades targeting 23,000-22,850 become viable. Maintain a stop loss above 23,281 for these positions.
Risk Management Tips for Options Trading:
Use defined risk strategies like buying options or limited-loss spreads.
Avoid aggressive averaging when trades move against your position.
Always calculate the maximum loss potential before entering trades.
Exit positions if the index stays in the no-trade zone for extended periods.
Summary & Conclusion:
Nifty’s trading action on 23-Dec-2024 will revolve around the critical zones discussed. Respect the defined levels and avoid impulsive trades within the no-trade zone. Wait for confirmation before entering trades to maximize risk-reward ratios.
Disclaimer:
I am not a SEBI-registered analyst. This analysis is for educational purposes only. Please consult your financial advisor before making trading decisions.

#Nifty50 outlook for upcoming week 23-27th Dec 2024The Nifty experienced a tumultuous week, plummeting roughly 1200 points to close at 23587 after reaching a high of 24781 and a low of 23537. This sharp decline was largely attributed to a hawkish stance from the US Federal Reserve, triggering a sell-off in the US market and prompting significant Foreign Institutional Investor (FII) selling in India. The 5% correction from its peak has brought the Nifty dangerously close to the crucial WEMA50 support level at 23426. However, there are signs of a potential bullish reversal forming a 'W' pattern. Sustaining above 23426 will be critical for a market turnaround.
Next week, I expect a volatile trading range between 24100 and 23000 . A breach of these levels could lead to significant market moves. The monthly Nifty chart also indicates weakness, suggesting further downside potential towards the 22250 support level, representing a 5.7% decline from current levels.
This presents a valuable opportunity for investors to prepare a watchlist of their preferred stocks and strategically accumulate positions during any further market correction

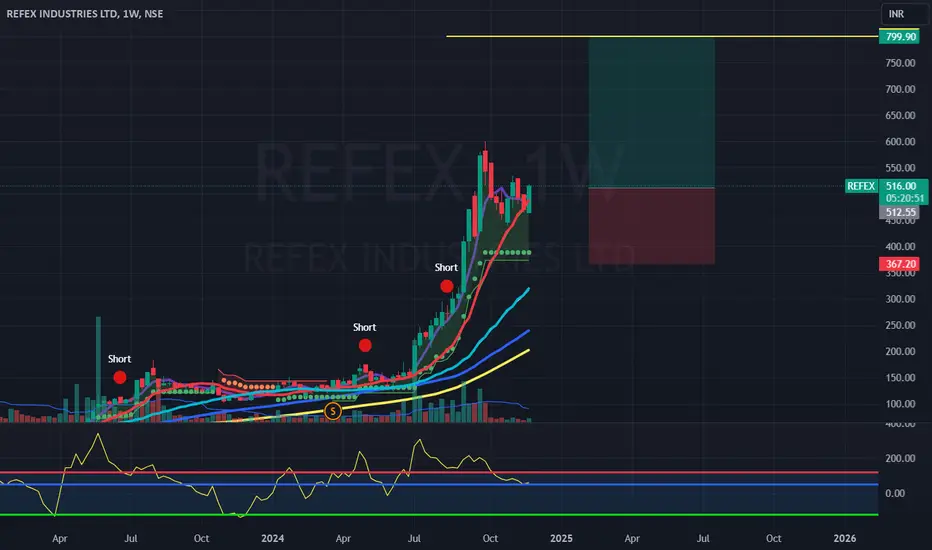
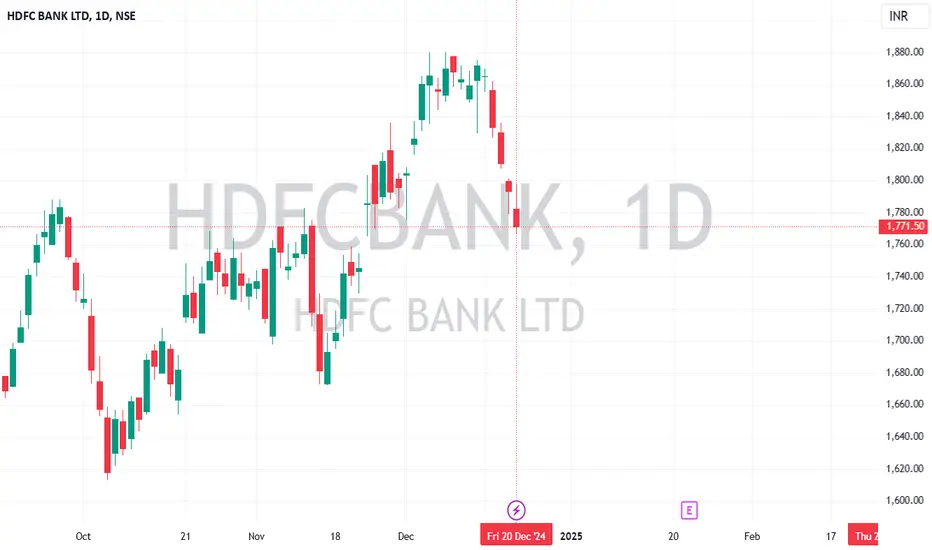
Swing Trading Strategy: HDFC Bank (HDFCBANK)Stock Outlook:
I maintain a bullish outlook on HDFC Bank (HDFCBANK) with a swing trade target of ₹1913.15 by February 27, 2025. This target aligns with the current technical and market trends indicating upward momentum.
Stop Loss Strategy:
To manage downside risk, ₹1600 has been identified as a crucial support level. Any daily settlement below this level will signal a potential breakdown, and positions should be exited accordingly.
Key Notes:
Risk Management: Ensure position sizing aligns with your overall risk tolerance.
Timeframe: This strategy is based on a swing trading approach and is meant to capitalize on short- to medium-term market movements.
Disclaimer:
This trading strategy is for informational purposes only and does not constitute financial advice. Market conditions are subject to change, and all trades carry risks. Please consult a financial advisor or conduct your own research before making any investment decisions. Past performance does not guarantee future results.
Nifty Weekend Update...alert!!!!Hey guys, currently nifty this week fall more then 4%, due to holidays FII are selling highly.
If you see the chart you can see nifty currently just above of 50WMA after huge selling pressure it still above the 50WMA, if this will break next week onwards we will enter a bear market for short term period, so in my opinion this is now a crucial moment so keep cash in hand for buying in the dip.
Another scenario if nifty will bounce break from this level or first breaking 50wma then trap all bears and then bounce back above 50WMA that will also good for nifty to continue its trend to 30K.
