NIFTY : Levels and Plan for 02-Dec-2024Nifty 50 Trading Plan for 02-Dec-2024
On 01-Dec-2024, Nifty traded in a well-defined structure, oscillating between the Golden Retracement Zones for buyers and sellers. The market displayed a Change of Character (CHoCH), with price initially retesting the buyer's support zone near 23,786 before reversing toward the seller's resistance zone at 24,413. Key levels such as 24,250 and 24,112 acted as dynamic Opening Support/Resistance levels. The chart also highlighted a Yellow Zone for sideways movements, Green Zones for bullish trends, and Red Zones for bearish scenarios.
Detailed Trading Plan for 02-Dec-2024
Gap-Up Opening (Above 24,250, up to 100+ points)
If Nifty opens with a gap-up beyond 24,250, it will enter the Opening Resistance Zone. In this scenario:
Watch for rejection near 24,413 or higher. If rejection is confirmed, initiate short positions targeting 24,250 as the first support and 24,112 for extended profits.
For sustained bullishness, monitor an hourly candle close above 24,413. If this occurs, consider long positions with a target at the Profit Booking Zone around 24,483.
Avoid chasing trades immediately after the gap-up. Allow prices to stabilize for 15–30 minutes to validate the trend.
Flat Opening (Near 24,112 to 24,130 range)
In case of a flat opening, the Opening Support/Resistance at 24,112 will be critical:
If prices sustain above 24,112 with strong buying, consider initiating long positions, targeting 24,250 and 24,413.
If Nifty fails to hold 24,112, expect a test of 24,030 (Buyer's Opening Support) and potentially 23,940 (Last Support for Intraday).
Use tight stop losses when trading near the flat opening zone due to potential whipsaws.
Gap-Down Opening (Below 24,030, down to 100+ points)
A gap-down opening near or below 24,030 would signal bearish sentiment:
Observe buyer activity near 23,940. If support holds, initiate longs with targets of 24,030 and 24,112.
If 23,940 is breached, expect further downside toward 23,832 or even 23,786, the Buyer's Support for sideways action.
Manage risk effectively by waiting for hourly candle confirmation in case of volatile downward moves.
Risk Management Tips for Options Traders
Trade options with a defined stop loss and avoid overleveraging.
Use spreads (e.g., Bull Call Spread or Bear Put Spread) to reduce premium outflows and limit risk.
Monitor implied volatility (IV) levels, as sudden changes can impact option premiums significantly.
Summary and Conclusion
Nifty's key levels for 02-Dec-2024 include 24,413 (Profit Booking Zone), 24,250/24,112 (Critical Opening Support/Resistance), and 23,940/23,786 (Key Buyer Support Zones).
Focus on hourly candle confirmations for validating breakouts or breakdowns.
Stay cautious during initial market volatility and align trades with the prevailing trend as highlighted by the Yellow (sideways), Green (bullish), and Red (bearish) zones.
Disclaimer
I am not a SEBI-registered analyst. This analysis is for educational purposes only. Please consult your financial advisor before making trading decisions.
Niftytrend

VIEW ON NIFTY AND BANKNIFTYNifty and Bank nifty view for coming weeks.
Dollar Index, Gold, US market and 10 year US Gsec
Disclaimer -
The information provided herein is for educational purposes only. It does not constitute financial, investment, or trading advice and should not be construed as such. Consult a qualified financial advisor before making any financial decisions.
We are not liable for any monetary loss, that may arise directly or indirectly from the use of or reliance on the information provided.

#Nifty50 Volatile week ahead, outlook for 2-6th Dec 2024The Nifty 50 index concluded the week on a strong note, closing at 24,131, up 225 points from the previous week. The index oscillated between a high of 24,354 and a low of 23,873, staying within the predicted range of 24,500 to 23,300.
For the upcoming week, I anticipate the index to remain confined to a range of 24,750 to 23,600 . A breach of these levels could trigger significant market volatility.
A closer look at the weekly chart reveals a potential W-pattern formation. To complete this pattern, a pullback towards the 23,500-23,600 support zone is necessary. Whether this pullback materializes next week will be crucial to watch.
S&P 500 Breaks Resistance, Sets Stage for Further Gains
The S&P 500 index finally managed to breach the strong Fibonacci resistance level of 6,013. If it can sustain above the 6,000 mark, a move towards the 6,142 level, representing a 1.5% upside, is likely. Such a move could provide a positive impetus to global markets. However, a failed breakout could lead to a 2% correction, potentially testing the 5,914-5,900 support zone. Investors should be prepared for both scenarios.

The Nifty Spot direction for the month of December 2024If you listen, you might forget. If you see, you will remember. Presenting the Nifty Spot Daily/End-of-Day Trend Forecast for December 2024. Pay close attention to the calculated turning dates and their directions, as these insights can guide traders in making informed decisions. Please note that price levels may vary, as the primary focus is on timing and trend direction.
In summary, December 2024 appears to be a bearish month for the Nifty. My Timing Analysis provides valuable insights to help traders closely assess market direction.
If you are a trader, do not trade without Stop-Loss.

Long Term Nifty Outlook with Macro and Micro Economic commentaryNifty after making a new high is in volatile consolidation and correction mode. FIIs are selling big on every rally and DIIs and Retail are seeing this opportunity to consolidate their position in Indian market. Amidst all the volatility Nifty managed to close the month at 24131.
Every investor is seeking answer to one question which when will FII return to Indian market. There are too answers to this. Simple answer is they will return eventually sooner rather than later.
A more based answer is that when opportunity to earn more return elsewhere will diminish and there will be sort of global stability. Right now Ukraine and Russia conflict has opened another chapter of uncertainties. Stimulus package from China to stabilize its economy is also in an ongoing phase. Iran and Israel conflict is also contributed to environment of global uncertainties. On the other hand Maharashtra Election result has tried or is trying its best to comfort DII and retail investors.
Bond yield in US and surge in crypto post US election and China stimulus has provided a temporary oppenturnity for FIIs to make big money elsewhere. These are the Macro and Micro economic changes which led to FIIs searching better greener pastures elsewhere. Thus when the dust settles a bit and Indian companies again start giving attractive Q on Q results, FIIs will come back.
Results this quarter from India Inc in a traditionally weaker Quarter were a little below par. GDP growth was seen at 5.4% which is again slightly below par which can send Nifty into further consolidation mode. So there will be recovery from here but pointing out the timeline is a tough call even for seasoned economists.
Now coming to the Technical chart, Support and resistance levels. We can not say for sure if the bottom has already been made when earlier this month which was 23263 was the exact bottom or not but it will be an important level going below which we can see free fall in Nifty. So that will be a level to watch. On Daily candlestick chart there is currently a Cup shaped recovery in progress. There are clear trend lines suggesting that top of the channel is somewhere between 28K or 30K in the long run. Base support of the trend line includes 23263 hence that level is of prime importance. Mother line major resistance going forward will be 24367. Father Line major support will be at 23572.
Supports for Nifty remain at: 23890, 23263 to 23230 zone, 22783, 22369, 21845 and 21310.
Resistances for Nifty Remain at: Zone between 24367 to 24570, 25214, 25653 and 26277.
Disclaimer: The above information is provided for educational purpose, analysis and paper trading only. Please don't treat this as a buy or sell recommendation for the stock. We do not guarantee any success in highly volatile market or otherwise. Stock market investment is subject to market risks which include global and regional risks. We will not be responsible for any Profit or loss that may occur due to any financial decision taken based on any data provided in this message.

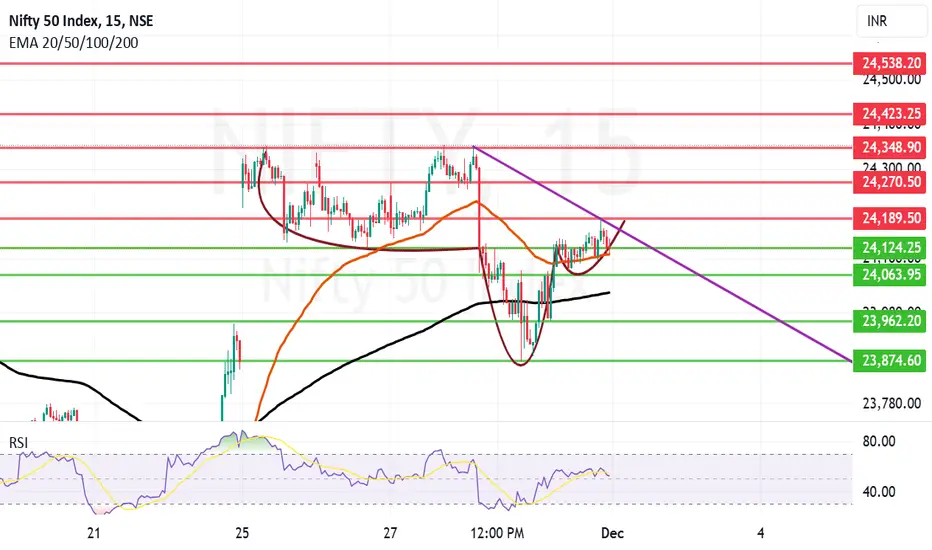
Reverse H&S formation in 15 minute chart of Nifty on cards.Usually we do not look at chart with less than 1 hour candles but an interesting pattern is forming which can yield us a fresh bullish move in Nifty so I am presenting it today. If Nifty manages to stay above 24109 and can close above 24189 we can have a fresh bullish rally in Nifty which can see it pivot very fast as high as 24538. with resistances at 24270, 24348, 24423 and finally 24538.
The important levels will be the support at 24109 and resistance at 24189. Other than 24109 (which is the mother lie for 15 minute chart) important supports will be at 24124, 24063, 24024 (which is father line of 15 minute chart). Below 24024 Nifty will become weak again and Bears can then drag it to 23962 or even 23874 again.
Again the important levels to watch for the next week on resistance side will be 24189 and on support side will be 24109 and 24024 (Mother and Father lines on 15 minute chart). This is what we can read from ultra short term chart of Nifty on 15 minute candle. To know more about the Mother, Father and Small child theory, trend lines, supports and resistances read my book The Happy Candles Way to Wealth creation. In this book you will get to learn about Techno-Funda investment. Many reviewer who have read the book consider it as a hand book of investment. You can check the reviews on Amazon and google Play book. The book is available on amazon in Paperback and kindle version. E-version of the book also available on Google Play books too.
Disclaimer: The above information is provided for educational purpose, analysis and paper trading only. Please don't treat this as a buy or sell recommendation for the stock. We do not guarantee any success in highly volatile market or otherwise. Stock market investment is subject to market risks which include global and regional risks. We will not be responsible for any Profit or loss that may occur due to any financial decision taken based on any data provided in this message.
#NIFTY Intraday Support and Resistance Levels - 29/11/2024Expected slightly gap up opening in nifty above 24000 level. After opening if it's starts trading and sustain above 24050 level then possible correction rally upto 24250 level in opening session. Downside 150-200 points rally expected below 24000 level. 23800 will act as an important support for today's session.

Nifty Intraday Support & Resistance Levels for 29.11.2024On Thursday, Nifty opened flat, hit a high of 24345.75, and then saw a sharp decline below 24000, making a low of 23873.35 as it tested the 15m demand zone. It closed at 23914.15, losing 360 points from the previous close.
Breaking below the key 24100 support (3-day low) triggered a strong downward move, dragging Nifty over 200 points. Both the Weekly Trend (50 SMA) and Daily Trend (50 SMA) remain sideways, signaling caution.
Demand/Support Zones
Near Demand/Support Zone (15m): 23856.15 - 23940.30 (tested yesterday)
Near Demand/Support Zone (15m): 23661.75 - 23731.25
Far Demand/Support Zone (75m): 23447.15 - 23578.60
Near Support: 23189.88 (61.8% FIBO)
Far Demand/Support Zone (Daily): 22642.60 - 22910.15
Supply/Resistance Zones
Near Supply/Resistance Zone (125m): 24257.65 - 24354.55
Near Supply/Resistance Zone (75m): 24447.65 - 24537.60
Far Supply/Resistance Zone (Daily): 24567.65 - 24978.30 (inside weekly supply)
Far Supply/Resistance Zone (75m): 24636.75 - 24741.45 (inside Daily supply)
Far Supply/Resistance Zone (Weekly): 24567.65 - 25234.05

NIFTY is not stopping at the station....???NSE:NIFTY
🚂 is not stopping at the station — hope slows down soon...other wise next station is too far ... 🫥
expecting a bounce
not sure if that would sustain
best option Nifty dance around this range before starting upward journey
Otherwise next station is quite far
Key levels marked
disc: no recommendation

Review and plan for 3th November 2024Nifty future and banknifty future analysis and intraday plan.
Stock- intraday idea included.
This video is for information/education purpose only. you are 100% responsible for any actions you take by reading/viewing this post.
please consult your financial advisor before taking any action.
----Vinaykumar hiremath, CMT

NIFTYHi guys,
In this chart i Found a Demand Zone in NIFTY CHART for Positional entry,
Observed these Levels based on price action and Demand & Supply.
*Don't Take any trades based on this Picture.
... because this chart is for educational purpose only not for Buy or Sell Recommendation..
Thank you

NIFTY : Analysis and Levels for 29-Nov-2024
On the previous trading day, Nifty exhibited a significant shift in momentum. A Change of Character (ChoCH) was observed, indicating a possible transition between bullish and bearish phases. The index traded near the golden retracement zones, showing both buyer and seller activity. The yellow trend represents a sideways market, green signals a bullish trend, and red indicates bearish sentiment.
After a consolidation, NIFTY has shown a significant trending move on last trading session, so most probably nifty can trade sideways or in a range on Friday, but based on the chart, I have prepared trading plans for three possible opening scenarios: Gap Up, Flat, and Gap Down openings.
Gap Up Opening (+100 points or more above ₹23,957)
Resistance Focus (₹24,112-₹24,250): If Nifty opens above ₹24,057, it will directly test the golden retracement zone for sellers. Watch for bearish patterns, such as shooting stars or evening stars, in this area. If selling pressure emerges, initiate a short position.
Action Plan:
Entry: Short below ₹24,200 after confirmation of rejection.
Target: ₹23,957 (the current close) and ₹23,807 (demand zone).
Stop Loss: Above ₹24,300 to manage risk.
Breakout Potential (₹24,250+): If Nifty breaks above ₹24,250 with strong volumes, it may head toward the Resistance Zone (₹24,544-₹24,656). Consider a long trade upon breakout confirmation.
Action Plan:
Entry: Long above ₹24,250 after a 15-minute candle close.
Target: ₹24,544 and ₹24,656.
Stop Loss: Below ₹24,100 to safeguard against false breakouts.
Flat Opening (Near ₹23,957)
Golden Retracement (₹24,112): If the market consolidates around ₹23,957, wait for a decisive move. The immediate focus will be the golden retracement zone at ₹24,112.
Action Plan:
Entry: Long above ₹24,112 if the price breaks this level with volume.
Target: ₹24,250 and ₹24,544.
Stop Loss: Below ₹23,900 to minimize risk.
Demand Zone (₹23,807): If Nifty fails to sustain above ₹23,957, it could test the Golden Retracement Zone for Buyers (₹23,807-₹23,497). Look for bullish reversal patterns in this zone for long entry.
Action Plan:
Entry: Long near ₹23,807 if bullish candles like hammers form.
Target: ₹23,957 and ₹24,112.
Stop Loss: Below ₹23,497 to protect against breakdowns.
Gap Down Opening (-100 points or more below ₹23,957)
Demand Zone Test (₹23,807-₹23,497): If Nifty gaps down and opens near or below ₹23,807, focus on the demand zone. This zone is critical for potential reversals.
Action Plan:
Entry: Long near ₹23,807-₹23,497 after confirming bullish patterns.
Target: ₹23,957 and ₹24,112.
Stop Loss: Below ₹23,497 to limit losses.
Breakdown Scenario (Below ₹23,497): A breakdown below ₹23,497 signals strong bearish momentum. Short positions can be taken if confirmed by volume and candle patterns.
Action Plan:
Entry: Short below ₹23,497 after confirmation.
Target: ₹23,300-₹23,100.
Stop Loss: Above ₹23,600 to avoid unnecessary risks.
Risk Management Tips for Options Trading
Limit your position size to ensure no single trade risks more than 2% of your capital.
Use hedging strategies, such as buying protective puts or selling covered calls, to offset potential losses.
Avoid trading during the first 15-30 minutes of market opening, as this period is highly volatile.
Monitor implied volatility (IV) for options and select contracts with reasonable premiums to avoid overpaying.
Summary and Conclusion
This trading plan is designed to cater to multiple scenarios, ensuring you're prepared regardless of the market's direction. The key lies in observing critical levels like ₹24,112 and ₹23,807 and waiting for confirmation before entering trades.
Remember: Yellow trends indicate sideways movement, green signals bullish momentum, and red shows bearish sentiment. Stick to the plan, respect stop losses, and prioritize capital preservation.
Disclaimer:
I am not a SEBI-registered analyst. This trading plan is for educational purposes only. Please consult with your financial advisor or conduct your analysis before making any trading decisions.

The Nifty Spot Intraday view on November 29, 2024It is just my view on the Nifty Spot intraday on November 29, 2024. The support and resistance levels given in the picture may vary. However, I have a bullish view on Nifty Intraday. Please note that my view is only for educational purposes but not a recommendation to buy or sell.

#NIFTY Intraday Support and Resistance Levels - 28/11/2024Flat opening expected in nifty. Expected opening near 24300 level. After opening if nifty gives breakout of 24350 level then only expected strong upside bullish rally upto 24550 level. Downside 24050 level will act as an important support for index. Any major downside rally only expected below this level.

Resistance zone of Trendline Mother Line on stopping BullsOn the Daily candles chart of Nifty we can clearly see that Mother line and the trend line resistances are acting upon the Nifty and restricting it's further flight. Today we saw creation of another Doji like Monday. The Gap theory probably is also adding pressure on the Nifty. (Gap Theory is a very interesting subject about which we will sometimes do a special video.) Most of the gaps when a stock or index takes a leap should be filled in future as per the theory (in short). There was a gap up on Monday due to Maharashtra election results. In my opinion not all gaps are supposed to be filled there are some substantial gaps which never get filled. However we will do a webinar on this subject in future some day.
Right now the major resistance zone is here for Bulls this zone starts from 24354 and ends at 24396. Nifty might need some consolidation or strong FII+DII buying to fly above this zone. If this zone is conquered further resistances will be at 24530, 24673, 24893 and 25253. Above 25253 there is pure Bull territory.
Supports on the lower side are at 24135 major support (Higher Cradle of The Gap on Monday), 23948 (Lower cradle of the Gap), 23563 Major support from the 200 days EMA or the Father line, 23362 and finally 23254. Below 23254 we have a strong Bear territory.
To know more about stop losses, trailing stop losses, Profit booking and investment, financial awareness in general, process of investment in Equity or Mother, Father and small child theory read my book The Happy Candles Way to wealth creation . Many People who have read it consider it as hand book and perfect guide to equity investment. You can read reviews of the book or purchase the same from Amazon. The book is available on Amazon in Kindle and paperback version. I am sure you are going to find it of massive use. Once you have read the book, I assure you that you will become a next level investor.
Disclaimer: The above information is provided for educational purpose, analysis and paper trading only. Please don't treat this as a buy or sell recommendation for the stock. We do not guarantee any success in highly volatile market or otherwise. Stock market investment is subject to market risks which include global and regional risks. We will not be responsible for any Profit or loss that may occur due to any financial decision taken based on any data provided in this message.

Review and plan for 28th November 2024 Nifty future and banknifty future analysis and intraday plan.
This video is for information/education purpose only. you are 100% responsible for any actions you take by reading/viewing this post.
please consult your financial advisor before taking any action.
----Vinaykumar hiremath, CMT

NIFTY : Trading levels and Plan for 28-Nov-2024Trading Plan for Nifty - 28th November 2024
Introduction:
On 27th November 2024, Nifty remained range-bound within the Opening Support / No Trade Zone (24,225–24,277), marked by the Yellow Trend, indicating indecision. Attempts to breach the "Opening Resistance Zone" near 24,379 were met with rejection, suggesting the need for stronger momentum to push prices higher. The Last Intraday Support (24,175) held well, showing signs of bullish activity, while the zone 24,096–24,062 acted as a critical reversal area for deeper corrections. The chart also highlights Green Zones for bullish trends and Red Zones for bearish momentum.
Plan for Different Opening Scenarios:
Gap-Up Opening (100+ Points Above Close):
If Nifty opens between 24,379–24,449, the focus should be on price action around the Opening Resistance / Consolidation Zone. A breakout above 24,449 could push Nifty towards the Last Intraday Resistance (24,603), which serves as a key Profit Booking Zone.
Rejection near 24,449 can result in a pullback to 24,379. A failure to hold this level could bring prices back to the "Opening Support Zone" (24,277–24,225).
If Nifty opens directly above 24,449, avoid immediate longs. Wait for retests or pullbacks to 24,449 or 24,379 before entering fresh positions.
Risk Management Tip: Use call spreads (e.g., 24,400 CE - 24,500 CE) to hedge risks and reduce premium exposure.
Flat Opening (Near Previous Close at 24,277):
A flat opening near 24,277 requires patience. Avoid trades within the "No Trade Zone" (24,225–24,277) to prevent getting trapped in sideways movements.
A sustained move above 24,277 can trigger long opportunities targeting 24,379 and 24,449. A breakout above 24,449 can lead to a bullish extension towards 24,603.
On the downside, if Nifty breaks below 24,225, short trades can be considered, targeting 24,175 and 24,096, provided there is an hourly close below these levels.
Risk Management Tip: Deploy straddles or strangles to benefit from potential volatility after a flat opening.
Gap-Down Opening (100+ Points Below Close):
A gap-down opening between 24,175–24,096 requires careful observation for bullish reversal patterns. A strong bounce from the Green Zone (24,096–24,062) can lead to a recovery targeting 24,225 and 24,277.
A breakdown below 24,062 could accelerate selling pressure towards 23,950, opening opportunities for put options or short trades.
Avoid chasing shorts near 24,096 unless there is decisive volume confirming bearish momentum.
Risk Management Tip: Use put spreads (e.g., 24,100 PE - 24,000 PE) to control risk and leverage potential downside moves.
Tips for Risk Management in Options Trading:
Avoid overleveraging in options trading, especially during volatile market conditions.
Use defined stop losses based on hourly candle closures to minimize losses.
Deploy hedging strategies (like spreads) to manage risk and reduce time decay.
Gradually scale into positions to confirm market direction before committing full capital.
Avoid trading against strong momentum; wait for confirmed levels to act.
Summary and Conclusion:
For 28th November 2024, the following levels are critical:
Bullish Trend: Sustained move above 24,277, with targets at 24,379, 24,449, and 24,603.
Bearish Trend: Breakdown below 24,225, with targets at 24,175, 24,096, and potentially lower.
Respect the "No Trade Zone" (24,225–24,277) to avoid false breakouts or choppy movements.
Patience and disciplined execution of the plan will help navigate the market confidently.
Disclaimer:
I am not a SEBI-registered analyst. The above analysis is for educational purposes only. Please conduct your own research or consult with a financial advisor before making trading decisions.

Nifty 28 Nov 2024 zonesBullish zone is above 24330
Bearish zone is below 24220
Note: This is not a buy/sell call. Use stop loss whenever trade.

The Nifty Spot Intraday forecast for November 28, 2024Technically, on November 28, 2024, the Nifty spot intraday trend looks bearish. The Nifty spot resistance is at 24330 and support is at 24070 with a stop-loss at 24365. It is better to avoid intraday buy signals for tomorrow that is on November 28, 2024 and focus on the sell signals.

#NIFTY Intraday Support and Resistance Levels - 27/11/2024Flat opening expected in nifty. After opening important support level for nifty is 24100. Upside 24350 will act as a resistance for today's session. Any major upside rally only expected if nifty starts trading above this resistance level. Downside rally possible if nifty gives breakdown and starts trading below 24100 level.

NIFTY : Trading Levels and Plan for 27-Nov-2024Trading Plan for Nifty - 27th November 2024
Introduction:
On 26th November 2024, Nifty traded within a defined range, with price movements largely respecting key levels. The chart revealed a consolidation phase highlighted by the "No Trade Zone" (Yellow Trend) around 24,238–24,303, indicating indecision among market participants. Bullish momentum (Green Trend) was observed above 24,459, while bearish pressure (Red Trend) dominated below 24,109. The market continues to exhibit structural clarity, with specific levels marking key support and resistance zones.
Plan for Different Opening Scenarios:
Gap-Up Opening (100+ Points Above Close):
If Nifty opens above 24,303 but below 24,459, wait for price action confirmation. A breakout above 24,459 with an hourly candle close suggests bullish momentum towards the Last Resistance for Intraday at 24,603, where profit booking is advisable.
If Nifty opens directly near or above 24,459, avoid immediate entry. Wait for retracement near 24,303–24,459 for a better risk-reward setup.
Monitor bearish rejection candles near 24,459, as this could signal a reversal towards the "No Trade Zone."
Risk Management Tip: For options, consider buying 24,600 CE with strict stop loss based on the hourly close below 24,303.
Flat Opening (Near Previous Close at 24,192):
If the market opens flat, avoid trading immediately within the No Trade Zone (24,238–24,303). Allow the price to break out or break down from this range.
A breakout above 24,303 targets 24,459, while a breakdown below 24,238 may lead to bearish momentum toward 24,109.
Monitor price reaction around 24,109 (Best Buy Zone), where retracement buyers might step in for a potential reversal.
Risk Management Tip: Utilize strategies like selling Iron Condors to capitalize on the consolidation phase while staying protected.
Gap-Down Opening (100+ Points Below Close):
If Nifty opens below 24,109, watch for support around 24,025–24,002. This zone represents the Last Support and is ideal for reversal trades if bullish price action appears.
Avoid chasing shorts immediately after a gap-down. A pullback towards 24,109 could offer safer entry points for bearish trades.
Below 24,002, bearish momentum strengthens, and traders can target 23,900 with appropriate position sizing.
Risk Management Tip: For bearish plays, consider buying 24,000 PE with a stop loss above 24,109.
Tips for Risk Management in Options Trading:
Avoid over-leveraging; use position sizing strategies to manage risk effectively.
Trade liquid contracts to minimize slippage.
Use hedging strategies like spreads to limit maximum losses.
Exit positions early if the market invalidates your levels, rather than holding onto losing trades.
Always base your entries on confirmations such as candlestick patterns, volume, or hourly close signals.
Summary and Conclusion:
For 27th November 2024, the chart suggests a clear game plan with pivotal levels to watch:
Bullish above 24,303, targeting 24,459 and 24,603.
Bearish below 24,109, targeting 24,025 and 24,002.
Avoid trading within the "No Trade Zone" (24,238–24,303) unless a decisive breakout occurs.
By adhering to the plan and practicing disciplined risk management, traders can navigate Nifty's movements effectively.
Disclaimer:
I am not a SEBI-registered analyst. The above analysis is for educational purposes only. Please conduct your research or consult with a financial advisor before taking any trades.

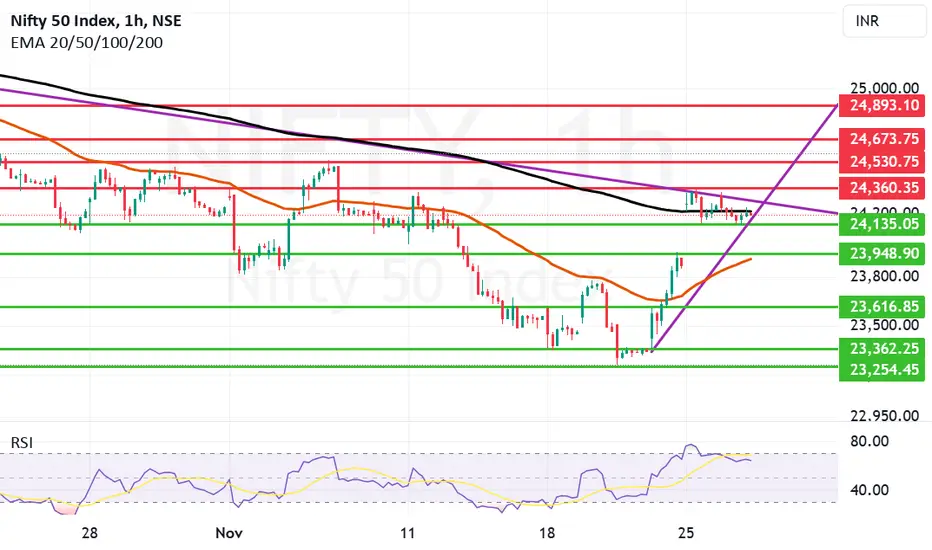
Father Line not allowing Nifty but gap up support holding.Father line of 200 Hours EMA at 24212 has not yet allowed Nifty to fly freely up and above. today again like yesterday we got a closing below at 24194. Overall it was a flat day with positive movements mainly in IT, FMCG, media and Small Cap index.
Once we get a closing above 24212 the next resistance will be at 24360, 24530, 24673 and 24893. After closing above 24893 Nifty has a chance to be in proper Bullish grip. Supports for Nifty on the lower side remain at 24135, 23948 and 23912 (Major Mother line Support of 50 Hours EMA). Below 23912 bears can drag Nifty to 23616, 23362 and finally 23250. Below 23250 Nifty can have a free fall into strong bearish territory.
Disclaimer: The above information is provided for educational purpose, analysis and paper trading only. Please don't treat this as a buy or sell recommendation for the stock. We do not guarantee any success in highly volatile market or otherwise. Stock market investment is subject to market risks which include global and regional risks. We will not be responsible for any Profit or loss that may occur due to any financial decision taken based on any data provided in this message.
#NIFTY Intraday Support and Resistance Levels - 26/11/2024Flat or slightly gap up opening expected in nifty near 24300 level. After opening it will face immediate resistance at this level. In case nifty gives breakout of this level and starts trading above 24350 then expected strong upside rally upto 24550 level in today's session. Downside 24050 level will act as an important support for today's session.
