4 June Nifty50 best trading zone#Nifty50 #option trading
🚀 If you like my trading plan and levels, don't forget to boost the post
99% working trading plan
👉Gap up open 24640 above & 15m hold after positive trade target 24840, 25033
👉Gap up open 24640 below 15m not break upside after nigetive trade target 24390 , 24220
👉Gap down open 24390 above 15m hold after positive trade target 24640
👉Gap down open 24390 below 15m not break upside after nigetive trade target 24220, 24090
📌 Trade plan for education purpose I'm not responsible your trade
More education follow social media and boost my idea
📌 koi bhi trade leval se 20 point ke sl ke bhina karan nahi hi
📌 koi trade app activate tabhi karana hota hi level pe 2 candle uper ya niche closing aati hai to
📌 leval par Ane pe turant trade plan na kare ...
📌 Full risk apaki hi hi meri nahi
Niftytrend

Nifty Analysis EOD – June 3, 2025 – Tuesday🟢 Nifty Analysis EOD – June 3, 2025 – Tuesday 🔴
Opening Sentiment vs. Reality: A Day of Dual Personality
Nifty opened with a 70-point gap-up above the previous day’s high, carrying a positive vibe. In just one minute, it surged another 57 points, marking the day’s high at 24,845. However, that bullish momentum didn’t last. The index faced strong resistance, leading to a sharp 243-point drop within 15 minutes, breaching CPR and the previous swing low to hit the first Current Day Low (CDL) at 24,601.30.
Despite the jolt, Nifty showed resilience—bounced back from the 24,625–24,640 zone, recovered to VWAP, and even retested the PDH. Yet again, it failed to hold above 24,700, echoing the morning's rejection. A second wave of selling took Nifty to a fresh low of 24,502.15 mid-session.
The closing wasn’t any better. Nifty quietly slid again, retested the breakout zone, and closed at 24,542.50, nearly at the intraday low—a day that started with hope ended on a pessimistic note.
Interestingly, India VIX also dropped, despite the downward market move—signalling premium crush and a double whammy for option buyers who got the direction right but profits wrong.
🛡 5 Min Chart with Levels
📊 Daily Summary Highlights
✅ Gap-up Start but sharp reversal
📉 Both PDH and PDL tested intraday
📉 Marubozu Engulfing Candle
⚠️ Closed below Higher Swing Low – a potential trend-shift signal
🕯 Daily Time Frame Chart
🕯 Daily Time Frame Chart
🕯 Daily Candle Breakdown
Open: 24,786.30
High: 24,845.10
Low: 24,502.15
Close: 24,542.50
Net Change: −174.10 (−0.70%)
🕯 Candle Structure
Real Body: 243.80 pts (Big red candle)
Upper Wick: 58.80 pts
Lower Wick: 40.35 pts
Interpretation
A classic bearish reversal day. Price opened higher, reached a new high, but was aggressively sold off, closing near the day’s low. This large-bodied red candle with small wicks shows clear control by the bears.
Candle Type
🟥 Bearish Marubozu-like Candle
Strong rejection at highs
Bearish dominance confirmed
Lower close signals momentum continuation to the downside
Key Insight
24,845 now acts as a firm resistance.
Break below 24,500 could accelerate correction.
Bulls need to defend 24,500–24,520 zone decisively to avoid further weakness.
🛡 5 Min Intraday Chart
⚔️ Gladiator Strategy Update
ATR: 279.13
IB Range: 243.80 → Medium IB
Market Structure: Balanced
Trades:
🔻 12:50 PM – Short Triggered → 📍 1:1 Target Achieved, but timeout
📌 Support & Resistance Zones
Resistance Levels
24,600
24,625 ~ 24,640
24,660
24,727 ~ 24,737
24,768 ~ 24,800
24,820
24,882
24,894 (Strong Resistance)
Support Levels
24,530 ~ 24,480
24,460
24,420 ~ 24,400
24,365 ~ 24,330
24,245 ~ 24,240
💭 Final Thoughts
The market showcased a classic reversal and punished emotional entries. Despite the gap-up euphoria, technical levels reigned supreme. The break below swing low could signal caution for bulls in the coming sessions.
📌 "Respect the levels, not the emotions. Every bounce is not a bottom; every fall isn’t a crash."
✏️ Disclaimer
This is just my personal viewpoint. Always consult your financial advisor before taking any action.

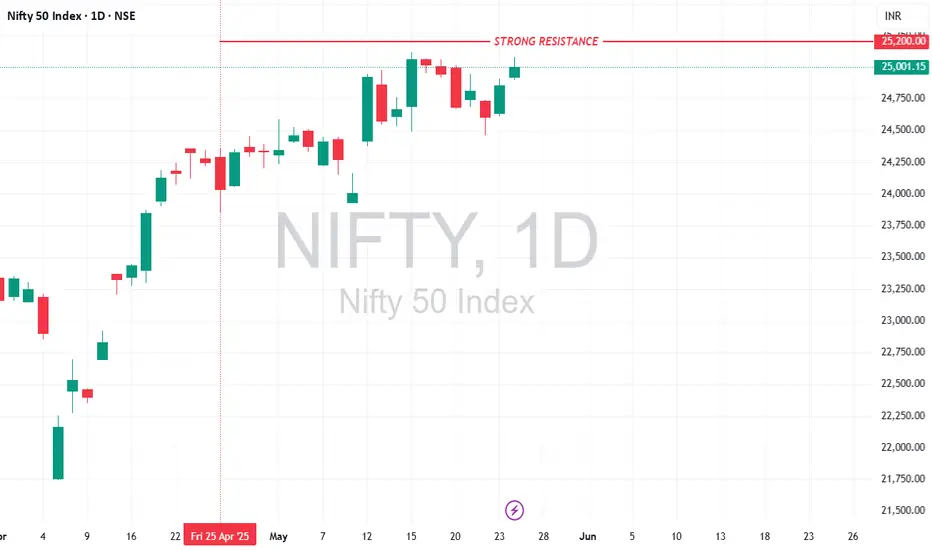
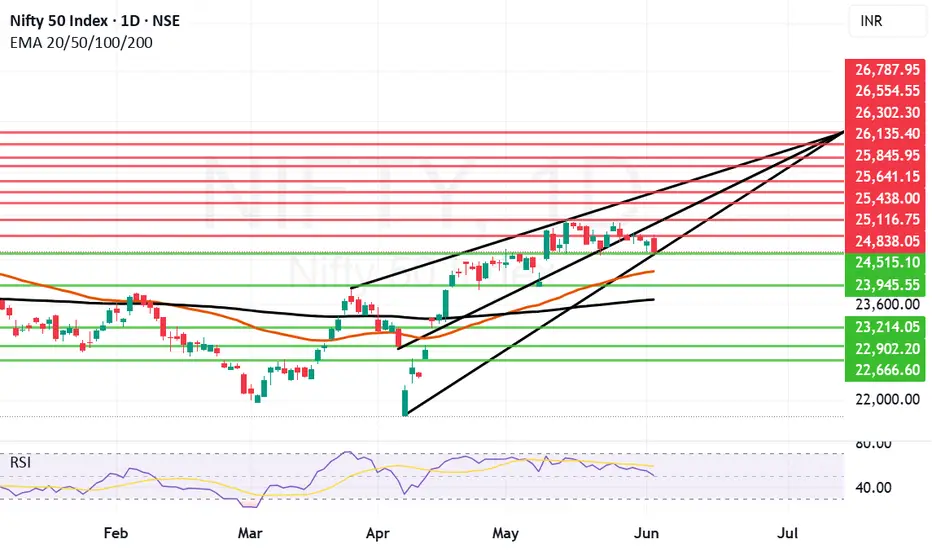
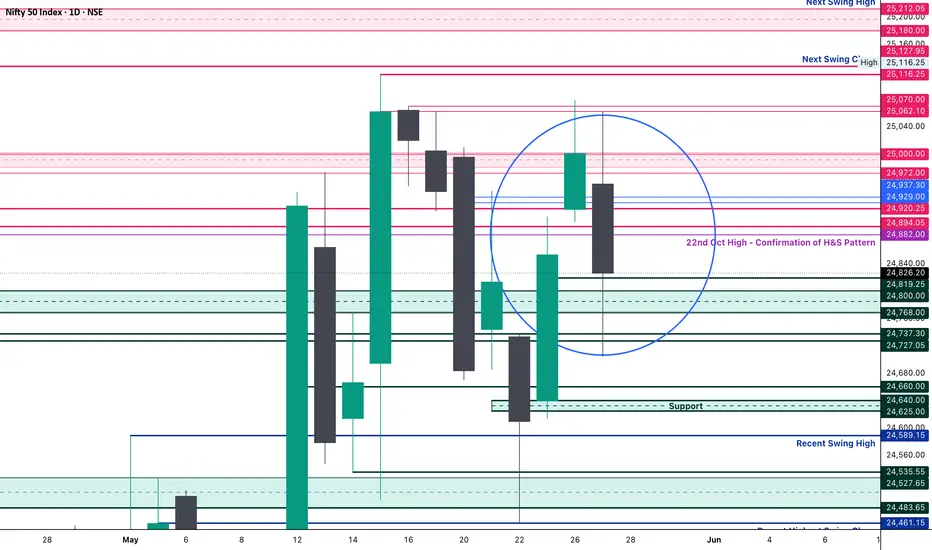
Bull Rally Losing steam as international factors weigh in. The Bull rally that we saw in Nifty in the last one month or so is losing a little steam as international factors related to escalating Russia and Ukraine war and International Tariff war start to weigh in. This made it difficult for Nifty to hold on to levels above 25000 after making a high of 25116 in the current rally. After making a high it is any substantial rally would try to consolidate and find a reasonable bottom from where it can launch again. Verifying a solid support is necessary for rally to move forward.
The supports for Nifty currently are at: 24515, 24185 (Mother line important support), 23945, 23689 (Father line important support). If 23689 is broken the bears will be very active again and can potentially drag down nifty to 23214, 22902 or even 22666. So 24185 and 23689 are important levels for Nifty to hold.
The Resistances for Nifty currently are at: 24838, 25116 (Important Resistance level, recent high). Sustaining above 25116 and Nifty closing above it can enable next leg of the rally which can take us in future to next resistance levels of 25438, 25641, 25845 and 26K+ levels.
The market might be speculating Russian response to Ukraine Drone attack. The scale of Russian attack if it happens will determine the movement of market. The local factors are mostly in favour of Indian markets. So long term investors should not worry. Traders and short term investors should avoid taking unnecessary risk as situation on international front. Geo-Political risk in the subcontinent, at Israel front and Between Russia and other EU nations should be on the hindsight of any decision making. Additionally there are rising number of COVID cases in India which can also become a factor which can effect market sentiment.
Disclaimer: The above information is provided for educational purpose, analysis and paper trading only. Please don't treat this as a buy or sell recommendation for the stock or index. The Techno-Funda analysis is based on data that is more than 3 months old. Supports and Resistances are determined by historic past peaks and Valley in the chart. Many other indicators and patterns like EMA, RSI, MACD, Volumes, Fibonacci, parallel channel etc. use historic data which is 3 months or older cyclical points. There is no guarantee they will work in future as markets are highly volatile and swings in prices are also due to macro and micro factors based on actions taken by the company as well as region and global events. Equity investment is subject to risks. I or my clients or family members might have positions in the stocks that we mention in our educational posts. We will not be responsible for any Profit or loss that may occur due to any financial decision taken based on any data provided in this message. Do consult your investment advisor before taking any financial decisions. Stop losses should be an important part of any investment in equity.
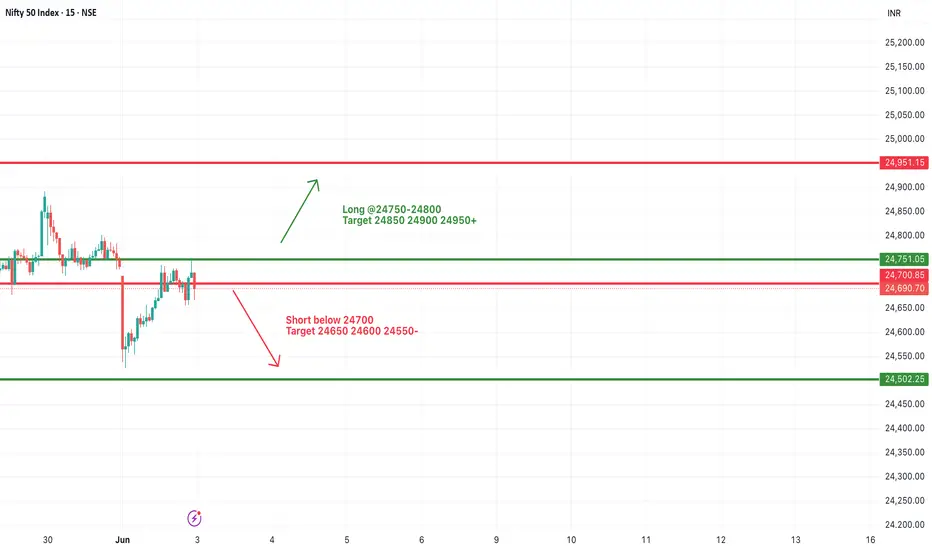
#NIFTY Intraday Support and Resistance Levels - 03/06/2025Nifty is expected to open flat near the 24700 mark, continuing its sideways trend from previous sessions. The index is currently hovering just below the key resistance zone of 24750–24800. A breakout above this level can trigger bullish momentum with upside targets of 24850, 24900, and 24950+. Sustained strength may push the index further toward the 25000–25050 area.
However, if Nifty fails to hold and breaks below 24700, it could lead to bearish pressure. A confirmed breakdown may open downside targets of 24650, 24600, and 24550. Further decline could test the next major support at 24500–24450 levels.
As the market remains range-bound, traders are advised to wait for breakout confirmation with strict stop-loss. Watch for volume and momentum near breakout zones to avoid false signals.
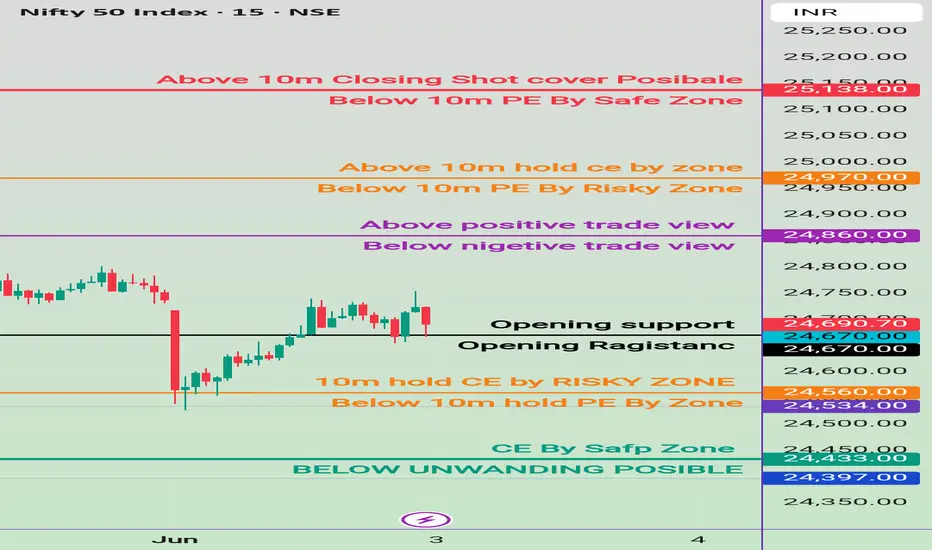
3 june Nifty prediction #Nifty50 #option trading
99% working trading plan
✅ Gap-Up Opening Strategy
🔹 If Nifty opens above 24,860 and hold for 15 mins:
📈 Bullish Trade
🎯 Targets: 24,970
🔹 If Nifty opens at 24,860 but fails to break above after 15 mins:
📉 Bearish Trade
🎯 Targets: 24,670 → 24,560
✅ Gap-Down Opening Strategy
🔹 If Nifty opens above 24,670 and hold for 15 mins:
📈 Bullish Trade
🎯 Targets: 24,860 → 24,970
🔹 If Nifty opens below 24,670 and fails to break above after 15 mins:
📉 Bearish Trade
🎯 Target: 24,560
🎓 For more educational content, follow & support me!
📈 TradingView ID: @mayuraj_820
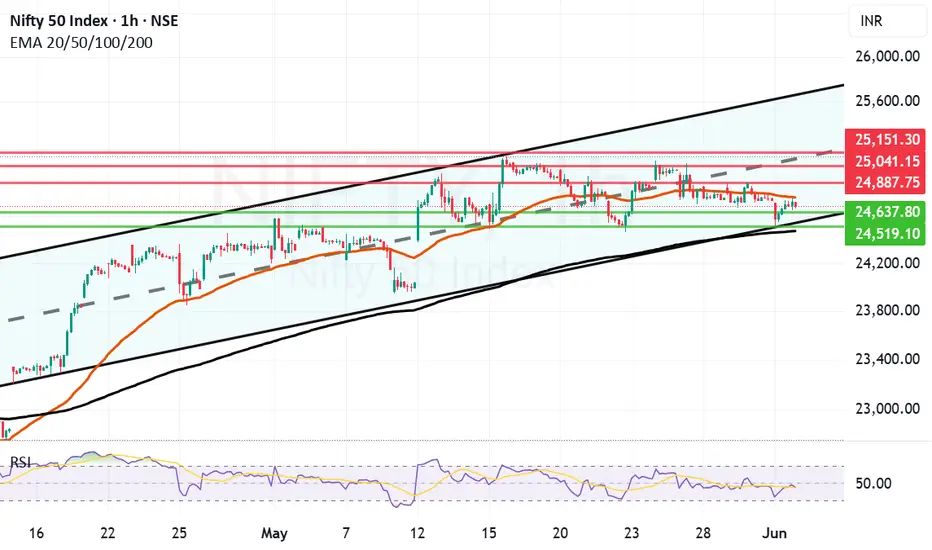
Nifty Bounces from Channel Bottom. Amidst escalation in Ukraine and Russia tussle with Ukraine going on major Drone offensive and Russia likely to respond anytime this week. The escalation can lead to NATO involvement and this can spell a major downside for Global market. The above is just speculation and things can take a different trajectory as well. During such global negative news Indian markets made a low of 24526 but recovered 190 points to close near 24716. This shows the strength of Indian market and shows that we are quiet buoyant.
Resistance for Nifty Remain near: 24763 (Mother Line of Hourly Chart), 24887, 25041 (Mid channel resistance and 25151.
Supports For Nifty Currently remain at: 24637, 24519 (Parallel Channel Bottom) and 24474 (Father Line of Hourly Chart).
If we get a closing below 24474 Bears will have an upper hand and can drag market further down we give the downside levels if we reach there. If we get a closing above 25151 Bulls Will have an Upper hand and can pull the index further upwards we give further upside levels once we reach there.
Disclaimer: The above information is provided for educational purpose, analysis and paper trading only. Please don't treat this as a buy or sell recommendation for the stock or index. The Techno-Funda analysis is based on data that is more than 3 months old. Supports and Resistances are determined by historic past peaks and Valley in the chart. Many other indicators and patterns like EMA, RSI, MACD, Volumes, Fibonacci, parallel channel etc. use historic data which is 3 months or older cyclical points. There is no guarantee they will work in future as markets are highly volatile and swings in prices are also due to macro and micro factors based on actions taken by the company as well as region and global events. Equity investment is subject to risks. I or my clients or family members might have positions in the stocks that we mention in our educational posts. We will not be responsible for any Profit or loss that may occur due to any financial decision taken based on any data provided in this message. Do consult your investment advisor before taking any financial decisions. Stop losses should be an important part of any investment in equity.
Nifty Analysis EOD – June 2, 2025 – Monday🟢 Nifty Analysis EOD – June 2, 2025 – Monday 🔴
“Relaxed day... if you forget the first and last 20 minutes!”
Nifty opened flat with a slightly negative tone and, within the first 20 minutes, collapsed over 200 points, hitting an intraday low of 24,526. However, the day had other plans. A slow and steady recovery followed, with Nifty reclaiming almost all its losses by mid-session. But just when things looked stable, the index shed 88 points in the final 20 minutes, eventually closing at 24,716.60, just 34 points lower than the previous close.
If you ignore the volatility of the first and last few minutes, the day felt calm—almost deceptive. Small and mid-cap stocks, along with Bank Nifty, saw a positive day, showcasing broad market strength despite Nifty’s indecisiveness.
🛡 5 Min Chart with Levels
📌 Diamond Pattern BreakoutAs discussed in yesterday’s note, the diamond pattern on the daily and 5-min chart finally saw a breakout today—and yes, the target was achieved. But let’s be real: with all the action packed into the opening move, most traders (including me) missed the train. A frustratingly textbook pattern—but a tricky execution.
🕯 Daily Time Frame Chart
📊 Daily Candle Breakdown
Open: 24,669.70
High: 24,754.40
Low: 24,526.15
Close: 24,716.60
Change: −34.10 (−0.14%)
Candle Structure:
🟩 Green Candle: Close > Open (46.90 pts body)
🔻 Lower Wick: 143.55 pts – Strong buying at the dip
🔺 Upper Wick: 37.80 pts – Limited rejection from top
Interpretation:Despite closing slightly lower, the candle reflects strong intraday buying after a deep dip. The long lower shadow shows support around 24,520–24,550 is active. Close near the top half signals buyers held their ground after early weakness.
Candle Type:🔨 Hammer-like: Bullish sentiment hidden in the chaos.
Key Insight:
Holding above 24,755 can trigger a fresh bullish leg.
Breach of 24,520 may invite more selling pressure.
🛡 5 Min Intraday Chart
⚔️ Gladiator Strategy Update
ATR: 272.03
IB Range: 191.40 → 🔴 Wide IB
Market Structure: ImBalanced
Total Trades: 0
12:35 – Long signal came, but entry didn’t trigger. No trades taken.
🧭 Support & Resistance Levels
📈 Resistance Zones:
24,727 ~ 24,737
24,768 ~ 24,800
24,820
24,882
24,894
24,920
24,972 ~ 25,000
25,062 ~ 25,070 (5th rejection!)
25,116 ~ 25,128
25,180 ~ 25,212
25,285 ~ 25,399
📉 Support Zones:
24,700
24,660
24,640 ~ 24,625
24,590
24,530 ~ 24,480
24,460
🧠 Final Thoughts
"Structure se hi samjho... market bhale chhup jaye, lekin footprint chhod deta hai."Diamond breakout ho gaya, lekin execution ne dhoka diya. Lesson? Stay ready—patterns repeat, but you only profit if you’re prepared.
✏️ DisclaimerThis is just my personal viewpoint. Always consult your financial advisor before taking any action.
GiftNifty at Best Support !!This is the 4 hour chart of GiftNifty
And GiftNifty having good Law of Polarity at 24500 range
If this level is sustain, then we may see higher prices in GiftNifty
Thank You !!

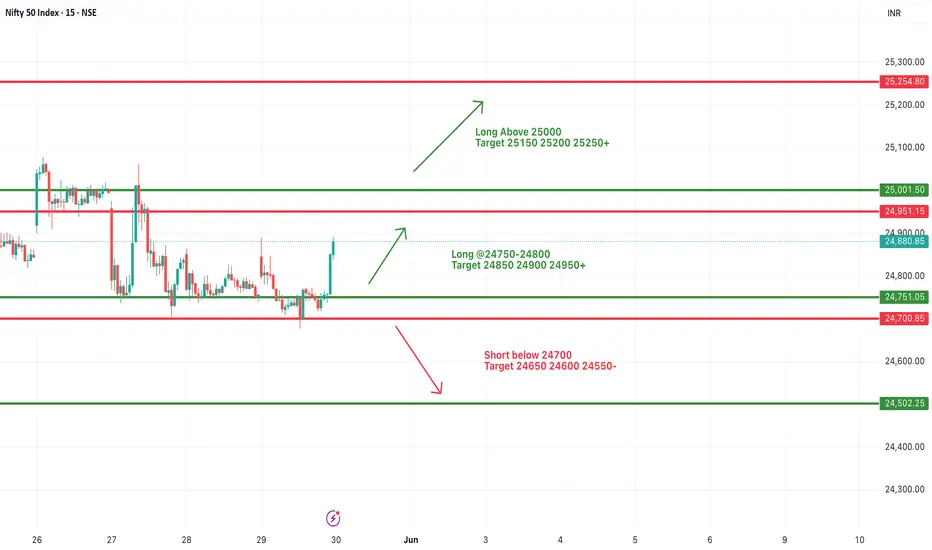
#NIFTY Intraday Support and Resistance Levels - 02/06/2025Nifty is expected to open flat near the 24700–24750 zone. The index has been consolidating in a tight range over the past few sessions, indicating indecision and a potential breakout on either side.
If Nifty sustains above the 24750–24800 zone, a bullish breakout may unfold with upside targets of 24850, 24900, and 24950+. A clear move above 25000 will confirm strong buying momentum with extended targets of 25150, 25200, and 25250+.
On the downside, if Nifty breaks below 24700 and fails to recover, fresh selling pressure could drag the index toward 24650, 24600, and 24550.

Fibonacci Supports and Resistances Medium to Long term Outlook.Here we have tried to show you Fibonacci supports and resistances for Nifty on Monthly chart with Medium to Long term outlook. Fibonacci retracement suggests the nearby major resistances at 25233.
Crossing this zone and closing above this zone is imperative for proper bull market to return. In such a scenario the next resistances will be at 26277 (Previous All Time high). Closing above 26277 will open the door for the targets of 27K+. The Golden ratio of Fibonacci suggest the cap near 29540 within next 13 to 21 months. Supports for Nifty remain at 24443, 23903, 23375.
Below 23375 Bear market can return and can drag Nifty towards unlikely levels of 22737 or 21743. (This looks unlikely as of now but you can never say never looking at the Tariff wars and not so conducive Geo-Political situation of the subcontinent, Russia-Ukraine, Israel and other factors.)
So one eye of investors should be on macro factors also while looking at rosy micro factors related to Indian markets. While we look forward to making new highs in the next 1 or 2 years. Never forget Stop losses / Trailing stop Losses are best friends of investors. Stop losses protect your capital and trailing stop losses protect your profits.
Disclaimer: The above information is provided for educational purpose, analysis and paper trading only. Please don't treat this as a buy or sell recommendation for the stock or index. The Techno-Funda analysis is based on data that is more than 3 months old. Supports and Resistances are determined by historic past peaks and Valley in the chart. Many other indicators and patterns like EMA, RSI, MACD, Volumes, Fibonacci, parallel channel etc. use historic data which is 3 months or older cyclical points. There is no guarantee they will work in future as markets are highly volatile and swings in prices are also due to macro and micro factors based on actions taken by the company as well as region and global events. Equity investment is subject to risks. I or my clients or family members might have positions in the stocks that we mention in our educational posts. We will not be responsible for any Profit or loss that may occur due to any financial decision taken based on any data provided in this message. Do consult your investment advisor before taking any financial decisions. Stop losses should be an important part of any investment in equity.

Nifty Analysis EOD – May 30, 2025 – Friday🟢 Nifty Analysis EOD – May 30, 2025 – Friday 🔴
Whatever gain on Thursday, wiped out... today! classic trap reset day
📌 Opening Note:After Thursday’s expiry surprise rally, today’s session turned out to be a mean reversion reality check. With a 44-point gap-down, Nifty attempted a recovery but failed to cross the previous day’s high — just 27 points shy, and rolled over into selling pressure.
📊 Nifty Summary:
Today’s price action stayed entirely within yesterday’s range, forming an inside bar pattern — a classic sign of indecision before a breakout. The morning attempt towards the high was quickly sold into, and the index retraced straight to PDL, where the previous day’s swing low came to the rescue at 24,717.40. From there, it bounced back to VWAP and stayed rangebound (~60–70 points) for the rest of the session.
By the close, intraday gains of Thursday were completely erased — ending exactly at the breakout zone of yesterday: 24,736.65.
🛡 5 Min Chart with Levels
🪞 Mirror Candle Alert!Interestingly, today’s candle (May 30) closely mimics the May 28 candle in structure and price levels:
High: 24,864.25 ~ 24,863.95 (🔁 0.30 pt diff)
Close: 24,752.45 ~ 24,750.70 (🔁 1.75 pt diff)
Low: 24,737.05 ~ 24,717.40 (🔁 19.65 pt diff)
This pattern alignment forms a diamond shape across the last 3 days (May 28–30), visible clearly on Daily and 5-min charts. This diamond formation + inside bar combo could be a powerful breakout setup — direction to be confirmed by the next session’s range expansion. Check out 5 min and Daily candle chart for visual insight.
🛡 5 Min Chart with Patterns
🕯 Daily Time Frame Chart
📉 Daily Candle Breakdown:
Candle Type: Inside Bar
Structure:
Real Body: Very small
Wick Sizes: Decent on both ends, implying indecision
Interpretation:
Inside bar at the top of a move with a prior hammer-like candle signals pause or reversal.
A break of 24,717 on downside = bearish confirmation
A break of 24,893 on upside = bullish breakout
🛡 5 Min Intraday Chart
⚔️ Gladiator Strategy Update:
ATR: 276.90
IB Range: 83.95 → Small
Market Structure: Balanced
Total Trades: 3
🔹 10:15 – Short triggered → Trailing SL hit @ 1:1.6
🔹 11:30 – Short triggered → 1:1.5 achieved
🔹 13:40 – Short triggered → SL Hit
📌 Support & Resistance Zones:
Resistance:
24,768 ~ 24,800
24,820
24,882
24,894
24,920
24,972 ~ 25,000
25,062 ~ 25,070 (5th rejection!)
25,116 ~ 25,128
25,180 ~ 25,212
25,285 ~ 25,399
Support:
24,737 ~ 24,727
24,700
24,660
24,640 ~ 24,625
24,590
24,530 ~ 24,480
24,460
📌 What’s Next? / Bias Direction:
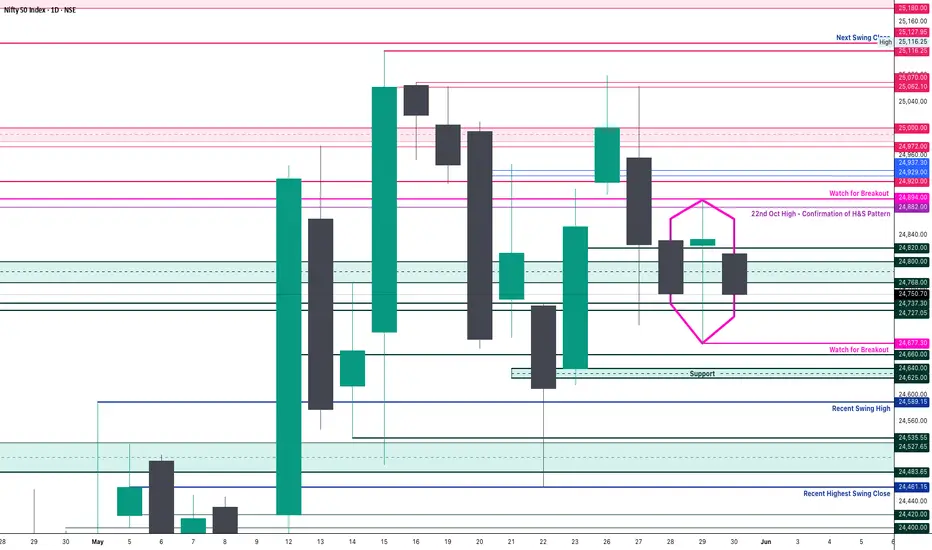
Nifty has compressed into a tight 3-day structure — with a diamond and an inside bar pattern.🎯 Watch for breakout beyond 24,894 or breakdown below 24,677 for directional clarity.Bias remains neutral until price decisively exits this range.
💬 Final Thoughts:
“Breakouts don't lie. Ranges prepare. Patience pays.”
Today was a classic trap reset day. Tomorrow, the trigger might fire. Stay sharp.
✏️ Disclaimer:
This is just my personal viewpoint. Always consult your financial advisor before taking any action.
#NIFTY Intraday Support and Resistance Levels - 30/05/2025Nifty is expected to open flat around the 24800–24850 range. The market has shown signs of recovery from lower levels, and if it manages to hold above the 24800–24850 support zone, we can expect a continuation of upward momentum. In that case, possible intraday upside targets are 24900, 24950, and a breakout beyond 25000 could extend the rally toward 25150, 25200, and 25250+ levels.
However, if Nifty fails to sustain above 24800 and faces resistance near 24900–24950, a pullback may occur. A confirmed breakdown below 24700 would signal weakness and could trigger a fresh round of selling. In such a scenario, downside targets would be 24650, 24600, and possibly 24550.
Today’s session may start off sideways with consolidation between key levels. Wait for clear confirmation above 24850 for longs or below 24700 for shorts. Keep trailing your stop-loss and book partial profits near every target zone.
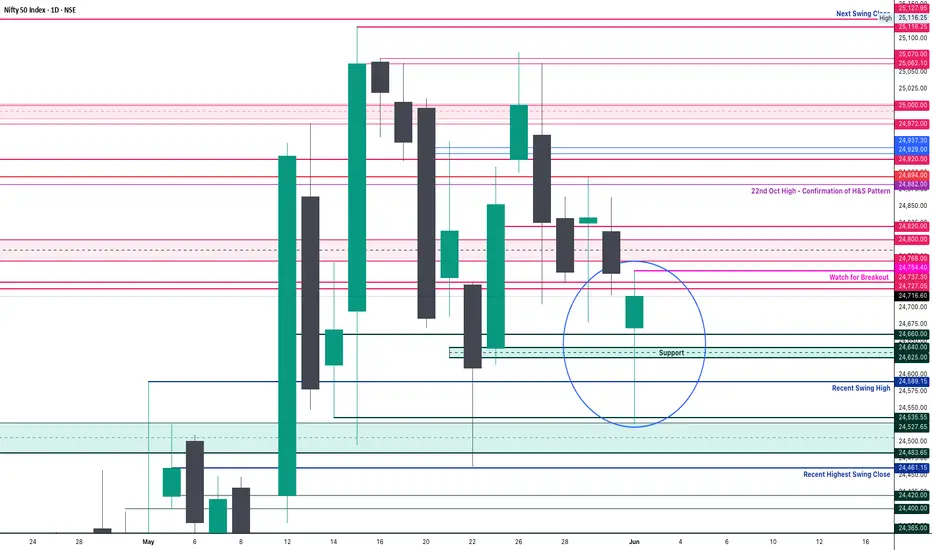
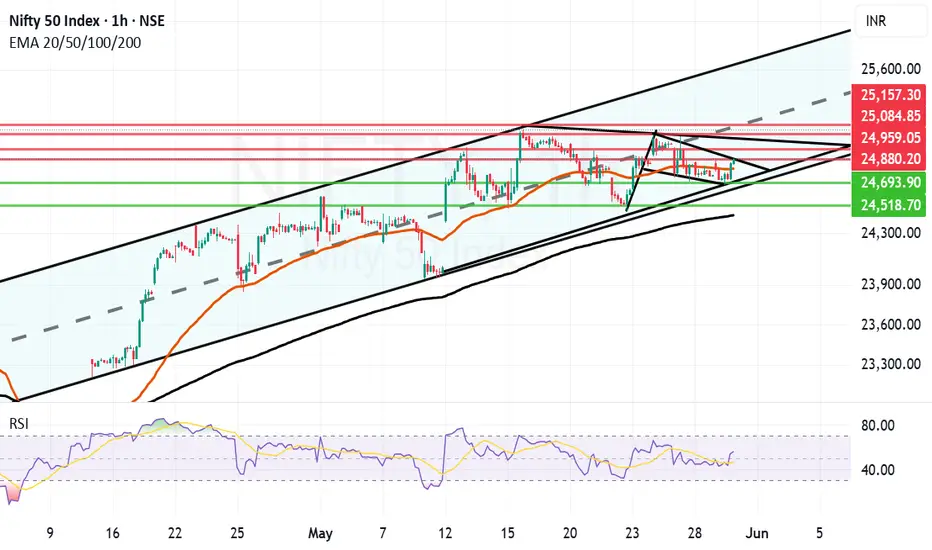
Flag and Pole kind of structure forming in Nifty. There is a very positive looking flag and pole kind of structure forming in Nifty hourly chart. This is within a parallel channel which Nifty has been following since April 15th 2025. This Flag and Pole breakout will come into effect if and only if we get a closing above 24880.
In case of flag and pole breakout happening the future resistances will be near 24959, 25084 and 25157. 25157 again will be a major resistance as it will be the mid of the channel.
The supports for Nifty in case the flag and pole breakout does not take effect are at 24804 (Mother line of hourly chart) 24693, 24518 and finally 24439.
Below 24439 bears can take over the market. Above 25157 Bulls can take over the market. Shadow of the candle is effectively neutral to positive.
Disclaimer: The above information is provided for educational purpose, analysis and paper trading only. Please don't treat this as a buy or sell recommendation for the stock or index. The Techno-Funda analysis is based on data that is more than 3 months old. Supports and Resistances are determined by historic past peaks and Valley in the chart. Many other indicators and patterns like EMA, RSI, MACD, Volumes, Fibonacci, parallel channel etc. use historic data which is 3 months or older cyclical points. There is no guarantee they will work in future as markets are highly volatile and swings in prices are also due to macro and micro factors based on actions taken by the company as well as region and global events. Equity investment is subject to risks. I or my clients or family members might have positions in the stocks that we mention in our educational posts. We will not be responsible for any Profit or loss that may occur due to any financial decision taken based on any data provided in this message. Do consult your investment advisor before taking any financial decisions. Stop losses should be an important part of any investment in equity.
Nifty Analysis EOD – May 29, 2025 – Thursday🟢 Nifty Analysis EOD – May 29, 2025 – Thursday 🔴
Tricky Expiry Day Rollout… Catch or Caught?
🗞 Nifty Summary:
Nifty opened with a gap-up of 88 points at 24,846, making a quick move to 24,889.70—but the bulls couldn’t hold for long. By 10:30, the key support zone at 24,800–24,768 was breached, dragging the index to an intraday low of 24,677.30.
Just when things seemed to be settling into a narrow expiry-day range, a sharp 65-point spike in 3 minutes surprised both sides—creating a mean-reversion V-shape move right back to VWAP and BC levels.
The real twist? A sudden domino-effect breakout at 15:00, marking a fresh high of 24,892.60 and closing at 24,880.85, nearly at the day’s peak.
⏪ Yesterday’s Note Recap:
"Most probable scenario: range-bound day between 24,660 and 24,882... Tricky expiry day."✔️ Spot on. Nifty respected the projected boundaries almost precisely.
🛡 5 Min Chart with Patterns and Levels
📈 Intraday Walk:
09:15 – Gap-up start, optimism in the air.
10:25 – Support at 24,800–24,768 tested and breached.
10:29 – IB Low Break and Day’s low at 24,677.30, bears step in.
12:38 – Surprise spike of 65 points in 3 min
Midday – Consolidation around VWAP and BC levels.
15:00 – Final push leads to breakout above day high → 24,892.60.
Close – Ends at 24,880.85, just below the day high.
🔍 Chart Observations:
✅ Inverse Head & Shoulders pattern formed around 24,768 on the 5-min chart—target achieved.
📦 Box Consolidation Zone repeated from yesterday and respected.
⚠️ Volatility spikes despite being an expiry day—tricky traps for both sides.
🛡 5 Min Chart with Patterns
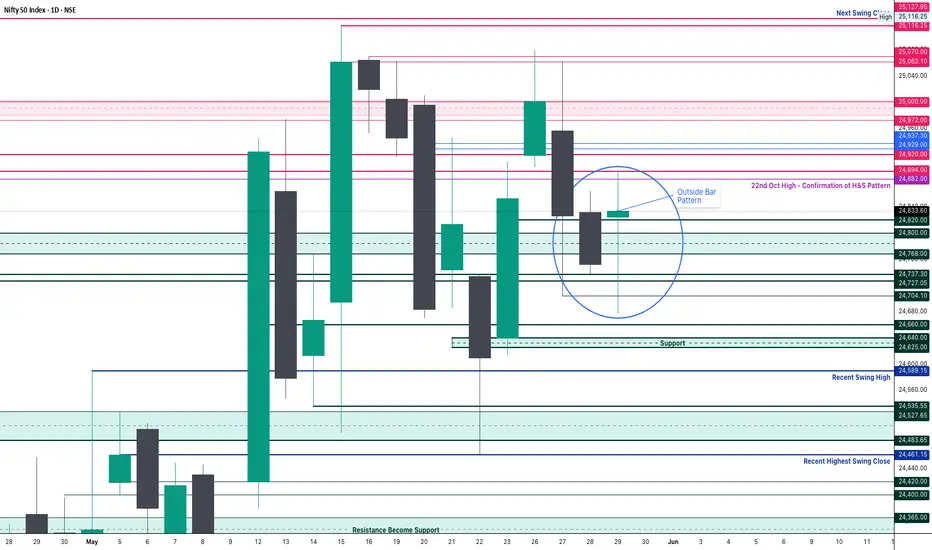
🕯 Daily Time Frame Chart
🕯 Daily Candle Breakdown:
Open: 24,825.10
High: 24,892.60
Low: 24,677.30
Close: 24,833.60
Change: +81.15 (+0.33%)
Candle Structure:
Real Body: +8.50 pts → Tiny green body
Upper Wick: 59.00 pts
Lower Wick: 147.80 pts
Interpretation:A classic Hammer-like candle, showing strong intraday buying from lower zones. Although bulls couldn’t extend gains, they clearly defended 24,700 levels well.
🔔 Pattern Insight:
Outside Bar pattern on Daily → Often a bullish reversal sign
Bullish confirmation comes above 24,890+
Breakdown below 24,677 would invalidate the bullish signal
🛡 5 Min Intraday Chart
⚔️ Gladiator Strategy Update:
ATR: 291.38
IB Range: 110 → Medium
Market Structure: Balanced
Total Trades: 1
🕐 10:25 AM – 1st trade triggered→ Trailing SL hit at 1:3 risk-reward
🧱 Support & Resistance Levels:
Resistance Zones:
24,882
24,894
24,920
24,972 ~ 25,000
25,062 ~ 25,070 (5th rejection!)
25,116 ~ 25,128
25,180 ~ 25,212
25,285 ~ 25,399
Support Zones:
24,820
24,768 ~ 24,800
24,737 ~ 24,727
24,700
24,660
24,640 ~ 24,625
24,590
24,530 ~ 24,480
24,460
🧭 What’s Next?
Above 24,890 → May trigger short-covering rally toward 25,000, 25,065, and 25,116 levels.
Below 24,677 → Expect downside toward 24,625, 24,590, and possibly 24,530.
With expiry behind, volatility may remain elevated tomorrow as new series begins.
📌 Bias: Mild bullish, but needs confirmation above 24,890.
🧠 Final Thoughts:
“Markets don’t trap you; your bias does.”Stay sharp. Today was a day full of whipsaws—but also full of lessons.
✏️ Disclaimer:This is just my personal viewpoint. Always consult your financial advisor before taking any action.
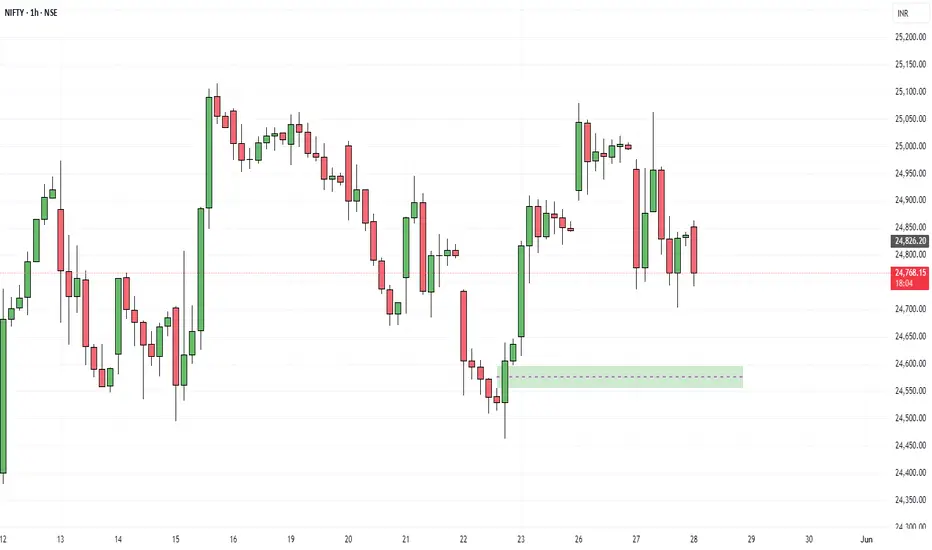
My Recent Trade In Nifty 50 ... On 1 hour time frame nifty is coming to get liquidity on FVG drew here.. after it may go to 25,000. let's see what happens...
#NIFTY Intraday Support and Resistance Levels - 29/05/2025Today, Nifty is expected to open flat near the 24750 level. If it sustains above the 24750–24800 zone, a bullish move is possible with upside targets at 24850, 24900, and 24950+.
Further rally may be seen if Nifty breaks above the 25000 level, aiming for extended targets of 25150, 25200, and 25250+.
On the downside, if Nifty slips below 24700, a bearish trend may unfold with downside targets at 24650, 24600, and 24550.

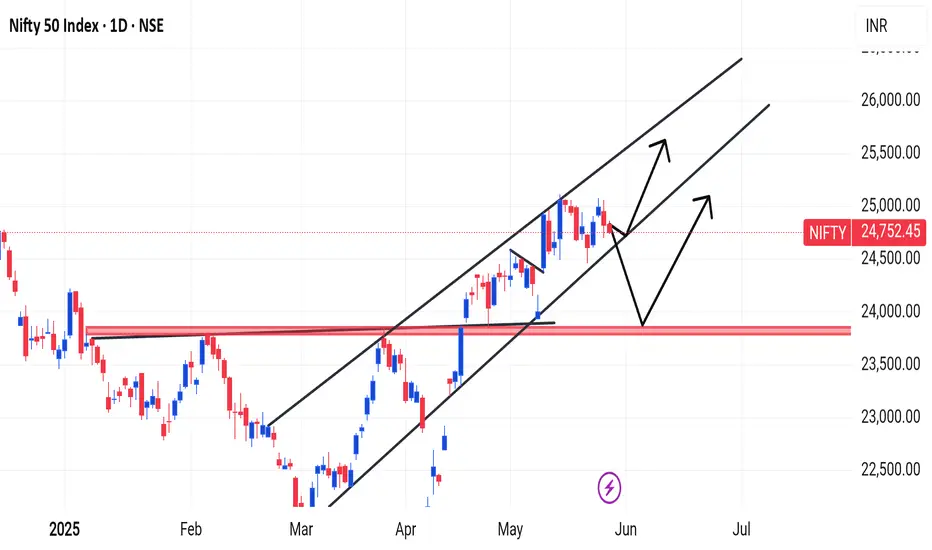
NIFTY 50
1. Ascending Channel:
Nifty is trending within a clear upward (ascending) channel, indicating a bullish trend as long as the price stays within this channel.
2. Support & Resistance:
There is a strong support zone in the range of 24,000–24,200, highlighted by a red-shaded area on the chart.
The current level (24,752.45) is near the middle of the channel and showing signs of minor correction.
3. Two Possible Scenarios (Arrows):
Scenario 1: From the current level, the market could move towards the upper boundary of the channel (around 25,500–26,000).
Scenario 2: There could be a short-term correction (downward movement) first, followed by a bounce from the support zone and then an upward move.
If you find this helpful and want more FREE forecasts in TradingView, Hit the 'BOOST' button
Drop some feedback in the comments below! (e.g., What did you find most useful?
How can we improve?)
Your support is appreciated!
Now, it's your turn!
Be sure to leave a comment; let us know how you see this opportunity and forecast.
Have a successful week
DISCLAIMER: I am NOT a SEBI registered advisor or a financial adviser. All the views are for educational purpose only
Important Level For Nifty.Here in one hour time frame nifty is coming to get some liquidity as you can see, after getting liquidity nifty may again go higher and make a new high.
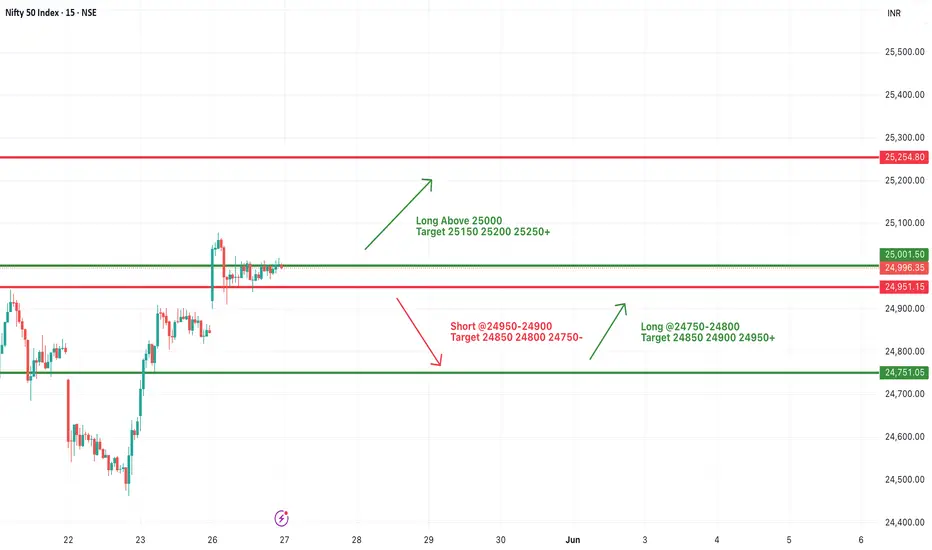
#NIFTY Intraday Support and Resistance Levels - 28/05/2025Today, Nifty is expected to open flat near the 24800–24850 zone. If it sustains above 24800–24750, a bullish move is possible toward 24850, 24900, and 24950+.
Further momentum may be seen if Nifty breaks and holds above 25000, targeting 25150, 25200, and 25250+.
On the downside, if Nifty fails to hold above 24950–24900 and starts slipping below this zone, short trades can be considered with targets of 24850, 24800, and 24750.
A breakdown below 24700 may accelerate selling pressure, leading to extended downside targets of 24650, 24600, and 24550.
Expect choppy moves near key levels — trade with a defined stop loss and lock in profits at each stage.

Nifty Analysis EOD – May 27, 2025 – Tuesday🟢 Nifty Analysis EOD – May 27, 2025 – Tuesday 🔴
Another day, another 25K fight. Bulls tried hard, but bears had the final say — what about tomorrow?
📊 Nifty Summary:
The market opened with a slight gap-down of 38 points at 24,958. Within just 10 minutes, Nifty slid 207 points below the previous day’s low, diving into the 24,768–24,800 zone. It briefly halted around 24,737 — marking the first low of the day — and then suddenly reversed sentiment with a rapid 295-point rally within 45 minutes, breaking CPR, PDH, and even touching the previous week’s high. However, this strength didn’t last long. Gradually, Nifty fell back toward VWAP, broke below the current day low, and formed a new low at 24,704. It eventually closed at 24,826 — above the 24,768–24,800 support zone but below the PDL.
The rally between 24,768 and 25,062 was surprising in both speed and size. It didn't feel like short-covering or fresh buying, but it certainly caught many traders off-guard and likely led to position adjustments.
🛡 5 Min Chart with levels
📉 Intraday Walk:
🔻 Sharp fall within first 10 mins: 24,958 → 24,737
🔼 Sudden spike: 24,737 → 25,062 (rally of 295 points in 45 mins)
🔻 Gradual drop back to VWAP and beyond
🧭 Final dip: new low of 24,704 before recovery
✅ Closed at 24,826 — still above a key support zone
🧠 Key Observations:
Today's low (24,704) aligns near the 0.618 Fibonacci retracement from swing low to PDH — suggesting a potential end to the 3-day retracement phase if it holds.
Fair Value Gap (FVG) from May 22–26 is now filled, suggesting fresh buying interest may re-emerge.
But... closing below PDL (24,900) is a concern and hints at continued pressure.
It’s the fifth day of rejection from the 25,062–25,070 supply zone — a major wall to breach.
🕯 Daily Time Frame Chart
📉 Daily Candle Breakdown:
Open: 24,956.65
High: 25,062.90
Low: 24,704.10
Close: 24,826.20
Change: −174.95 (−0.70%)
🔍 Candle Structure
Real Body: Red (130.45 points) — signifies selling pressure
Upper Wick: 106.25 points — resistance near high
Lower Wick: 122.10 points — buyers tried to fight back➡️ Resembles an Inverted High-Wave Candle: signals indecision with bearish bias
Price volatility was intense. Bulls showed strength mid-day, but bears had better endurance. This candle may lead to further weakness unless buyers reclaim 25,063 quickly.
🛡 5 Min Intraday Chart
🥷 Gladiator Strategy Update
ATR: 314.6
IB Range: 178.7 (Medium)
Market Structure: Imbalanced
🎯 Trade Highlights:
🟥 9:20 Short Trigger → No trade (unfavourable R:R, System not Allow)
🟩 11:30 Long Trigger → SL Hit
🟥 14:20 Short Trigger → SL Hit
📉 Total Trades: 2 (Both hit SL)
Tough day for the system — range extremes and sudden reversals ruled the game.
📌 Support & Resistance Levels
📈 Resistance Zones:
• 24,882 ~ 24,895
• 24,920
• 24,980 ~ 25,000
• 25,062 ~ 25,070 (5th rejection!)
• 25,116 ~ 25,128
• 25,180 ~ 25,212
• 25,285 ~ 25,399
📉 Support Zones:
• 24,768 ~ 24,820
• 24,660
• 24,640 ~ 24,625
• 24,590
• 24,530 ~ 24,480
• 24,460
📌 What’s Next?
If 24,704 holds, bulls may attempt a bounce again.
A close above 25,063 would restore bullish sentiment.
But if 24,700 breaks, we may see deeper correction into lower support zones.
💬 Final Thoughts:
"Market will teach you humility every time you think you've figured it out."Today’s sudden rally followed by a deeper fall reminds us how quickly sentiment can shift. Trade with levels, respect zones, and keep adapting — that’s the only constant.
✏️ Disclaimer:
This is just my personal viewpoint. Always consult your financial advisor before taking any action.
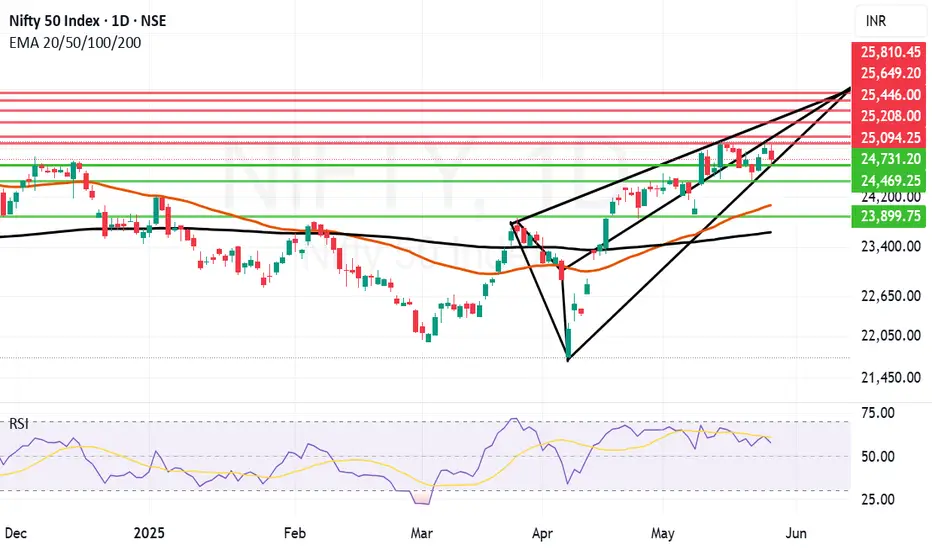
Nifty feeling pressure, unable to sustain above 25K levels.Nifty not able to sustain levels above 25K is not a good news. Nifty has to sustain above 25094 level on daily and 25208 on weekly closing for further upward move. Market is not showing confidence due to daily tariff related news coming for global Power house US. So Volatility will remain for a while till everything falls in place.
Right now Nifty is resting near trend line support levels of 24731. If 24731 is broken Bears can drag Nifty towards 24469, 24067 (Mother line Support), 23899 or even 23637 (Father line support). If Nifty can sustain above 25094 then there is a possibility for up move towards 25208 or even 25446 levels. Things are delicately poised right now and proper Bear Vs Bull Tussle is going on.
Shadow of the candle is neutral to negative but any positive news on global front can change the tide in favour of Bulls.
Disclaimer: The above information is provided for educational purpose, analysis and paper trading only. Please don't treat this as a buy or sell recommendation for the stock or index. The Techno-Funda analysis is based on data that is more than 3 months old. Supports and Resistances are determined by historic past peaks and Valley in the chart. Many other indicators and patterns like EMA, RSI, MACD, Volumes, Fibonacci, parallel channel etc. use historic data which is 3 months or older cyclical points. There is no guarantee they will work in future as markets are highly volatile and swings in prices are also due to macro and micro factors based on actions taken by the company as well as region and global events. Equity investment is subject to risks. I or my clients or family members might have positions in the stocks that we mention in our educational posts. We will not be responsible for any Profit or loss that may occur due to any financial decision taken based on any data provided in this message. Do consult your investment advisor before taking any financial decisions. Stop losses should be an important part of any investment in equity.
#NIFTY Intraday Support and Resistance Levels - 27/05/2025Today, Nifty is expected to open flat near the 25000 level. If it sustains above 25000, we may see bullish momentum toward 25150, 25200, and 25250+. This level is a key breakout zone for further upside.
However, if Nifty fails to hold above 25000 and starts trading below the 24950–24900 zone, a short trade setup may trigger with downside targets of 24850, 24800, and 24750.
Further weakness will be confirmed only if Nifty breaks below 24750–24700, possibly extending the downside to 24600 and 24550.
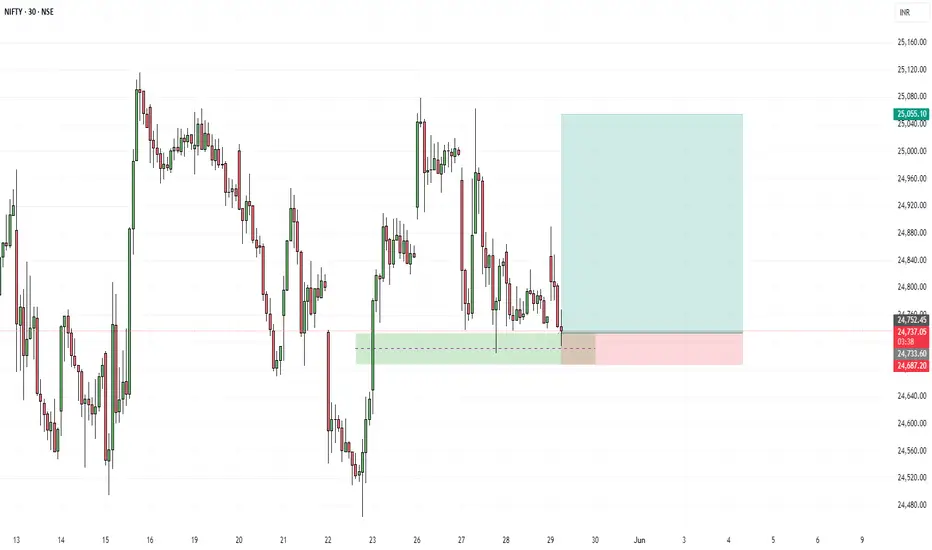
Personal Trade Plan – Nifty50 25100 June Call OptionToday, I entered a long position in the Nifty50 25100 June (Monthly) Call option , securing an average price of ₹469.10 . I plan to accumulate additional lots at lower prices, with a strategy to hold until expiry.
📌 Disclaimer: This is not a trade recommendation. Please conduct independent research and assess risk factors before making any trading decisions.
#nifty50