#NIFTY Intraday Support and Resistance Levels - 03/09/2024Today will be slightly gap up opening expected in nifty. After opening expected upside rally upto 25400+ level. In case nifty starts trading below 25200 then downside fall expected upto 25000 level. Strong bullish rally possible once nifty starts trading above 25450+ level.
Niftytrend

Attempts of Nifty to break free not successfulNifty has attempted multiple times to break free and run wild but it has not succeeded. After making a new high there is consistent bout of profit booking seen. Over a few days now overall market breadth is not on the positive side. This phenomenon is natural when we are making new tops almost every day. Resistances for Nifty at this juncture are at 25330 and 25375. Supports for Nifty remain at 25242, 25193 (Strong support of the trendline) below this level major support will be near 25081 which is a combination of Mid channel support and Mother line support making it a very strong support. If 25081 is broken by any change 24993 will be the only major support remaining before the Nifty falls to Father line support or 24677.
To know the importance of Mother and Father line support and to know about the Mother, Father and the Small child theory of stock market (formulated by me), you need to read my book The Happy Candles Way to Wealth creation available on Amazon in paperback and Kindle version.

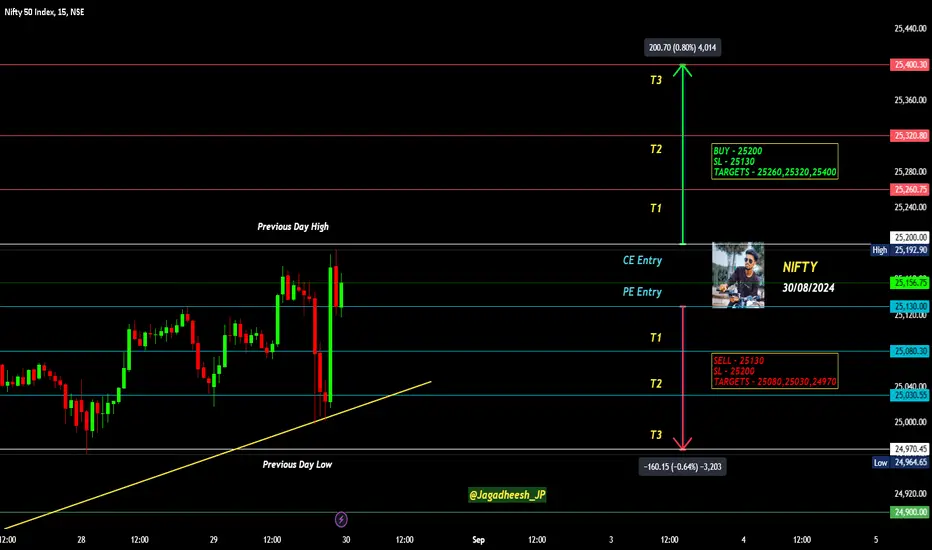
NIFTY INTRADAY LEVELS FOR 03 SEP 2024BUY ABOVE - 25320
SL - 25260
TARGETS - 25400,25470,25530
SELL BELOW - 25260
SL - 25320
TARGETS - 25300,25130,25080
NO TRADE ZONE - 25260 to 25320
Previous Day High - 25320
Previous Day Low - 25260
Based on price action major support & resistance's are here, the red lines acts as resistances, the green lines acts as supports. If the price breaks the support/resistance, it will move to the next support/resistance line. White lines indicates previous day high & low, high acts as a resistance & low acts as a support for next day.
Trendlines are also significant to price action. If the price is above/below the trendlines, can expect an UP/DOWN with aggressive move.
Please NOTE: this levels are for intraday trading only.
Disclaimer - All information on this page is for educational purposes only,
we are not SEBI Registered, Please consult a SEBI registered financial advisor for your financial matters before investing And taking any decision. We are not responsible for any profit/loss you made.
Request your support and engagement by liking and commenting & follow to provide encouragement
HAPPY TRADING 👍

BAJAJ FINANCE Bullish PatternBajaj finance
weekly Breakout
buying level 7440
target as show in chart
stoploss follow

Nifty 50 - MovementNifty 50 NSE:NIFTY Movement that am mentioning here is for Educational Purpose so that you can be prepared.
As far as i have expedited this will continue until 25,390 and there should be Retracement. i.e, it will move the 1 % and there is less chance to move 1.618% which is 26,320 without a Retracement.
Let's wait and see how this goes!

#NIFTY Intraday Support and Resistance Levels - 02/09/2024Gap up opening in nifty. Expected opening near 25400 level. After opening if nifty starts trading above 25450 level then possible strong upside rally upto 25600+ level in today's session. 25400 level will act as a resistance for today's session. Expected some correction from this level. Downside 25250 level will strong support for nifty.

NIFTY INTRADAY LEVELS FOR 02 SEP 2024BUY ABOVE - 25260
SL - 25200
TARGETS - 25320,25400,25470
SELL BELOW - 25200
SL - 25260
TARGETS - 25130,25080,25030
NO TRADE ZONE - 25200 to 25260
Previous Day High - 25260
Previous Day Low - 25200
Based on price action major support & resistance's are here, the red lines acts as resistances, the green lines acts as supports. If the price breaks the support/resistance, it will move to the next support/resistance line. White lines indicates previous day high & low, high acts as a resistance & low acts as a support for next day.
Trendlines are also significant to price action. If the price is above/below the trendlines, can expect an UP/DOWN with aggressive move.
Please NOTE: this levels are for intraday trading only.
Disclaimer - All information on this page is for educational purposes only,
we are not SEBI Registered, Please consult a SEBI registered financial advisor for your financial matters before investing And taking any decision. We are not responsible for any profit/loss you made.
Request your support and engagement by liking and commenting & follow to provide encouragement
HAPPY TRADING 👍

Nifty50 analysis for next week 2nd Sept-6th Sept 2024#Nifty surged to a new all-time high of 25236 this week, gaining nearly 400 points from the previous week's close. As predicted, the market remained within the 25500-24200 range.
For the coming week, I anticipate Nifty to trade between 25850 and 24600 . A break above or below these levels could trigger significant price movements. If Nifty can sustain above 25300, it might reach 25400, 25568, 25650, or even 25809 (a crucial resistance level).
While the weekly RSI is showing signs of a bearish M pattern, I believe Nifty needs to reach 25500 or 25800 before a significant decline. Overall, for coming week market remains bullish.
The S&P 500 closed just above the important Fibonacci level of 5637. A break above 5670 could lead to gains towards 5700, 5806, or even 6142, which would likely benefit Indian markets. However, a breakdown below 5550 could trigger a sell-off, with potential support levels at 5486, 5373, and 5180. Such a scenario would have negative implications for global markets, including India.

Dalmia Bharat next week target 1860Dalmia Bharat could be a good stock for the next week which looks better as per technical analysis, the stock is up trending on the daily chart. The stock is trading 53% on the daily chart as per the RSI indicator, indicating the strength of the stock. This stock can prove to be a better option for buying next week.

Bharti Airtel next week target 1540, 1580Bharti Airtel may see good bullishness in the next week, the stock has broken the range of the last three weeks, the stock is currently above 64 % on the daily chart on the RSI indicator, indicating the strength of the stock. The stock is just above the particular golden moving average we discovered. The stock can see an increase of 3 to 5 percent next week.
#NIFTY Intraday Support and Resistance Levels - 30/08/2024Gap up opening expected in nifty above 25250 level. After opening if nifty sustain above 25200 level then possible upside rally upto 25500+ level in today's session. Any downside only expected below 25150 level.
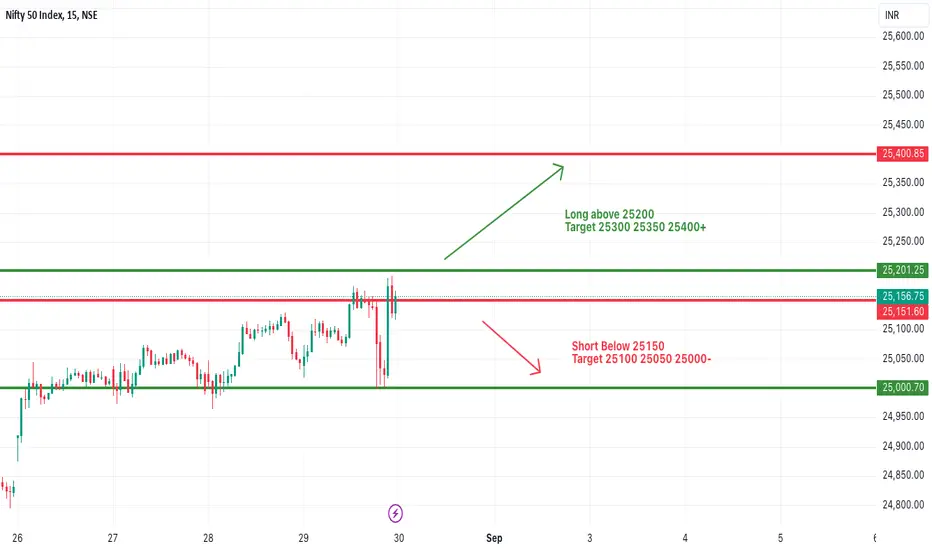
NIFTY INTRADAY LEVELS FOR 30 AUG 2024BUY ABOVE - 25200
SL - 25130
TARGETS - 25260,25320,25400
SELL BELOW - 25130
SL - 25200
TARGETS - 25080,25030,24970
NO TRADE ZONE - 25130 to 25200
Previous Day High - 25200
Previous Day Low - 24970
Based on price action major support & resistance's are here, the red lines acts as resistances, the green lines acts as supports. If the price breaks the support/resistance, it will move to the next support/resistance line. White lines indicates previous day high & low, high acts as a resistance & low acts as a support for next day.
Trendlines are also significant to price action. If the price is above/below the trendlines, can expect an UP/DOWN with aggressive move.
Please NOTE: this levels are for intraday trading only.
Disclaimer - All information on this page is for educational purposes only,
we are not SEBI Registered, Please consult a SEBI registered financial advisor for your financial matters before investing And taking any decision. We are not responsible for any profit/loss you made.
Request your support and engagement by liking and commenting & follow to provide encouragement
HAPPY TRADING 👍
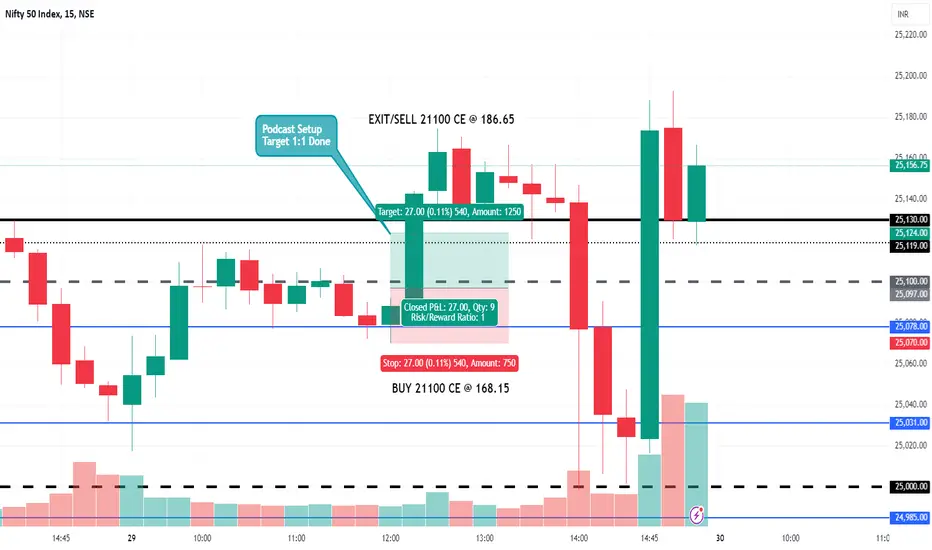
Nifty Podcast 29 Aug 20241 trade was taken today as per podcast levels.
The OI data was positive and also the 4 departments clearly showed "Bullish Signs".
Note:
- Since today was expiry of NIFTY, so credit spread would've rewarded the long holding time before the big move happened.
Nifty Positional Trading PlanThe market continued to consolidate while maintaining its upward momentum
for the ninth consecutive session and hit a new Nifty 50 closing high on 28th August.
The rise of 0. 14 per cent to 25,052 points formed a doji like
candlestick pattern indicating consolidation and indecision among buyers and
sellers on future market trends. US stock markets fell across the board
overnight and Asia opened today with a correction, creating instability in the domestic market. The bulls may weaken after consecutive rallies and the
market is expected to remain consolidated on the monthly F&O expiry date.
Important resistance above is at 25, 100 pips,
while short-term key support
appears at 24,950 pips, at 5-day EMA level.
Nifty Options
For call option data, the highest number of open positions is at 25,500 strike, which can act as a key
resistance level for Nifty in the short term. In put options, the highest number of open positions is at
25,000 strike, which can act as a key support level for Nifty.
August F&O expires and can be shifted to September F&O to open new positions. Longs have shown weakness and remain short for the next few
sessions, today one can focus on NIFTY SEP 24500 PE and enter new position at 135-150 with scheduled profit of 15%.
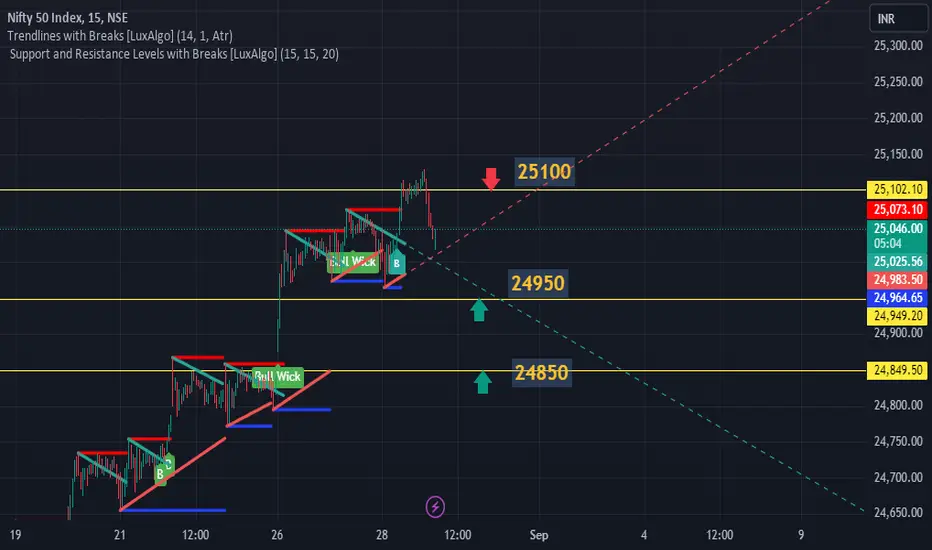
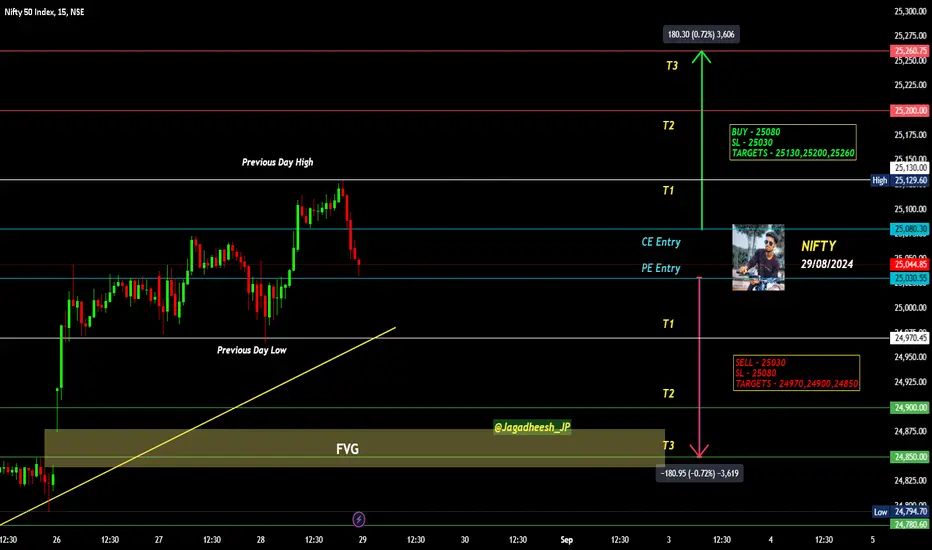
NIFTY INTRADAY ANALYSIS FOR 29/08/2024BUY ABOVE - 25080
SL - 25030
TARGETS - 25130,25200,25260
SELL BELOW - 25030
SL - 25080
TARGETS - 24970,24900,24850
NO TRADE ZONE - 25030 to 25080
Previous Day High - 25130
Previous Day Low - 24970
Based on price action major support & resistance's are here, the red lines acts as resistances, the green lines acts as supports. If the price breaks the support/resistance, it will move to the next support/resistance line. White lines indicates previous day high & low, high acts as a resistance & low acts as a support for next day.
Trendlines are also significant to price action. If the price is above/below the trendlines, can expect an UP/DOWN with aggressive move.
Please NOTE: this levels are for intraday trading only.
Disclaimer - All information on this page is for educational purposes only,
we are not SEBI Registered, Please consult a SEBI registered financial advisor for your financial matters before investing And taking any decision. We are not responsible for any profit/loss you made.
Request your support and engagement by liking and commenting & follow to provide encouragement
HAPPY TRADING 👍
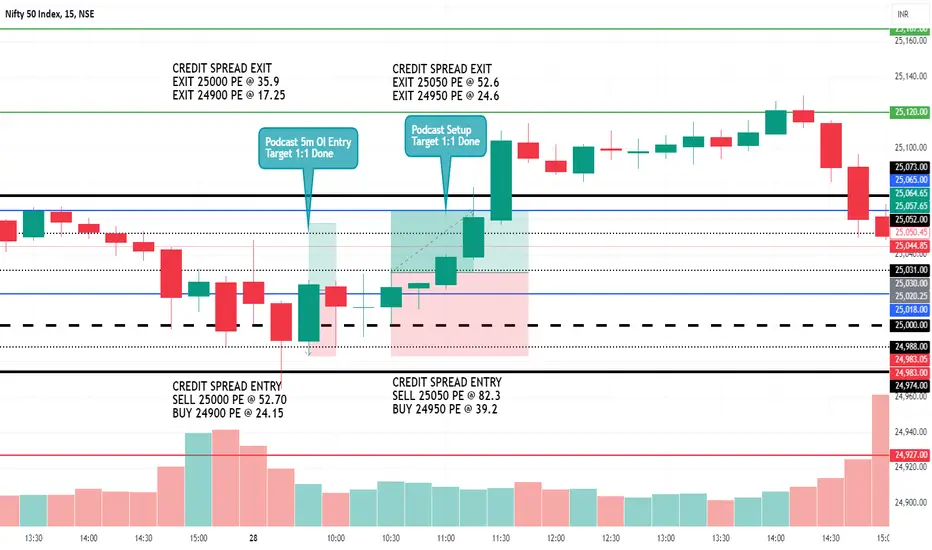
NIFTY Podcast 28 Aug 2024Two trades were taken today.
1st trade was on OI line entry on 5min timeframe. It was taken with Credit Spread, because I was expecting the market to be sideways and also take advantage of decay in premium prices.
2nd trade was on Podcast levels, again with Credit Spread to take advantage of decay in premium prices.
Notes:
- Credit Spread works when market is sideways or there's 50% risk to be taken
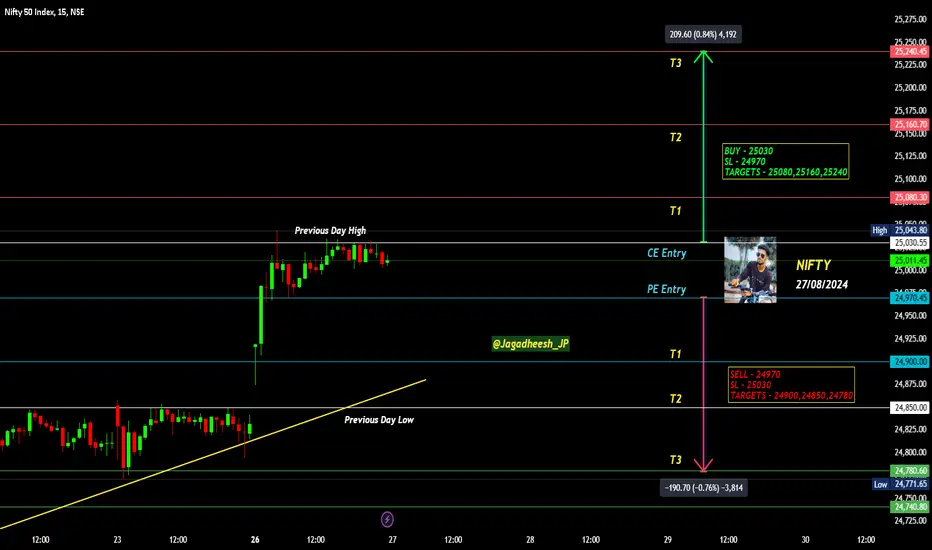
NIFTY INTRADAY LEVELS FOR 28/08/2024BUY ABOVE - 25030
SL - 24970
TARGETS - 25080,25160,25240
SELL BELOW - 24970
SL - 25030
TARGETS - 24900,24850,24780
NO TRADE ZONE - 24970 to 25030
Previous Day High - 25080
Previous Day Low - 24970
Based on price action major support & resistance's are here, the red lines acts as resistances, the green lines acts as supports. If the price breaks the support/resistance, it will move to the next support/resistance line. White lines indicates previous day high & low, high acts as a resistance & low acts as a support for next day.
Trendlines are also significant to price action. If the price is above/below the trendlines, can expect an UP/DOWN with aggressive move.
Please NOTE: this levels are for intraday trading only.
Disclaimer - All information on this page is for educational purposes only,
we are not SEBI Registered, Please consult a SEBI registered financial advisor for your financial matters before investing And taking any decision. We are not responsible for any profit/loss you made.
Request your support and engagement by liking and commenting & follow to provide encouragement
HAPPY TRADING 👍

NIFTY INTRADAY LEVELS FOR 27/08/2024BUY ABOVE - 25030
SL - 24970
TARGETS - 25080,25160,25240
SELL BELOW - 24970
SL - 25030
TARGETS - 24900,24850,24780
NO TRADE ZONE - 24970 to 25030
Previous Day High - 25030
Previous Day Low - 24850
Based on price action major support & resistance's are here, the red lines acts as resistances, the green lines acts as supports. If the price breaks the support/resistance, it will move to the next support/resistance line. White lines indicates previous day high & low, high acts as a resistance & low acts as a support for next day.
Trendlines are also significant to price action. If the price is above/below the trendlines, can expect an UP/DOWN with aggressive move.
Please NOTE: this levels are for intraday trading only.
Disclaimer - All information on this page is for educational purposes only,
we are not SEBI Registered, Please consult a SEBI registered financial advisor for your financial matters before investing And taking any decision. We are not responsible for any profit/loss you made.
Request your support and engagement by liking and commenting & follow to provide encouragement
HAPPY TRADING 👍
NIFTY Podcast 26 Aug 2024Again on NIFTY, took only 1 trade with Gap up/down strategy.
1:1 target achieved right away in the second candle itself.
Notes:
- Closed early due to peer pressure of reaching or closing the targets. Next time, will mute all groups or channels to focus on the trade itself.
- There was another entry based on podcast strategy, but neither it hit the target nor it hit the stoploss. Second trade can always be debit spread or credit spread to avoid loss in the decay in the premiums of naked buying options.

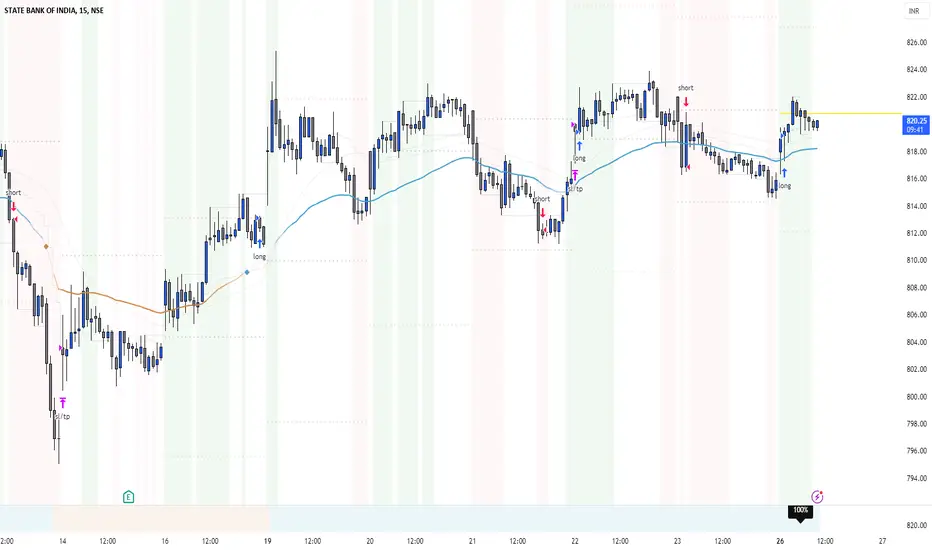
SBIN#SBIN : Consider going long on SBIN if it manage to cross 820.80 - 821. It has room for 9 more points. (829 -830)
Review and plan for 26th August 2024Nifty future and banknifty future analysis and intraday plan in kannada.
Positional idea- included.
This video is for information/education purpose only. you are 100% responsible for any actions you take by reading/viewing this post.
please consult your financial advisor before taking any action.
----Vinaykumar hiremath, CMT

NIFTY INTRADAY LEVELS FOR 26/08/2024BUY ABOVE - 24850
SL - 24780
TARGETS - 24900,24960,25020
SELL BELOW - 24780
SL - 24850
TARGETS - 24740,24700,24660
NO TRADE ZONE - 24780 to 24850
Previous Day High - 24850
Previous Day Low - 24780
Based on price action major support & resistance's are here, the red lines acts as resistances, the green lines acts as supports. If the price breaks the support/resistance, it will move to the next support/resistance line. White lines indicates previous day high & low, high acts as a resistance & low acts as a support for next day.
Trendlines are also significant to price action. If the price is above/below the trendlines, can expect an UP/DOWN with aggressive move.
Please NOTE: this levels are for intraday trading only.
Disclaimer - All information on this page is for educational purposes only,
we are not SEBI Registered, Please consult a SEBI registered financial advisor for your financial matters before investing And taking any decision. We are not responsible for any profit/loss you made.
Request your support and engagement by liking and commenting & follow to provide encouragement
HAPPY TRADING 👍

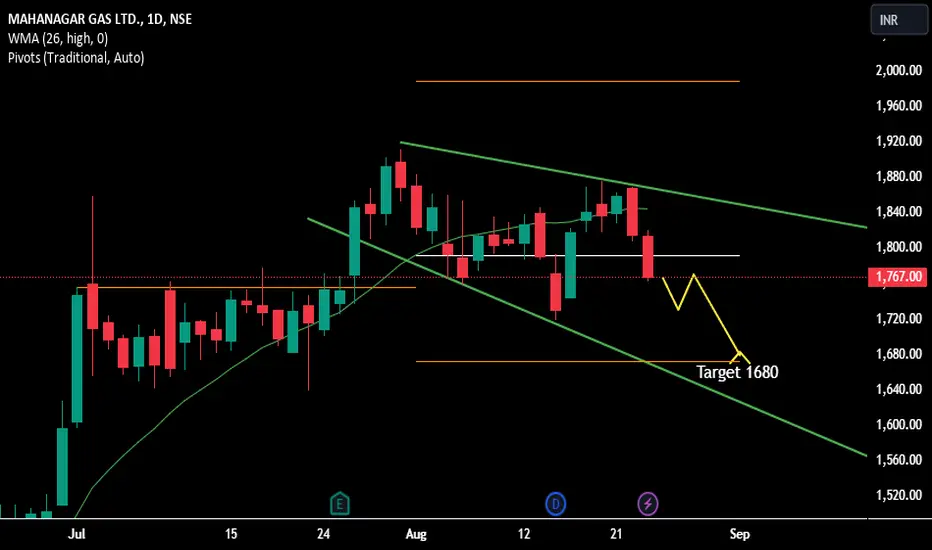
MGL Next Week Downside Target 1680MGL may see a downside trend next week, with the stock moving downwards with lower low formations on the daily chart frame. The stock is also down by 50% on the RSI indicator. The stock is also seen in a downtrend on our golden moving average, with a small stop loss that could lead to selling in the stock next week.