NIFTY INTRADAY LEVELS FOR 08/08/2024BUY ABOVE - 24360
SL - 24270
TARGETS - 24440,24530,24590
SELL BELOW - 24200
SL - 24270
TARGETS - 24130,24010,23900
NO TRADE ZONE - 24200 to 24360
Previous Day High - 24360
Previous Day Low - 24200
Based on price action major support & resistance's are here, the red lines acts as resistances, the green lines acts as supports. If the price breaks the support/resistance, it will move to the next support/resistance line. White lines indicates previous day high & low, high acts as a resistance & low acts as a support for next day.
Trendlines are also significant to price action. If the price is above/below the trendlines, can expect an UP/DOWN with aggressive move.
Please NOTE: this levels are for intraday trading only.
Disclaimer - All information on this page is for educational purposes only,
we are not SEBI Registered, Please consult a SEBI registered financial advisor for your financial matters before investing And taking any decision. We are not responsible for any profit/loss you made.
Request your support and engagement by liking and commenting & follow to provide encouragement
HAPPY TRADING 👍
Niftytrend

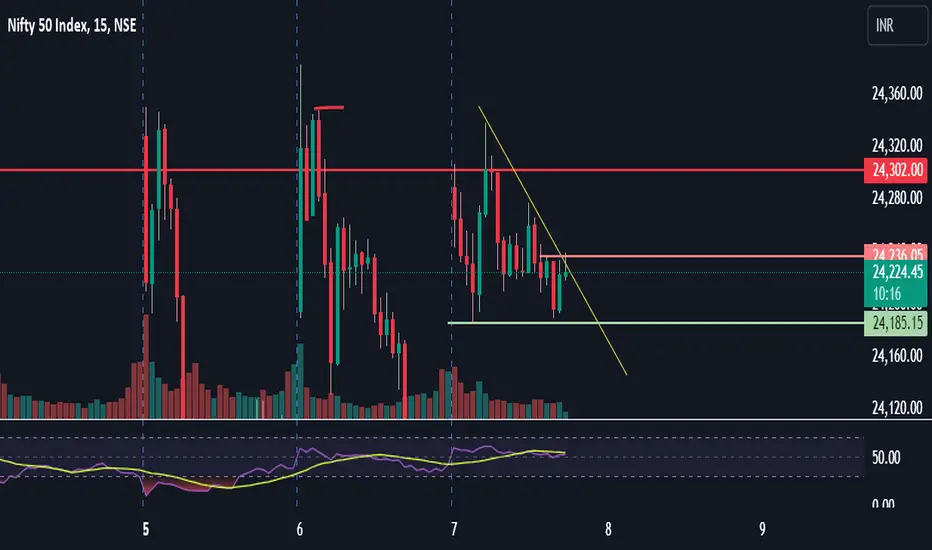
Nifty live predection and analysis for intradayNifty looking bullish
if sellers again try to push towards support and break resistance then upmove is expected
watch chart on 5 min.
THIS OVERVIEW IS FOR VERY SHORT PERIOD.
Disclaimer: Any of my posts should not be considered as a Buy/ Sell/Hold recommendation. This analysis is for educational and learning purpose only.
I always recommend using Stop Loss and following risk management rules.
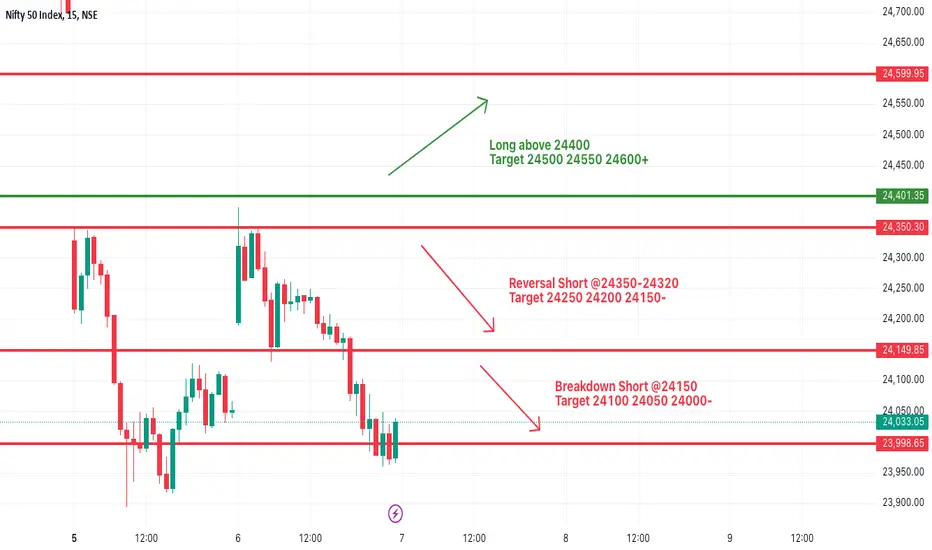
#NIFTY Intraday Support and Resistance Levels - 07/08/2024In today's session, Nifty will open gap up near 24350 level. After opening expected reversal in nifty upto 24150 level and this downside rally extend upto 24000 level in case nifty gives breakdown of 24150 level. Any upside rally only expected above 24400 level.
NIFTY INTRADAY LEVELS FOR 07/08/2024BUY ABOVE - 24130
SL - 24010
TARGETS - 247220,24360,24440
SELL BELOW - 24010
SL - 24130
TARGETS - 23900,23800,23740
NO TRADE ZONE - 24010 to 24130
Previous Day High - 24360
Previous Day Low - 23900
Based on price action major support & resistance's are here, the red lines acts as resistances, the green lines acts as supports. If the price breaks the support/resistance, it will move to the next support/resistance line. White lines indicates previous day high & low, high acts as a resistance & low acts as a support for next day.
Trendlines are also significant to price action. If the price is above/below the trendlines, can expect an UP/DOWN with aggressive move.
Please NOTE: this levels are for intraday trading only.
Disclaimer - All information on this page is for educational purposes only,
we are not SEBI Registered, Please consult a SEBI registered financial advisor for your financial matters before investing And taking any decision. We are not responsible for any profit/loss you made.
Request your support and engagement by liking and commenting & follow to provide encouragement
HAPPY TRADING 👍

NIFTY BUY!!After huge dump from yesterday, Asian stock markets today have recovered, Japans nikkei has posted highest gain since 2008 today, nifty may try to fill the gap
Buy after 15 min close of candle

Review and plan for 6th August 2024Nifty future and banknifty future analysis and intraday plan in kannada.
This video is for information/education purpose only. you are 100% responsible for any actions you take by reading/viewing this post.
please consult your financial advisor before taking any action.
----Vinaykumar hiremath, CMT

NIFTY INTRADAY ANALYSIS FOR 06 AUG 2024BUY ABOVE - 24130
SL - 23990
TARGETS - 247220,24360,24440
SELL BELOW - 23990
SL - 24130
TARGETS - 23900,23800,23740
NO TRADE ZONE - 23990 to 24130
Previous Day High - 24360
Previous Day Low - 23900
Based on price action major support & resistance's are here, the red lines acts as resistances, the green lines acts as supports. If the price breaks the support/resistance, it will move to the next support/resistance line. White lines indicates previous day high & low, high acts as a resistance & low acts as a support for next day.
Trendlines are also significant to price action. If the price is above/below the trendlines, can expect an UP/DOWN with aggressive move.
Please NOTE: this levels are for intraday trading only.
Disclaimer - All information on this page is for educational purposes only,
we are not SEBI Registered, Please consult a SEBI registered financial advisor for your financial matters before investing And taking any decision. We are not responsible for any profit/loss you made.
Request your support and engagement by liking and commenting & follow to provide encouragement
HAPPY TRADING 👍

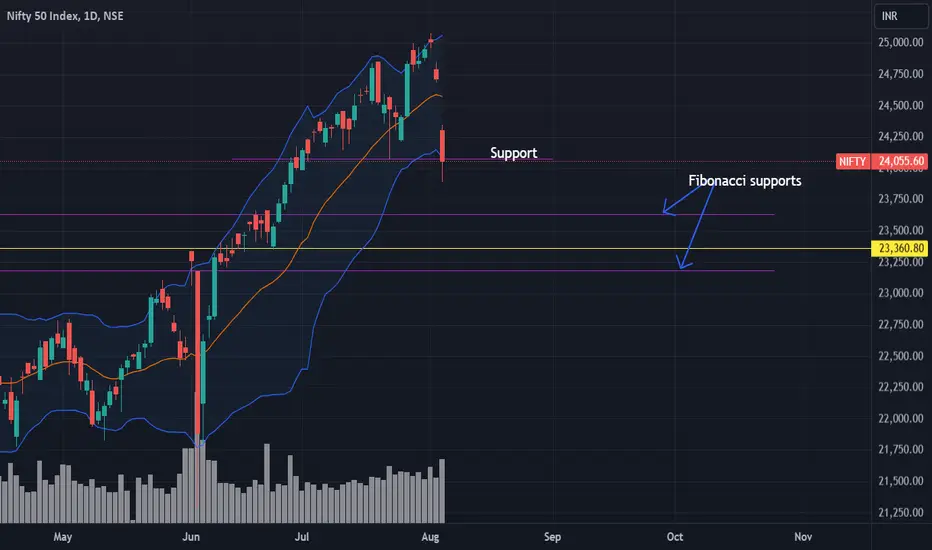
NIfty Analysis support and resistence1. Nifty 50 Index Overview:
- The Nifty 50 Index represents the top 50 stocks by market capitalization on the National Stock Exchange of India (NSE). It covers 13 sectors of the Indian economy and serves as a benchmark for fund portfolios and index funds.
- As of the most recent data, the Nifty 50 has been performing well, with a year-to-date gain of 14.31% and a 1-year return of 26.33%.
2. Recent Market Movements:
- On July 23, 2024, after the Union Budget presentation, the Nifty experienced a slight retraction.
- However, on July 26, 2024, it rebounded and reached an all-time high of 24,861 points.
- This raises questions about its next move.
3. Concerns and Analysis:
- The closing at 24,055 points (lower than the previous close on July 23) indicates potential weakness.
- Significant volume and increasing volatility suggest heightened market activity.
- Such conditions can be risky for investors, as sudden swings may lead to losses.
4. Cautionary Note:
- Traders and investors should closely monitor the Nifty 50 chart and consider risk management strategies.
- While the market has shown strength, caution is warranted due to the volatile environment.
Remember, market predictions are complex, and various factors influence them. Always consult with a financial advisor before making investment decisions. 📈📉
Nifty , BankNifty and Bitcoin UpdateHello Traders,
Checkout the latest update on Nifty , BankNifty and Bitcoin. I hope we have updated you in very advance about this downfall and you all have saved your funds


NIFTY INTRADAY LEVE;S FOR 05 AUG 2024BUY - 24780
SL - 24710
TARGETS - 24850,24900,24960
SELL - 24710
SL - 24780
TARGETS - 24660,24590,24530
NO TRADE ZONE - 24710 to 24780
Previous Day High - 24850
Previous Day Low - 24710
Based on price action major support & resistance's are here, the red lines acts as resistances, the green lines acts as supports. If the price breaks the support/resistance, it will move to the next support/resistance line. White lines indicates previous day high & low, high acts as a resistance & low acts as a support for next day.
Trendlines are also significant to price action. If the price is above/below the trendlines, can expect an UP/DOWN with aggressive move.
Please NOTE: this levels are for intraday trading only.
Disclaimer - All information on this page is for educational purposes only,
we are not SEBI Registered, Please consult a SEBI registered financial advisor for your financial matters before investing And taking any decision. We are not responsible for any profit/loss you made.
Request your support and engagement by liking and commenting & follow to provide encouragement
HAPPY TRADING 👍

ADANIPORTS INR 1,587.85 TO 19,689 INR IN 12 YEAR FORWARDSGot bored today ! thinking of doing some analysis reports for Adani ports curiously He ha :)

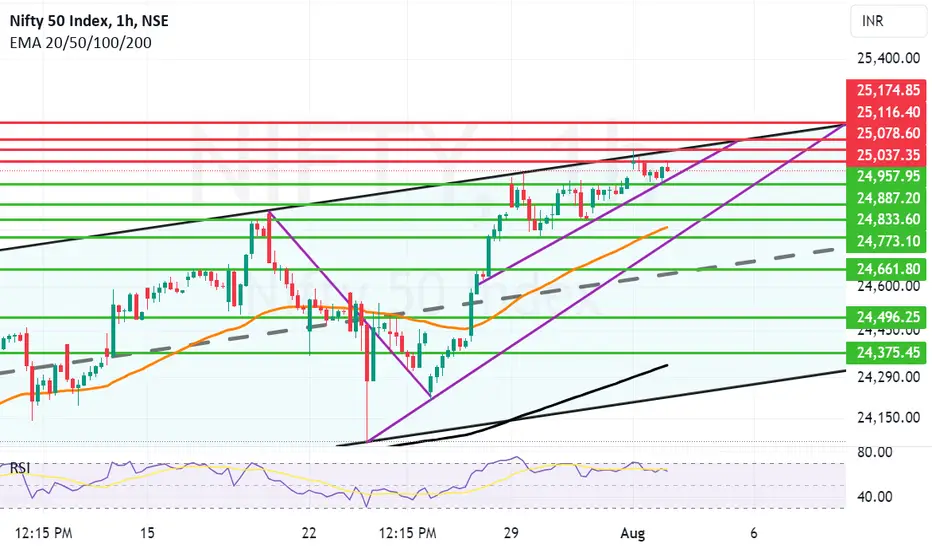
As mentioned yesterday Profit Booking was seen post new High. As we had discussed in yesterday's message after making a new high of 25078 there was strong profit booking in many stocks specially Mid, Small and Micro caps. Market breadth turned negative with 784 advances Vs 1588 declines. This is a natural phenomenon and we cant surely say how long the profit booking can go on. Nifty actually did well to close above 25K at 25010. 25037 was mentioned as a strong resistnace. Nifty momentarily went above it but could not sustain the levels. Nifty made a low of 24956 and bounced back.
We had again indicated that 24957 was a good support. (yesterday's Message). Same level is the key as Nifty can again try to confirm it's bottom for consolidation. In case 24957 is it's temporary bottom Nifty can rise further and again take an aim at closing above previous high of 25078.
Supports for Nifty remain at 24957, 24887 and the zone between 24833 and 24806(Mother line). If we get a closing below 24806, 24773 or 24661 might come in play. Resistances for Nifty remain at 25037, 25078 and 25116.
The above information is provided for educational purpose, analysis and paper trading only. Please don't treat this as a buy or sell recommendation for the stock. We do not guarantee any success in highly volatile market or otherwise. Stock market investment is subject to market risks which include global and regional risks. We will not be responsible for any Profit or loss that may occur due to any financial decision taken based on any data provided in this message.
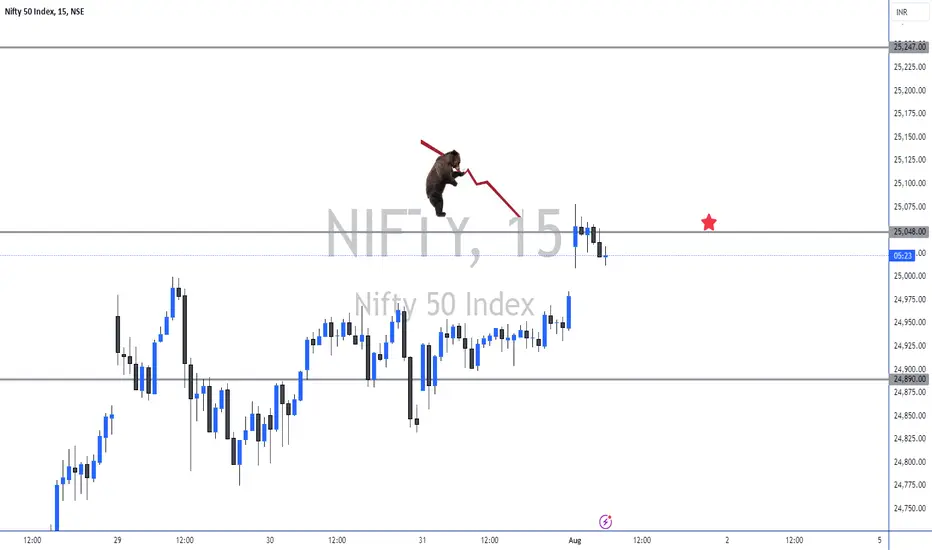
Nifty Levels For 1st August-2nd AugustImportant support and Resistance Levels For Nifty.
When Market touches the level, the price action plays important roles.
For More Learning Reach out to us.
Nifty 50 Live Update 31 July 1:50 PMOverall trend is bullish in nifty 50
Price is trading in Triangle Pattern.
If breaks upside then Sharp upmove is expected

#NIFTY Intraday Support and Resistance Levels -01/08/2024Nifty will be gap up opening in today's session. After opening nifty sustain above 25000 level and then possible upside rally up to 25120 level in today's session. in case nifty trades below 24950 level then the downside target can go up to the 24830 level.
