#NIFTY Intraday Support and Resistance Levels - 19/05/2025Flat opening expected in nifty in consolidation zone of 24950-25050 level. Any strong rally only expected after breakout or breakdown of this zone. Upside bullish rally expected if nifty starts trading and sustain above 25050 level this upside rally can goes upto 25250+ level in today's session. Any major downside rally possible below 24950. Downside 24750 level will act as a strong support for today's session.
Niftytrend

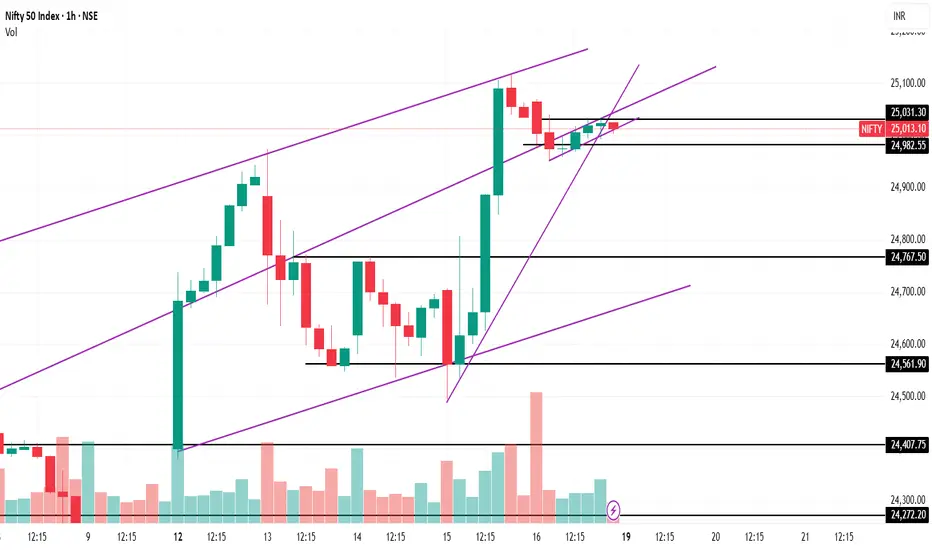
"Nifty 50 Near Resistance: Wedge Signals Reversal or Breakout"1. Trend Channel: The index is moving within a well-defined **upward sloping channel**, marked by two parallel purple trendlines.
* Price is currently hovering near the **upper boundary** of the broader ascending channel — a potential area for either breakout or rejection.
2. Short-Term Rising Wedge: A narrow rising wedge is visible (formed with tighter converging trendlines in the last few candles).
* Rising wedges are generally considered bearish reversal patterns, especially near resistance zones, suggesting potential for a pullback.
3. Resistance Levels: 25,031.30 : Immediate resistance (recent high & wedge upper boundary). A breakout above this could lead to a strong bullish continuation.
Upper channel trendline: Around 25,050–25,100 zone — further confluence resistance.
4. Support Levels: 24,982.55 Near-term support (bottom of the wedge structure). A breakdown below this level confirms wedge breakdown.
24,767.50 : Strong horizontal support from prior consolidation zone.
24,561.90, 24,407.75, and 24,272.20 : Sequential key support levels for downside targets if a breakdown accelerates.
**Volume Analysis:**
1. Volume Spike seen during the recent bullish candles, indicating strong buying interest. However, during the formation of the wedge, volume has declined, signaling weakening momentum— a typical precursor to a breakout or breakdown.
Possible Scenarios:
Bullish Scenario:
Break above 25,031.30 with volume could initiate a **fresh leg of uptrend**, possibly targeting the upper end of the channel (\~25,100+).
Bearish Scenario:
Breakdown below 24,982.55 from the wedge pattern could trigger a **short-term correction**, with immediate targets at 24,767.50 and 24,561.90.
The bearish divergence between price action and declining volume further supports this view.
18.5.25 NIFTY Bullish18.5.25
NIFTY
CMP: 25019.80
BUY Above: 25120
Sl: 24494
Tgt: 25116 / 26275
I am not SEBI registered analyst. Views expressed here are for educational purposes only. Please consult your professional financial advisor before investing. We are not responsible for your profits / gains if any.

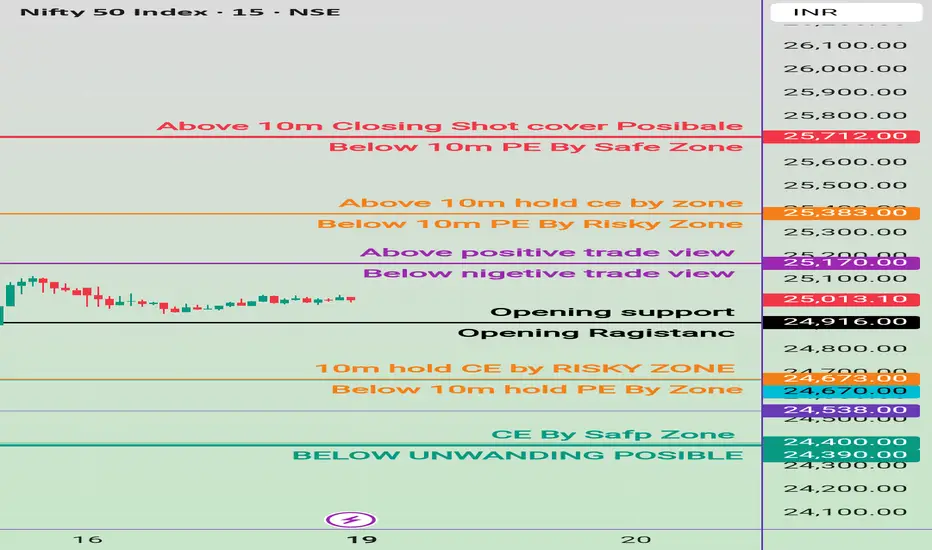
19thMay nifty important levels trading zone #Nifty50 #option trading
🚀 If you like my trading plan and levels, don't forget to boost the post
99% working trading plan
👉Gap up open 25170 above & 15m hold after positive trade target 25383, 25712
👉Gap up open 25170 below 15m not break upside after nigetive trade target 24670 , 24390
👉Gap down open 24916 above 15m hold after positive trade target 25170, 25383
👉Gap down open 24916 below 15m not break upside after nigetive trade target 24670, 24390
📌 Trade plan for education purpose I'm not responsible your trade
More education follow social media and boost my idea
📌 koi bhi trade leval se 20 point ke sl ke bhina karan nahi hi
📌 koi trade app activate tabhi karana hota hi level pe 2 candle uper ya niche closing aati hai to
📌 leval par Ane pe turant trade plan na kare ...
📌 Full risk apaki hi hi meri nahi
Nifty weekly Walkthrough and Outlook for next week
Expecting a push down on Nifty towards the daily OB and then a massive displacement towards the upside. The draw remains the same. I want all the buyside of 5th December before another meltdown and second stage distribution on the monthly

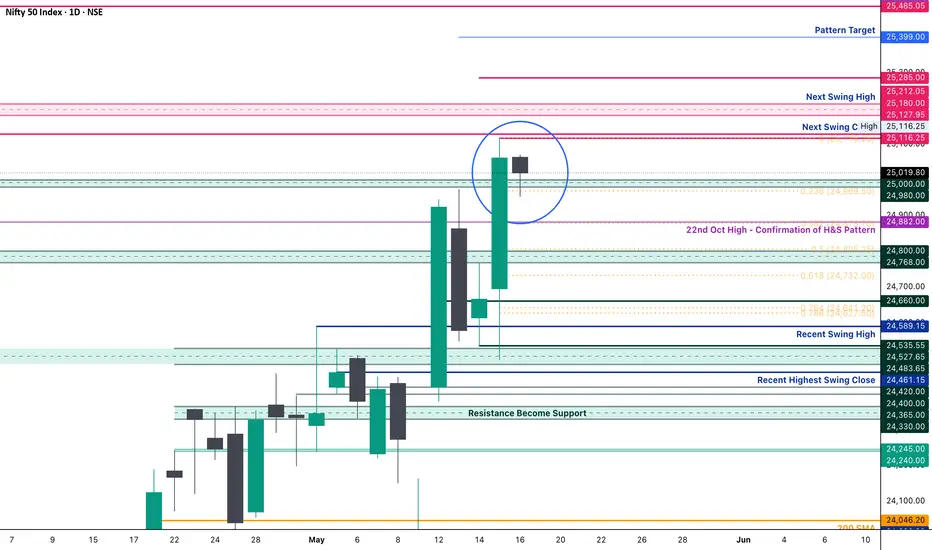
Nifty Analysis EOD – May 16, 2025 – Friday🟢 Nifty Analysis EOD – May 16, 2025 – Friday 🔴
Nifty Took a Breather After a Big Bullish Day
📈 Nifty Summary
As anticipated, after Thursday’s strong breakout and euphoric rally, Nifty paused for breath today. Despite Gift Nifty indicating a 75+ point gap-up, the actual open was flat, hinting that global cues couldn't ignite further momentum.
From the start, the tone was set for a retracement-style session—every intraday rise met with selling, while dips around 24,980 continued attracting buyers, keeping the structure range-bound but supported.
The most notable observation: today’s low aligned with the 23.8% Fibonacci retracement of yesterday’s candle, which shows bulls are still in control and defending key levels. However, the recovery from the day’s low couldn’t break past the 50% retracement of the same range—signalling hesitation and exhaustion in the short term.
📊 Intraday Walk
🟢 Flat open despite positive Gift Nifty cues
⚖️ Mean-reverting price action throughout
🧲 Buying seen repeatedly near 24,980
❗Rejection seen around 50% retracement of the previous day’s candle
🔚 Closed mildly negative; a pause, not panic
🕯 Daily Candle Breakdown
Candle Type: Small-bodied candle (Doji-ish) indicating indecision
Range: Tight and narrow (117 Points) session
Key Observation: Low held above 23.8% retracement of May 15 candle
What it Implies: Bulls still holding ground, but upside conviction lacking
🎯 Gladiator Strategy Update
Strategy Parameters
ATR: 350.94
IB Range: 94.2 → ✂️ Small IB
Market Structure: ⚖️ Balanced
Trade Highlights
⚠️ 1st Short Trigger: 11:05 → No Entry Initiated
💼 Total Trades: 0
📍 Support & Resistance Levels
🟩 Resistance Zones:
25,116 ~ 25,128
25,180 ~ 25,212
25,285
25,399
25,485 ~ 25,511
🟥 Support Zones:
25,000 ~ 24,980
24,882
24,800 ~ 24,768
24,730
24,660
24,590
24,530 ~ 24,480
🔮 What’s Next?
Today was a classic breather candle after a strong impulse. If Monday opens bullish and crosses above 25,070, we could see a continuation of the uptrend. But a close below 24,950 may be the first red flag for bulls.
🧠 Final Thoughts
Markets don't rise in a straight line. Today was a healthy pause—a base-building day. As long as 24,980 holds, the bulls have the upper hand.
“A pause in trend isn’t weakness—it’s preparation.”
✏️ Disclaimer
This is just my personal viewpoint. Always consult your financial advisor before taking any action.
#NIFTY Intraday Support and Resistance Levels - 16/05/2025Gap up opening expected in nifty near 25200 level. After opening if nifty starts trading above 25300 level then expected strong further upside rally towards the 25500+ level. Any reversal only expected from 25250 level. Downside 25050 level will act as a strong support for today's session.
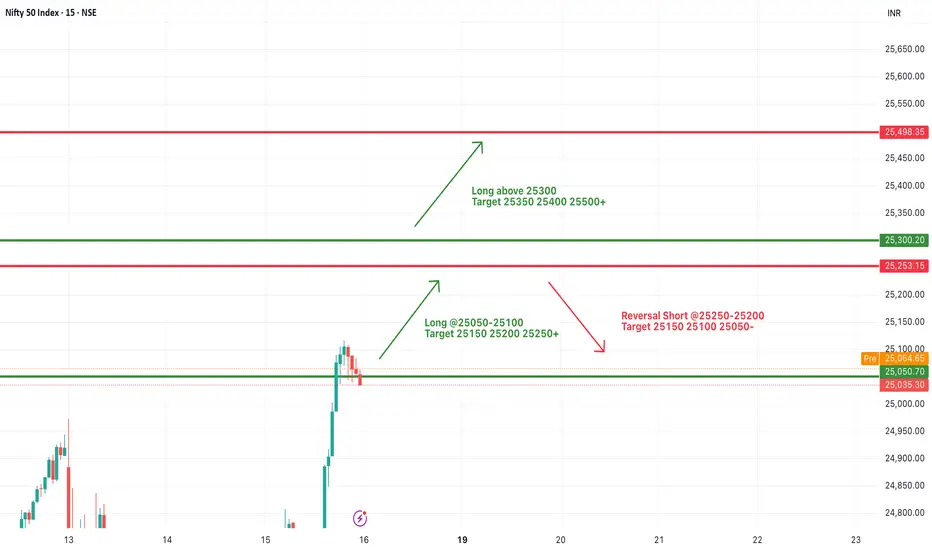
Major Breakout For Nifty But a Lot of Resistances Await.We saw a major Breakout for Nifty today but there are a few resistances ahead of us. Three things could happen now:
1) Nifty Rampages ahead towards 26K If the Bull Rally has real substance.
2) We might see some consolidation in this range and and after consolidating, Nifty retesting some important support the rally begins again.
3) Bears That are trapped throw a counter punch.
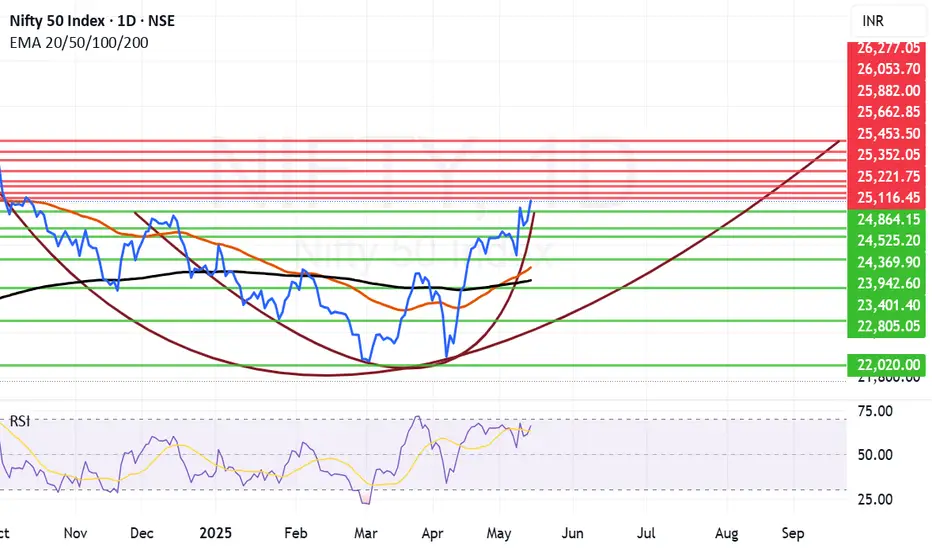
Scenario 1) Nifty has some resistance ahead near 25116 and 25221. We already hit 25116 and then closed at 25062. But if these 2 resistances are cleared and we get a closing above them Nifty can move swiftly towards 25352, 25453, 25662, 25882 and then regain 26K+ levels.
Scenario 2) As the Nifty has been rampaging ahead post ceasefire news there is practically need of a consolidation here. If Nifty chooses Consolidation then it may come down to test the bottom and the supports from where it can launch again remain at 24864, 24525, 24369 and then Mother and Father Line supports at 23775 and 23536 respectively.
Scenario 3) Bears who are trapped badly with the shorts can also throw a counter punch. This punch however will be effective only if we get a closing below 23536. In such a scenario Bears can pull back the Nifty towards 23942, 23401, 22805 or even 22K levels. (This however looking at the momentum looks less likely but you can never say never in stock market.)
Disclaimer: The above information is provided for educational purpose, analysis and paper trading only. Please don't treat this as a buy or sell recommendation for the stock or index. The Techno-Funda analysis is based on data that is more than 3 months old. Supports and Resistances are determined by historic past peaks and Valley in the chart. Many other indicators and patterns like EMA, RSI, MACD, Volumes, Fibonacci, parallel channel etc. use historic data which is 3 months or older cyclical points. There is no guarantee they will work in future as markets are highly volatile and swings in prices are also due to macro and micro factors based on actions taken by the company as well as region and global events. Equity investment is subject to risks. I or my clients or family members might have positions in the stocks that we mention in our educational posts. We will not be responsible for any Profit or loss that may occur due to any financial decision taken based on any data provided in this message. Do consult your investment advisor before taking any financial decisions. Stop losses should be an important part of any investment in equity.
Nifty Analysis EOD - May 15, 2025 - Thursday🟢 Nifty Analysis EOD - May 15, 2025 - Thursday 🔴
Heart-Throbbing Wild Weekly Expiry by Nifty
📈 Nifty Summary
What a day! In yesterday’s report, we highlighted the potential for breakout on both sides—and Nifty said, “Why choose one? Have both!”
Opening with a modest gap-up of 28 points at 24,694, the index wasted no time and took a sharp dive, breaching the Previous Day Low (PDL) and hitting 24,494. This test of the 24,483–24,528 support zone sparked an immediate V-shaped recovery.
By 10:30 AM, Nifty had reclaimed its mean level, and breaching 24,600 triggered short-covering that pushed it sharply toward PDH, which was taken out in just 10 minutes. A rumored update from Trump on a USA–India tariff deal (unverified but possible catalyst) might have played a role—though, as always, price is the final news.
However, within the next 30 minutes, Nifty wiped out all the gains, only to enter a consolidation phase until 1 PM. Then came the real action—another breakout above PDH with strong short-covering and fresh buying. The rally took Nifty to a fresh weekly high of 25,116, closing near the highs at 25,035.
This wasn’t a regular expiry. This was a thriller.
📊 Intraday Walk
📉 Breach of PDL to form 24,494 low
🧲 V-shaped recovery from 24,500 zone
🚀 24,600 breakout triggers short-covering to PDH
⚡ Spike to PDH wiped out → range-bound for 2 hours
🟢 1 PM breakout → new weekly high 25,116
🔚 Closed at 25,035, a solid 341-point day
🕯 Daily Candle Breakdown
Candle Type: Bullish Marubozu-like Engulfing
Range: ~622 points
Key Observation: Engulfed previous two candles and broke 12th May’s high & close
What it Implies: Strong bullish momentum, signs of sustained short-covering
🎯 Gladiator Strategy Update
Strategy Parameters
ATR: 376.94
IB Range: 212.3 → 📏 Medium IB
Market Structure: ⚖️ Balanced
Trade Highlights
✅ 1st Long Trigger: 13:05
🎯 Target Achieved: 1:4 Risk-Reward
💼 Total Trades: 1
📍 Support & Resistance Levels
🟩 Resistance Zones:
25,116 ~ 25,128
25,180 ~ 25,212
25,285
25,399
25,485 ~ 25,511
🟥 Support Zones:
25,000 ~ 24,980
24,882
24,800 ~ 24,768
24,730
24,660
24,590
24,530 ~ 24,480
🧠 Final Thoughts
The Nested Inside Bar setup we spoke of yesterday? It delivered. Clean breakdown of PDL without triggering trade saved us from a trap, while the PDH breakout delivered a 1:4 reward—textbook price action setup. With a strong bullish engulfing on the daily, expect continued strength with dips being bought.
“When the market offers clarity, act. When it offers confusion, observe.” — Stay nimble.
✏️ Disclaimer
This is just my personal viewpoint. Always consult your financial advisor before taking any action.

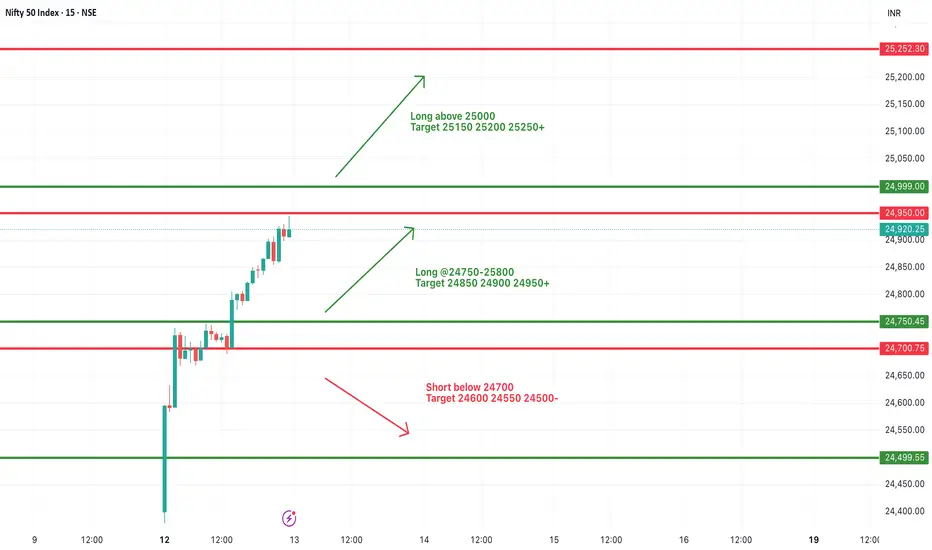
#NIFTY Intraday Support and Resistance Levels - 15/05/2025Gap up opening expected in nifty near 24750 level. After opening if nifty starts trading and sustain above this level then expected upside movement upto 24950 level. Below 24700 level there will be downside expected upto 24550. 24550 level will act as a strong and important support for nifty. Any major downside only expected below this support level.

Nifty Analysis EOD - May 14, 2025 - Wednesday🟢 Nifty Analysis EOD - May 14, 2025 - Wednesday 🔴
Day Ends with Directional Uncertainty from Nifty
🔍 Nifty Summary
Nifty opened with a 35-point gap-up, displaying early strength by slowly climbing toward 24,747, which aligned with the critical resistance zone of 24,768–24,800 and the CPR top. But that’s where the rally halted.
From the day’s high, it reversed lower, testing both the Previous Day Low (PDL) and Previous Week High (PWH). Interestingly, the index took support there and managed to close right at the CPR, underlining indecision.
The day was marked by broad consolidation within a 232-point range, with no strong directional follow-through. Price stayed majorly around the CPR zone, signaling a range-bound session with underlying uncertainty.
🕵️ Intraday Walk
☀️ Opened with 35-point gap-up; gradually climbed to 24,747.
🚫 Hit resistance at 24,768–24,800 and reversed.
🔽 Fell to test PDL and PWH zone (24535 area).
🛑 Found support and bounced back to close at CPR.
🔄 A day filled with range-bound movement and no clear trend.
📏 Inside Bar Pattern Watch (Daily Chart)
A 3-day Inside Bar Structure is forming:
📅 May 12: Mother Candle
📅 May 13: Baby candle (ignore 29-point upper wick)
📅 May 14 (Today): Another baby candle within May 13 (ignore 12-point lower wick)
This nested inside bar scenario could trigger a directional breakout soon.
🔼 Upside Levels:
If today’s high (24,767) breaks:Target Zones: 24,800 → 24,882 → 24,940
🔽 Downside Levels:
If today’s low (24,535) breaks:Target Zones: 24,480 → 24,400 → 24,365 → 24,330
🔎 Key Fib Observations
📏 Today’s high (24,747) = ~50% retracement of May 13’s candle → signals rise-on-sell tone
📉 Today’s close (24,640) = ~50% retracement of today’s candle → neutral-to-positive bias
These confluences reflect a tug-of-war between bulls and bears, waiting for a breakout.
🕯 Daily Candle Breakdown
Candle Type: Small-bodied candle inside previous day’s range
Today’s OHLC:▫️ Open: 24,613.80▫️ High: 24,767.55▫️ Low: 24,535.55▫️ Close: 24,666.90 (▲+88.55 / +0.36%)
🔍 Key Observations:
⚠️ No directional expansion, despite higher high & low
✅ Inside bar formation continues
✅ Close at candle midpoint → Neutral, with slight positive bias
📊 Sign of energy build-up for a potential breakout
🛡 Gladiator Strategy Update
Strategy Parameters
ATR: 349.73
IB Range: 169.70 → 📏 Medium IB
Market Structure: ⚖️ Balanced
Trade Highlights
⚠️ No trade triggered
💼 Total Trades: 0
🔢 Support & Resistance Levels
🟩 Resistance Zones:
24,730
24,768 ~ 24,800
24,882
24,980 ~ 25,000
25,100 ~ 25,128
25,180 ~ 25,212
🟥 Support Zones:
24,882
24,800 ~ 24,768
24,730
24,660
24,590
24,530 ~ 24,480
24,461
24,420 ~ 24,400
24,365 ~ 24,330
24,245 ~ 24,240
🔮 What’s Next?
A 3-day Inside Bar Formation generally signals a volatility contraction phase. The tighter the coil, the stronger the potential breakout.
If 24,767 breaks, bulls might regain momentum.If 24,535 fails, we may retest deeper supports from 24,480 downward.
📌 Patience over prediction — let the range resolve.
💬 Final Thoughts
“Inside bars are calm before the storm. Stay alert — breakout decides the next play.”
✏️ DisclaimerThis is just my personal viewpoint. Always consult your financial advisor before taking any action.
#NIFTY Intraday Support and Resistance Levels - 14/05/2025Slightly gap up opening expected in nifty near 24700 level. After opening if nifty starts trading and sustain above 24750 level then upside movement expected upto 24950+ target. Downside 24500 level will act as a strong support for today's session. Any major downside expected below this support level.

Nifty Analysis EOD - May 13, 2025 - Tuesday🟢 Nifty Analysis EOD - May 13, 2025 - Tuesday 🔴
Is it Retracement or Breakout Failed?
🔍 Nifty Summary
Nifty opened with a mild gap-down of 35 points and within the first 20 minutes, it sliced through multiple supports — Previous Day Close, 24,882, 24,801–24,768, and even 24,730 — in what looked like a determined breakdown. However, the follow-up was missing. Instead of extending lower, the index hovered indecisively near the CPR until 12:30 PM.
Post-lunch, a breakout attempt did arrive — but momentum was lukewarm. Both sides saw significant premium erosion, making it a tough day for option buyers.
Despite the early pressure, Nifty closed at 24,578 (-57 pts) — a mild negative close, but interestingly near multiple fib supports and recent swing zones, hinting at absorption.
🕵️ Intraday Walk
🔽 Broke PDC → 24,882 → 24,801–24,768 → 24,730 within 20 minutes.
🌀 Stuck inside CPR zone until 12:30 PM – volatility without trend.
📈 Breakout attempt post-lunch lacked strength.
💸 Both calls and puts decayed heavily – option writers ruled.
🧭 75-Min Chart Analysis / Zone Commentary
Market flirted with imbalance in the morning, but later balanced out, forming a neutral structure.
The rejection of deeper downside and close near key fibs point to a pause more than a trend.
🔍 Key Observations:
✅ Closed near recent swing high at 24,589
✅ Near 0.382 Fib retracement from the previous close (24,587)
✅ Near 0.618 Fib from the prior session (24,595)
❌ No follow-through after support breaks
❌ Momentum faded quickly after the breakout attempt
📌 Implication:
The market shows signs of absorption near support zones but lacks strength for a reversal — neutral to slightly bullish bias, but still cautious.
🛡 Gladiator Strategy Update
Strategy Parameters
ATR: 362.82
IB Range: 298.2 → 📏 Large IB
Market Structure: ⚖️ Balanced
Trade Highlights
📈 Long Trigger @ 12:40 PM
🎯 Target 1:1 Achieved
💼 Total Trades: 1
🔢 Support & Resistance Levels
🟩 Resistance Zones:
24,660
24,730
24,768 ~ 24,800
24,882
24,980 ~ 25,000
25,100 ~ 25,128
25,180 ~ 25,212
🟥 Support Zones:
24,882
24,800 ~ 24,768
24,730
24,660
24,590
24,530 ~ 24,480
24,461
24,420 ~ 24,400
24,365 ~ 24,330
24,245 ~ 24,240
🔮 What’s Next?
Today’s session looked like a failed to sustain above 24800 and lack of retracement. close around the fib level, raises a question about whether is it breakout failure or just retracement ?
In short: no clarity.
📌 If Nifty holds above 24,530–24,480, it may attract buying towards 24,730–24,800 again.
📉 But a sustained break below 24,480 could invite a retest of 24,365 ~ 24,330 zone.
➡️ For now, traders should stay nimble and option buyers cautious.
💬 Final Thoughts
“Confusion is a part of clarity. Let the market reveal itself — reacting is better than predicting.”
✏️ Disclaimer
This is just my personal viewpoint. Always consult your financial advisor before taking any action.
Nifty cooled down from the overbought zone. The correction in Nifty we saw today in most likelihood seems like a correction from overbought zone. The indicator for this is RSI which had reached 77.09 yesterday in the hourly chart. After the correction today it is back to 53.28 after reaching 51.5 earlier today. Another reason can be US and China agreeing to a trade deal which might also be seen as a negative for Indian markets. whether it will have very negative impact and send market further down is there to be seen. IT, Metals, Infra, MNC, Pvt Banking and Finance stocks were laggard. The indices that were positive today are Midcap, Small cap, Psu Banks, CG, Media and Pharma.
Supports for Nifty remain at: 24450 (Mother line of Hourly chart), 24374, 24165, 23929 (Father line of Hourly chart) and Mid channel support at 23786.
Resistances for Nifty remain at: 24642, 24797 and 25012 (Channel top resistance).
Shadow of the candle looks neutral as of now.
Disclaimer: The above information is provided for educational purpose, analysis and paper trading only. Please don't treat this as a buy or sell recommendation for the stock or index. The Techno-Funda analysis is based on data that is more than 3 months old. Supports and Resistances are determined by historic past peaks and Valley in the chart. Many other indicators and patterns like EMA, RSI, MACD, Volumes, Fibonacci, parallel channel etc. use historic data which is 3 months or older cyclical points. There is no guarantee they will work in future as markets are highly volatile and swings in prices are also due to macro and micro factors based on actions taken by the company as well as region and global events. Equity investment is subject to risks. I or my clients or family members might have positions in the stocks that we mention in our educational posts. We will not be responsible for any Profit or loss that may occur due to any financial decision taken based on any data provided in this message. Do consult your investment advisor before taking any financial decisions. Stop losses should be an important part of any investment in equity.

#NIFTY Intraday Support and Resistance Levels - 13/05/2025Gap up opening expected in nifty. After opening if nifty starts trading above 25000 level then possible strong upside rally upto 150-200+ points expected in index. 24750 level will act as a strong support for nifty. Any downside movement can reversal from this level. Now any major downside only expected below 24700 level.
Brahmos Candle took off today. The situation was delicate on Friday but weekend brought a news that was favorable for the market. The news related to Ceasefire always helps the business and give a relief to the investors. We are yet to see how things shape up when the 'war of fog' disperses but things are coming back on track it seems as of now. Trade talks between US and China are also yielding some positive vibes. Thus the market today took off like a BRAHMOS Missile and had given one of the strongest candles which is very rare to see. Things are looking very bullish as of now if everything remains calm.
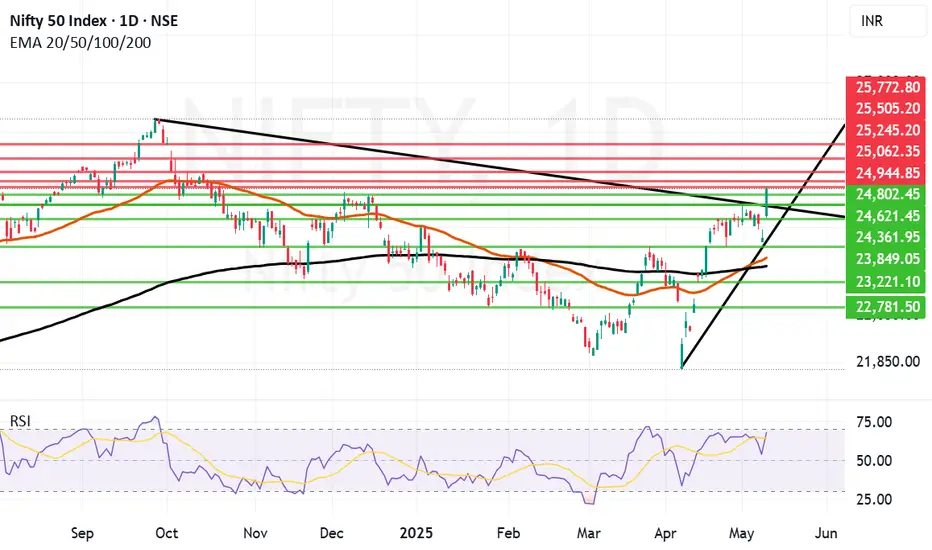
The Nifty supports right now seem to be near 24802, 24621 (Trend line Support) 24361, 23849, 23648 (Mother line on Daily chart) and 23498 (Father line on Daily chart).
The Nifty Resistances right now seem to be near 24944, 25062, 25245, 25505 and 25772. Once we close above 25772 if everything remain positive we can think of regaining even 26K levels and going deeper just like our missiles. But before we reach the Euphoria zone there are a lot of resistances to be crossed.
Shadow of the candle is Bullish however there can be chances of Profit booking as well where investors can tend to take their short / medium term profit.
Disclaimer: The above information is provided for educational purpose, analysis and paper trading only. Please don't treat this as a buy or sell recommendation for the stock or index. The Techno-Funda analysis is based on data that is more than 3 months old. Supports and Resistances are determined by historic past peaks and Valley in the chart. Many other indicators and patterns like EMA, RSI, MACD, Volumes, Fibonacci, parallel channel etc. use historic data which is 3 months or older cyclical points. There is no guarantee they will work in future as markets are highly volatile and swings in prices are also due to macro and micro factors based on actions taken by the company as well as region and global events. Equity investment is subject to risks. I or my clients or family members might have positions in the stocks that we mention in our educational posts. We will not be responsible for any Profit or loss that may occur due to any financial decision taken based on any data provided in this message. Do consult your investment advisor before taking any financial decisions. Stop losses should be an important part of any investment in equity.
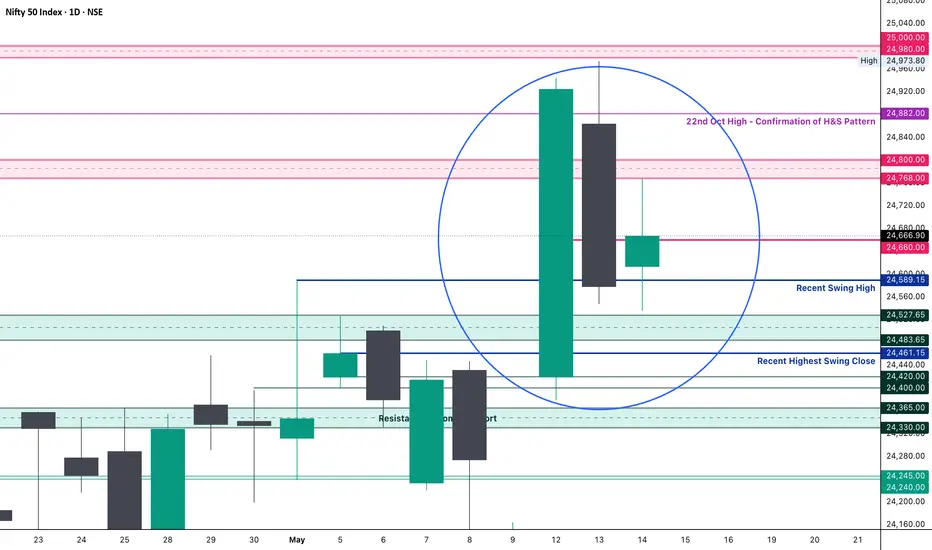
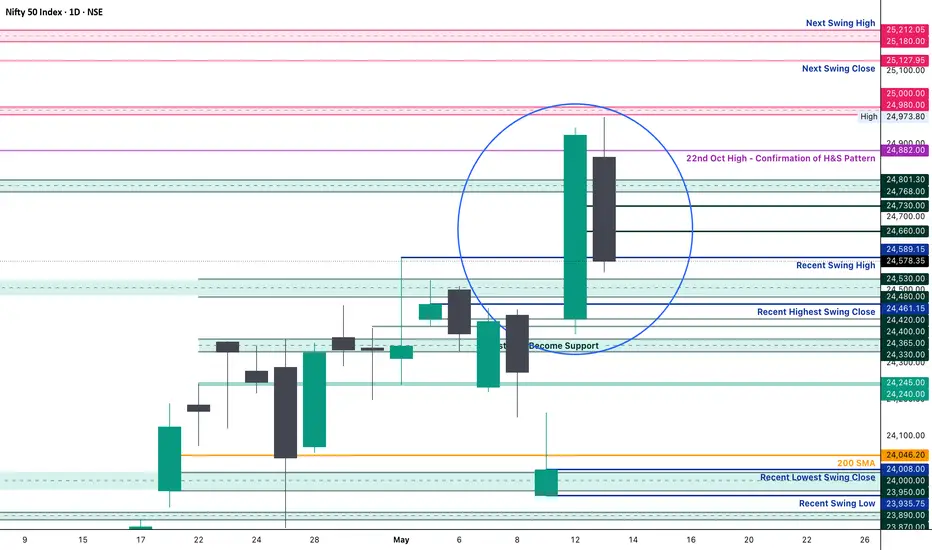
Nifty Analysis EOD - May 12, 2025 - Monday🟢 Nifty Analysis EOD - May 12, 2025 - Monday 🔴
🚀 Peace Talks & Policy Push – Bulls Break Chains, Nifty Soars to New Heights!
Opening Mood:
Relief from geopolitical tension and global trade optimism lit a fire under the bulls—marking one of the most powerful sessions in recent weeks.
🧭 Nifty Summary:
Following positive developments—ceasefire between India and Pakistan and trade policy easing between China and the US—Gift Nifty signaled a sharp gap-up.
Nifty opened at 24,420 (▲ 412 points | 1.72%), jumping above multiple resistance levels: 24,400~24,420 and 24,365~24,300. The first 5-minute candle alone posted a 184-point rally—and from there, bulls never looked back.
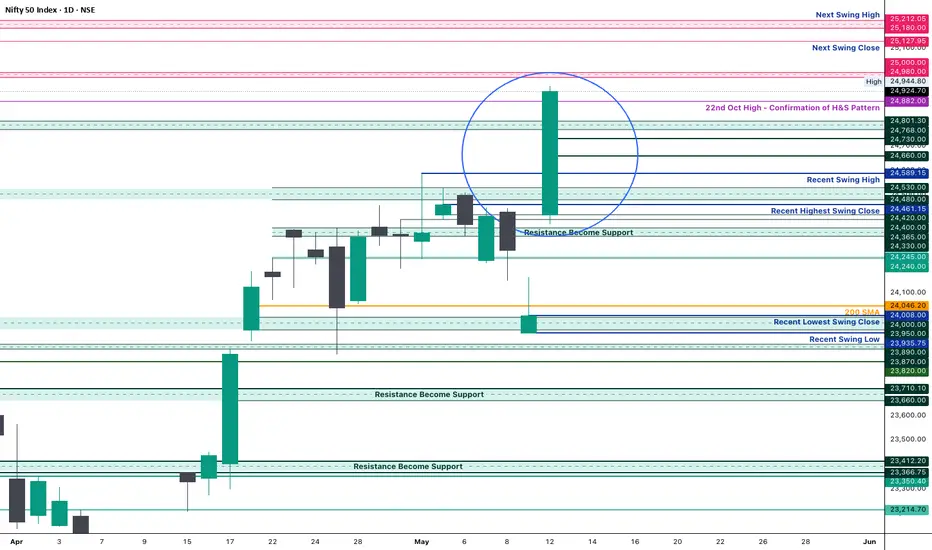
By breaching the 24,800 resistance and making a new swing high at 24,944.80, the day stamped bullish dominance. The close just 20 points below the high reflects strong buying interest and minimal profit booking.
🕯️ Daily Candle Breakdown:
Today’s Candle: Bullish Marubozu (full-bodied, tiny/no wicks) — high conviction buying
Close: 24,924.60 (Near day’s high)
Key Observations:
✅ Breakout above 24,800 resistance
✅ Closed above 22nd Oct 2024 candle high — a key Head & Shoulder confirmation level
✅ Strong volume and price confirmation
🔜 Watch for follow-through above 24,700–24,800 zone
What It Implies:
Clear strength from bulls with no hesitation. If follow-through sustains, we could be heading toward a fresh leg of upside—likely to test the psychological 25,000 mark and beyond.
⚔️ Gladiator Strategy Update
Strategy Parameters:
ATR: 355.76
IB Range: 358.95 → Extreme Large IB
Market Structure: ImBalanced
Trade Highlights:
Total Trades: 1
✅ Long Trigger @ 12:25 PM → Target 1:3.5 Achieved
📈 Intraday Walk (5-Min View):
Opened strong above multiple resistance zones
First candle: explosive 184-point rally
Smooth rally continued with no major retracement
A new swing high formed at 24,944.80
Day closed just shy of the high—strength intact
🔍 Support & Resistance Levels
🔼 Resistance Zones:
24,980 ~ 25,000
25,100 ~ 25,128
25,180 ~ 25,212
🔽 Support Zones:
24,882
24,800 ~ 24,768
24,730
24,660
24,590
24,530 ~ 24,480
📌 Final Thoughts:
"Markets love clarity. With news-driven fear subsiding, technicals are taking charge again. Follow momentum—but don't chase it blindly."
✏️ Disclaimer
This is just my personal viewpoint. Always consult your financial advisor before taking any action.
Nifty Futures.... 25425 on the Anvil ....Lets see.Nifty Futures seem to be moving into stratosphere..... 78.6 Fib the nx tgt. Lets See.
#Nifty #NiftyFutures #markets #Fibonacci

#NIFTY Intraday Support and Resistance Levels - 12/05/2025Gap up opening expected in nifty near 24500 level. After opening if nifty starts trading above 24550 level then expected this rally can extend upto 24750+ in today's session. Downside 24250 level will act as a strong support for today's session. Any downside movement can reversal from this level. Major downside only expected below 24200.

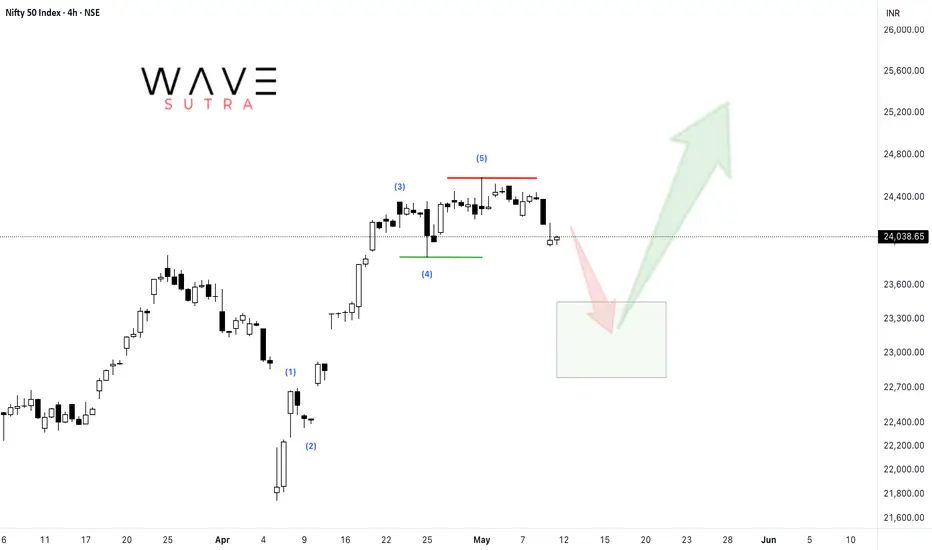
Nifty: Correction aheadNifty is likely to correct lower towards 23400-23000 zone before resuming up.
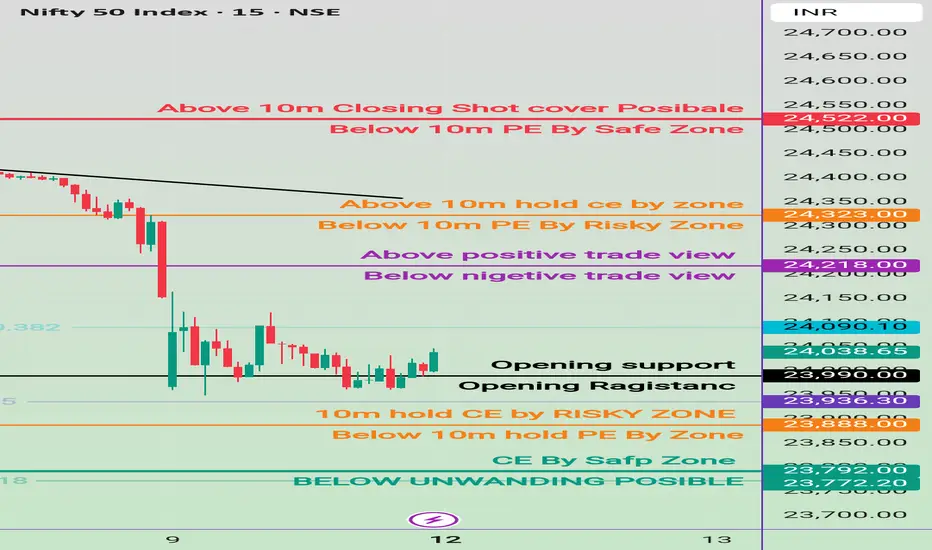
12 may Nifty50 important levels trading zone #Nifty50 #option trading
🚀 If you like my trading plan and levels, don't forget to boost the post
99% working trading plan
👉Gap up open 24218 above & 15m hold after positive trade target 24323, 24522
👉Gap up open 24218 below 15m not break upside after nigetive trade target 23990, 23890
👉Gap down open 23990 above 15m hold after positive trade target 24218 , 23322
👉Gap down open 23990 below 15m not break upside after nigetive trade target 23890, 23790
📌 Trade plan for education purpose I'm not responsible your trade
More education follow social media and boost my idea
📌 koi bhi trade leval se 20 point ke sl ke bhina karan nahi hi
📌 koi trade app activate tabhi karana hota hi level pe 2 candle uper ya niche closing aati hai to
📌 leval par Ane pe turant trade plan na kare ...
📌 Full risk apaki hi hi meri na
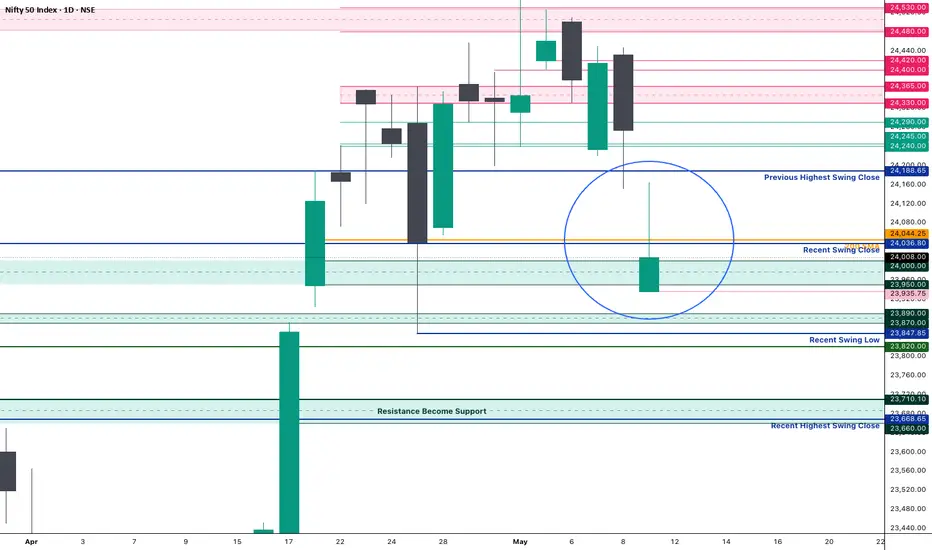
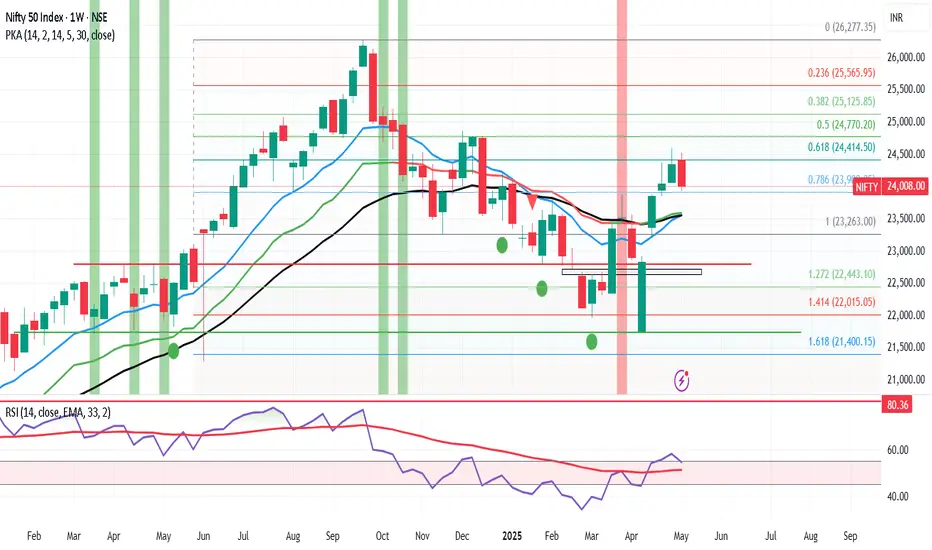
Weekly Market Wrap: Nifty Dips 340 Points Amid Global TensionsThis week, the Nifty 50 ended on a cautious note, closing at 24,008, down 340 points from the previous week's close. The index traded within a tight range, hitting a high of 24,526 and a low of 23,935—well within my anticipated levels of 24,900 to 23,800.
Silver Lining: Despite ongoing geopolitical tensions and negative news flow—including war-related developments—bulls managed to defend the critical psychological support of 24,000. That’s a sign of resilience in an otherwise shaky environment.
What’s Ahead?
For the upcoming week, expect high volatility. I see Nifty moving between 24,600 and 23,200. A weekly close below 23,800 could spell trouble for bulls, potentially opening the door for a drop toward major support zones at 23,200 and 23,000.
Technical Outlook:
Monthly & Daily Timeframes: Weak
Weekly Timeframe: Still bullish
So, while long-term charts show vulnerability, the weekly trend gives hope. I'm staying cautiously bullish—but will only turn aggressive once the monthly chart flips positive. Until then, it’s time to stay vigilant, not impulsive.
Global Cues: S&P 500 Holding Up Amid Uncertainty
The S&P 500 closed at 5,659, just 30 points down from the previous week, forming a doji candle—a clear sign of indecision. As long as the index holds above 5,532, there's no major cause for concern.
Bearish Trigger: Below 5,532, expect downside pressure toward 5,458 and 5,392, which could spill over into already fragile emerging markets like India.
Bullish Breakout: Above 5,770, bulls gain momentum, with potential upside targets of 5,821, 5,850, and 5,900. A rally here could bring relief to global equities, including Indian markets.
Nifty Analysis EOD - May 9, 2025 - Thursday🟢 Nifty Analysis EOD - May 9, 2025 - Thursday 🔴
🧨 Gap Down, Rebound & a Triangle Trap – Bulls Show Spine Amid Chaos
Opening Mood:
Overnight panic from geopolitical tensions shook the market’s foundation—but the bulls weren’t ready to surrender just yet.
🧭 Nifty Summary:
Gift Nifty had plunged to 23,760 late last night on news of escalating conflict—marking a 445-point fall. However, as the night wore on without further developments, markets began to stabilize. At the open, Nifty registered a gap-down of 338 points at 23,935, but the first 5-minute candle showed strength, racing to fill the gap.
After a brief attempt to break the Previous Day’s Low (PDL), Nifty failed to hold below and slid back to its origin. The rest of the day was a tug-of-war with sharp two-sided moves, eventually forming a descending triangle pattern—a sign of compression and directional indecision.
🕯️ Daily Candle Breakdown:
Today’s Candle: Wide-range doji with upper wick—signs of volatility and hesitation
Close: 24,008 (▲ Positive)
Key Observations:
✅ Above 24,000 Psychological Mark
✅ Held Support Zone: 24,000 ~ 23,950
✅ Above Recent Swing Low: 23,847.85
❌ Slightly Below Previous Week’s Low: 24,054.05
❌ Below Previous Swing Close: 24,036
What It Implies:
Buyers are stepping in at key supports, but conviction is still lacking. The market remains reactive to global cues, especially Mission Sindoor ones.
⚔️ Gladiator Strategy Update
Strategy Parameters:
ATR: 291.20
IB Range: 204.00 (Large IB)
Market Structure: ImBalanced
Trade Highlights:
Total Trades: 1
✅ Long Trigger @ 10:10 AM → Target 1:1.5 Achieved
📈 Intraday Walk (5-Min View):
Strong gap-fill in the first candle signaled bullish intent
Failed breakdown below PDL trapped weak shorts
Descending triangle emerged as price compressed
Market closed near resistance but above key support—neutral to slightly bullish tone
🔮 What’s Next?
This market is walking a tightrope between sentiment and structure. On one hand, technical levels are being respected—but on the other, global uncertainty is keeping participants hesitant.
“This is a news-driven market. Delivery trades are best avoided. Stay nimble, trade the levels, and protect capital. Remember, sometimes staying out is a profitable strategy.”
🔍 Support & Resistance Levels
🔼 Resistance Zones:
24,036 ~ 24,044
24,150 ~ 24,165
24,188 ~ 24,240
24,290
24,330 ~ 24,365
24,400 ~ 24,420
🔽 Support Zones:
24,000 ~ 23,950
23,935
23,890 ~ 23,870
23,848
23,820
23,710 ~ 23,660
📌 Final Thoughts:
“Structure is key. When levels work, respect them. When they break, adapt.”
In a market full of noise, discipline and level-based action is your edge.
✏️ Disclaimer
This is just my personal viewpoint. Always consult your financial advisor before taking any action.