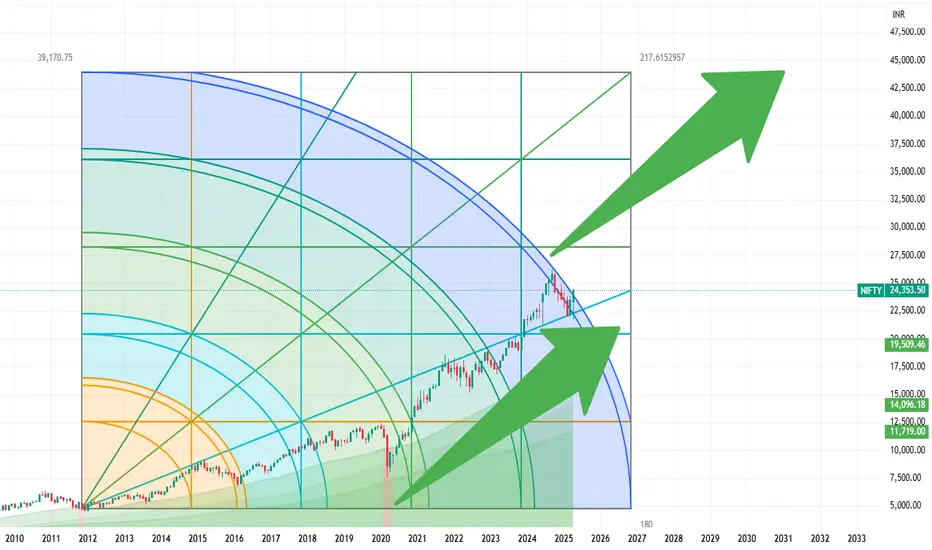
Nifty Momentum may lead it to 44000 levelNifty monthly chart is showing a rapid growth since last 5 years, this momentum may lead it to these levels 28000, 36000 and 44000 levels.
Niftytrend
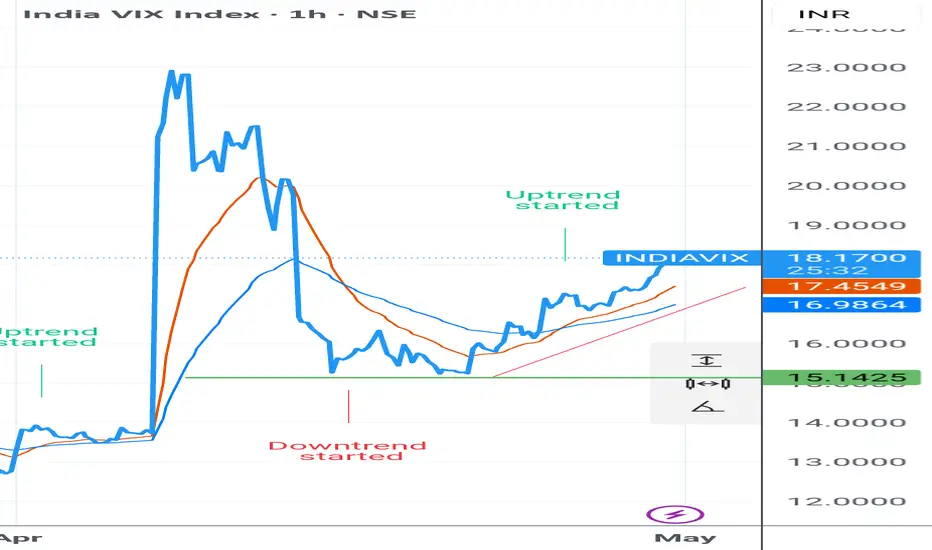
IS STOCK MARKET BIG FALL COMING ?Nifty bottom out 22000, We enjoyed almost 2500 rally, in spite of this, INDIA VIX the indicator of Fear & volatility didn't fall below 15 level and made double bottom . It support here two times on 16 April & 22 April And raised 15% till now currently traded above 18.50 level.
Does it make sense that market shoot up and india vix Rising ?
It has become solved all issue ?
Us china terrif tension has became over ?
Is it Consumption increasing in india ? So why Fmcg sector underperform ?
Would it be any impact coming of India Pak war situation ?
I don't know what will be in future but rising india vix clearly saying that Market going toward FEAR zone. So just be cautious & avoid to open Naked position.
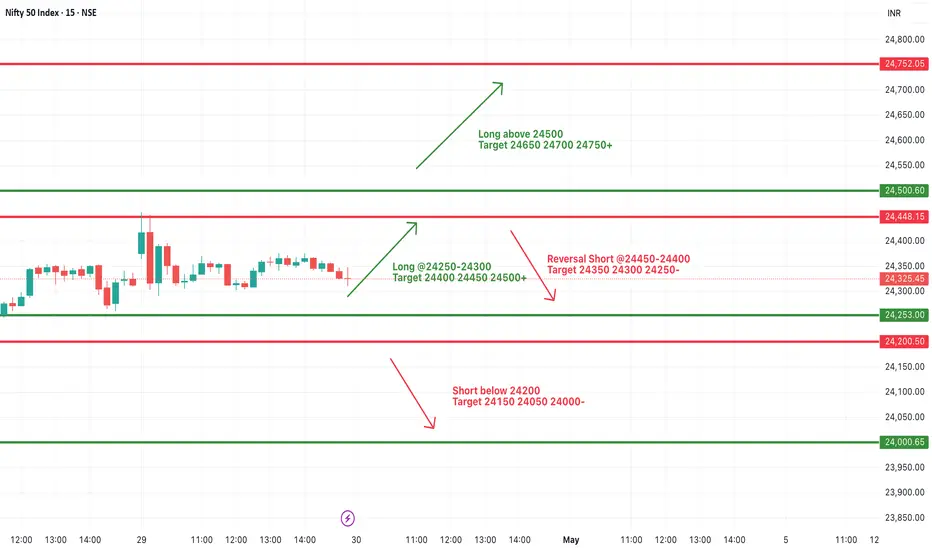
#NIFTY Intraday Support and Resistance Levels - 30/04/2025Gap up opening expected in nifty near 24450 level. Currently nifty consolidating in the range of 24250-24500 level. After opening if nifty starts trading and sustain above 24500 level then possible strong upside rally towards the 24750+ level in today's session. 24250 level will act as a strong support for today's session. Any major downside only expected if nifty starts trading below 24200 level. This downside can goes upto 24000 level.
Nifty Analysis EOD - April 29, 2025🟢 Nifty Analysis EOD - April 29, 2025🔴
One more day passed under uncertainty... Indecision takes the driver’s seat.
📈 Market Summary
Nifty opened on a positive note at 24,370, gaining 42 points, and swiftly climbed to an intraday high of 24,457.65. But the enthusiasm didn’t last long — sellers stepped in and pushed it down, filling the opening gap. The index found support near 24,290, and attempted a bounce, but once again failed to clear the critical 24,330–24,360 resistance zone.
📌 Intraday 5 Min Time FrameChart
The rest of the session saw price action trapped within a narrow 70-point range — a frustrating day for breakout traders or option buyers.
🔹 Impatient option buyers may have been trapped, stuck in hopes of a breakout.
🔹 Patient traders probably stayed away.
🔹 Scalpers and option sellers — this was your playground today.
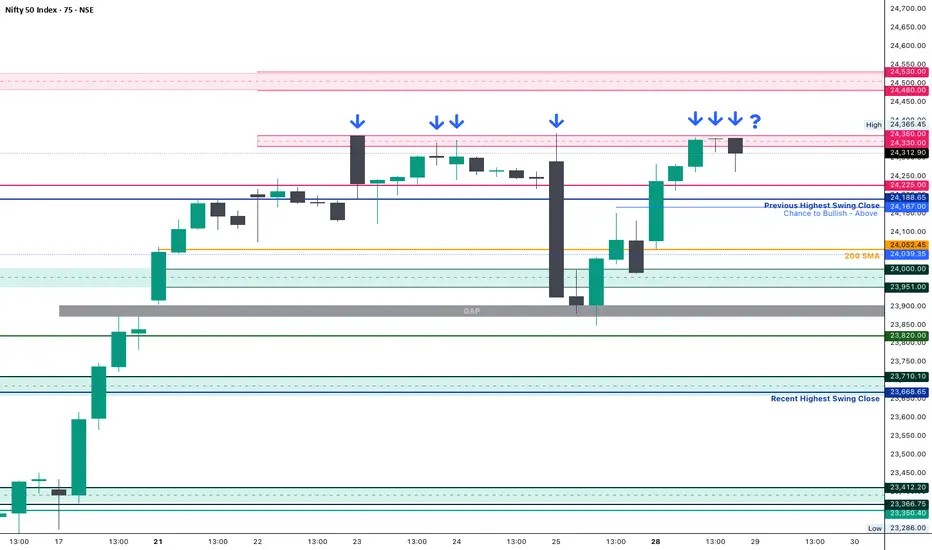
📌 75 Min Time FrameChart
On the 75-minute chart, once again, rejection is clearly visible from the 24,330 ~ 24,360 zone. Until we see a decisive close above 24,365, this zone will continue to command respect in our trade plans.
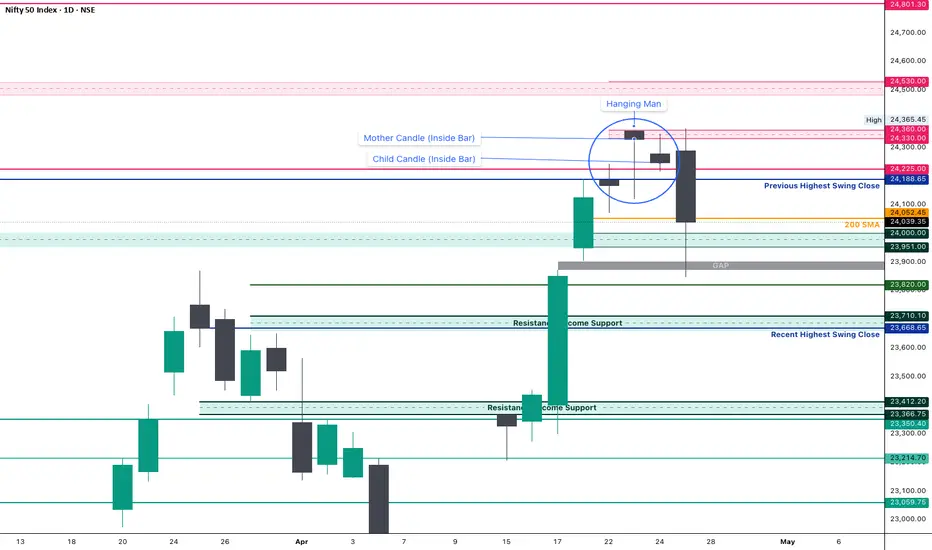
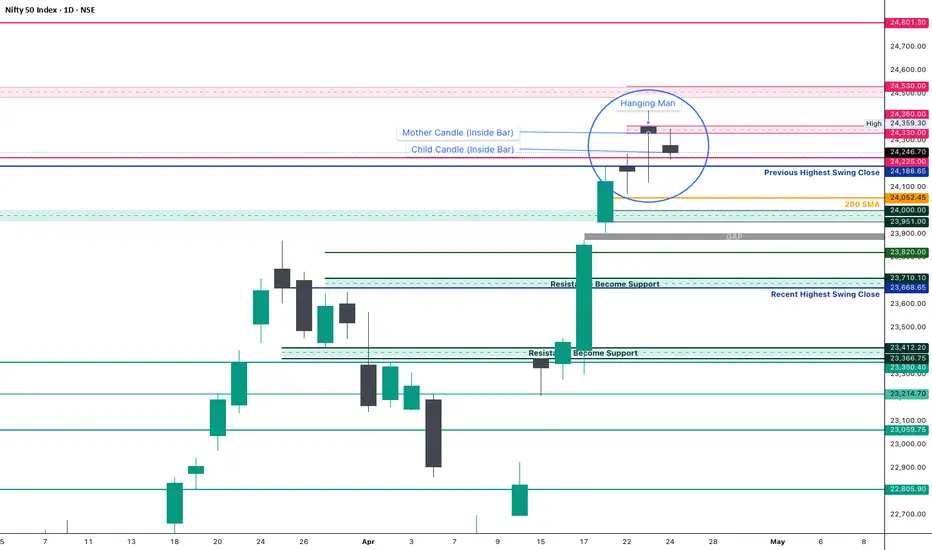
📌 Daily Time Frame Chart
🕯 Daily Candle Structure
Candle Type: Spinning Top — a classic indecision candle
OHLC:
Open: 24,370.70
High: 24,457.65
Low: 24,290.75
Close: 24,335.95
Change: +7.45 points (+0.03%)
🔍 Candle Breakdown:
Real Body:
Small red body of -34.75 pts (close < open) → Indicates lack of strong directional move.
Upper Wick: 86.95 pts
Lower Wick: 79.95 pts
This candlestick reflects market hesitation, especially significant after a strong uptrend. Bulls and bears fought for control, but neither side won convincingly.
🧠 What the Spinning Top Tells Us:
Appears after a strong move → Suggests loss of momentum or possible pause
Small body + long wicks = Indecision
Needs confirmation in the next session
🔮 What Next?
Today’s spinning top doesn’t give a clear directional cue. However, context matters:
A close above CPR and previous session tilts the bias slightly bullish.
Bullish scenario: A breakout above 24,460 may resume the upward trend.
Bearish scenario: A breakdown below 24,040 could open the door for a pullback.
As always — trade with preparation, not prediction.
⚔️ Gladiator Strategy Update
ATR: 326.39
IB Range: 166.9 (Medium IB)
Market Structure: Imbalanced
Trade Highlights:
Positional Trade: Long Triggered Yesterday 15:20 – 1:2 Target Achieved
Intraday: No trade triggered during the session
📈 Index Performance Snapshot
Nifty 50: +7 Points (+0.03%)
Bank Nifty: -42 Points (-0.07%)
Nifty 500: +11 Points (+0.05%)
Midcap: +148 Points (+0.27%)
Smallcap: +62 Points (+0.37%)
🔍 Key Levels to Watch
🛑 Resistance Zones:
24,330 ~ 24,360 (Immediate hurdle)
24,457 (Today’s High)
24,480 ~ 24,540 (24,500 psychological level inside this zone)
24,800
🛡 Support Zones:
24,290 (Today’s Low)
24,190 ~ 24,225 (Immediate support)
24,120
24,050
24,000 ~ 23,950
23,820
23,710 ~ 23,660
23,500
23,410 ~ 23,370
23,215
💭 Final Thoughts
Another day where the market teased both bulls and bears alike. But remember — uncertainty is not your enemy; it’s your signal to slow down. When the candle speaks in spinning tops, the trader listens in silence. Discipline and patience are still your best tools, especially when the market isn't shouting direction clearly.
Tomorrow is the Weekly expiry — so prepare for volatility and don’t let noise disrupt your clarity. Your trade setup is your edge — trust it.
✏️ Disclaimer:
This is just my personal viewpoint. Always consult your financial advisor before taking any action.

#NIFTY Intraday Support and Resistance Levels - 29/04/2025Gap up opening expected in nifty near 24450 level. After opening if nifty starts trading and sustain above 24500 level then possible strong upside rally towards the 24750+ level in today's session. Any downside or reversal expected near 24450 level. Downside 24250 level will act as a strong support for today's session.

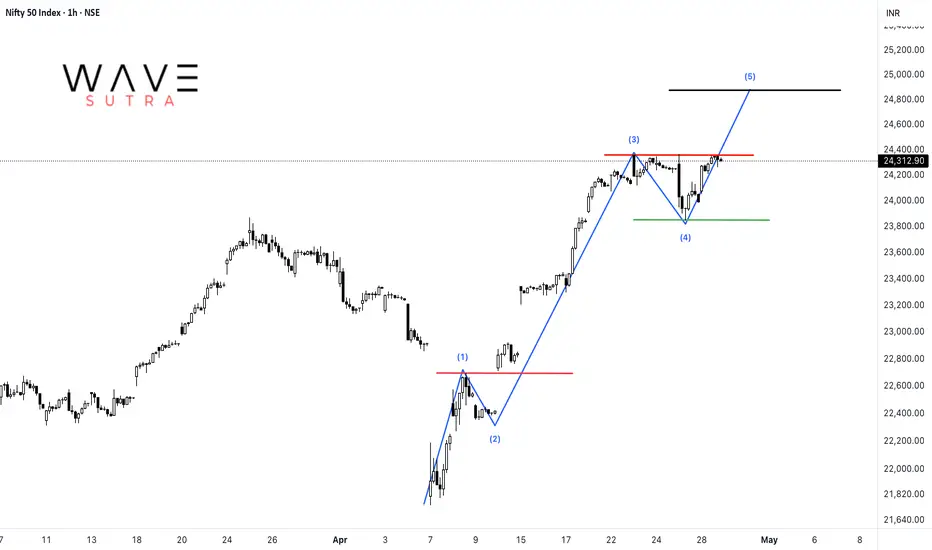
NIFTY: Impulse formationNifty is rising in an impulsive manner of which 4th wave is already concluded at 23847 zone and currently trading under wave-5. This shall take the index towards 24875 zone where wave-5 becomes equal to wave-1.
Nifty Elliott wave update for 29april Tuesday onwardsIn this Video I have explained Elliott wave analysis of Nifty on 3hour, 15 min chart and 5min chart in detail to conclude what are the possible scenarios possible in Nifty index from 29april Tuesday onwards.... Kindly watch full video for detail understanding. It will help you to understand how to use Elliott wave theory practically on charts.
Thank you for watching....

Nifty on the verge of Trendline Breakout. There is a major possibility of a Trendline Breakout amidst the rumblings on conflict with enemy nations. The main reason for Market rally today was Superb results posted by Reliance and a rally in PSU, Capital goods and defense related stocks. A lot of stocks that were oversold in the knee-jerk reaction on Friday also tried to catch-up. As the situation on the border remains tense we can have a sudden major decline as a reaction to the Geo-Political proceedings. Thus investors are asked to remains cautious and not to carry heavy derivative positions overnight. Even in the eventuality of a war actually happening one think of remaining invested in companies that can bounce back faster once the situation de-escalates.
Major Supports for Nifty on daily chart now remain at: 23988, 23708, 23415 (Major Father line support), 23325 (Major Mother Line Support) in case of Mother and Father line failing Bears can drag Nifty further down to 22875, 22142 and 21844.
Major Resistances For Nifty remain at: 24359 (Major Trend line resistance), 24538, 24816 (Is another major resistance on Fibonacci scale), If we get a closing above 24816 Nifty can easily flow towards 25183, 25399 and 25603.
Disclaimer: The above information is provided for educational purpose, analysis and paper trading only. Please don't treat this as a buy or sell recommendation for the stock or index. The Techno-Funda analysis is based on data that is more than 3 months old. Supports and Resistances are determined by historic past peaks and Valley in the chart. Many other indicators and patterns like EMA, RSI, MACD, Volumes, Fibonacci, parallel channel etc. use historic data which is 3 months or older cyclical points. There is no guarantee they will work in future as markets are highly volatile and swings in prices are also due to macro and micro factors based on actions taken by the company as well as region and global events. Equity investment is subject to risks. I or my clients or family members might have positions in the stocks that we mention in our educational posts. We will not be responsible for any Profit or loss that may occur due to any financial decision taken based on any data provided in this message. Do consult your investment advisor before taking any financial decisions. Stop losses should be an important part of any investment in equity.

Nifty Analysis EOD - 28th April 2025🟢 Nifty Analysis EOD - 28th April 2025 🔴
Nifty almost retraced 25th April’s fall — Back to Square One... What Next?
📈 Market Summary
Nifty almost retraced 25th April’s fall — Back to Square One... What Next?
As highlighted in previous sessions, the 24,330 ~ 24,360 zone once again proved to be a crucial resistance. Today, along with the past three sessions, we observed Nifty struggling to breach this wall — a fact clearly visible on the 75-minute time frame chart.
Now the big question:
➡️ Tomorrow, can Nifty decisively breach 24,365 and sprint towards 24,500?
Well, time will answer, but we must stay prepared for moves on either side.
Intraday Walk:
Nifty opened with a gap-up above the psychological 24,000 level at 24,070.
With a slow yet steady bullish pace, it hit a high of 24,355.
After touching this critical resistance, it spent almost 2 hours consolidating in the same zone.
Finally, it closed at 24,312, defending most of its intraday gains — a strong show of resilience by the bulls.
🕯 Daily Candle Structure
Today's Candle:
🟢 Strong Bullish Candle (Almost a Marubozu)
Open: 24,070.25
High: 24,355.10
Low: 24,054.05
Close: 24,328.50
Change: +289.15 points (+1.20%)
Key Observations:
The session opened slightly above yesterday’s close and dipped just marginally.
Buyers took charge from the very beginning, consistently pushing the index higher.
Close near the day's high signals robust bullish momentum.
The candle has a tiny lower shadow and minimal upper shadow, indicating persistent buying throughout the day.
What It Implies:
Clear bull dominance.
Willingness among buyers to step up even at higher levels.
If external cues remain supportive, momentum could continue into the next session.
🛡 Gladiator Strategy Update
ATR: 344.11
IB Range: 182.1 (Medium IB)
Market Structure: Balanced
Trade Highlights:
1st Trade: Long Entry triggered at 10:05 AM — SL Hit
2nd Trade: Long Entry triggered at 11:25 AM — 1:2 Target Achieved
Additional Trade (Discretionary Contra): Short Entry at 14:15 PM — 1:1.4 Target Achieved
🧾 Index Performance Snapshot
Nifty 50: +289 Points (+1.20%)
Bank Nifty: +768 Points (+1.41%)
Nifty 500: +254 Points (+1.16%)
Midcap: +870 Points (+1.62%)
Smallcap: +130 Points (+0.78%)
📍 Key Levels to Watch
Resistance Zones:
🔹 24,330 ~ 24,360 (Immediate hurdle)
🔹 24,480 ~ 24,540 (24,500 psychological level inside this zone)
🔹 24,800
Support Zones:
🔹 24,190 ~ 24,225 (Immediate support)
🔹 24,120
🔹 24,050
🔹 24,000 ~ 23,950
🔹 23,820
🔹 23,710 ~ 23,660
🔹 23,500
🔹 23,410 ~ 23,370
🔹 23,215
🎯 Final Thoughts
"Structure is key. When levels work, respect them. When they break, adapt."
The current structure indicates bulls have made a strong comeback, but remember — 24,330 ~ 24,360 remains the battleground. Only a decisive breakout above can ignite a rally towards 24,500+. Otherwise, we stay watchful for possible reversals.
Stay sharp, stay prepared!
✏️ Disclaimer ✏️
This is just my personal viewpoint. Always consult your financial advisor before taking any action.
#NIFTY Intraday Support and Resistance Levels - 28/04/2025Nifty will open gap up in today's session. Expected opening near 24200 level. After opening if 24150-24250 zone will act as a consolidation for today's session. Any strong upside rally only expected if nifty starts trading and sustain above 24250 level. Downside movement expected if nifty starts trading below 24150 level. Below this level downside move expected upto 23850 support level in today's session.

How India's Market performed during war like situtation ?espite facing wars, cross-border tensions, and unexpected shocks, the Indian stock market has consistently demonstrated remarkable resilience.
🔹 Kargil War (May–July 1999)
Index declined 9.3% from 1,084 to 916 but rebounded sharply — hitting 1,201 the next month, and soaring 40%+ by war's end.
🔹 Surgical Strikes (September 2016)
Short-term 1–2% dip, with a deeper 12.9% correction by November 2016. But markets recovered strongly, rallying 22%+ over the next 3 months.
🔹 Cross-border Tensions (February 2019)
Small dip of 1–2%, with Nifty swiftly rebounding from 10,500 levels in February to above 12,100 by June.
📊 The message is clear:
Short-term volatility happens.
Long-term resilience wins.
Stay invested. Stay informed.
Trust the process.

Nifty Analysis EOD - April 25, 2025🟢 Nifty Analysis EOD - April 25, 2025 🔴
"Inside Bar Alert — Calm Before the Storm"… And Then the Storm Hit!
📊 Market Recap: A Walk? No. A Sprint Downhill!
As we noted in yesterday’s report, the Inside Bar setup was hinting at a possible breakout—today, it delivered that breakout with thunder and lightning. And if you blinked, you probably missed it.
Nifty opened at 24,289, looked like it might test bullish waters by attempting PDH twice within the first 15 minutes, but the sellers were just getting warmed up. What followed was a merciless 400-point drop in just 30 minutes, slicing through level after level like a knife through butter.
Zone after zone fell like dominoes:
CDO
CPR Zone
PDH
S1, S2, S3, S4
24,225, 24,188
200 SMA at 24,052
24,000 ~ 23,951 Zone
Virgin Zone 23,905 ~ 23,872
Absolutely brutal sell-off. No mercy. No pause. Just raw momentum to the downside.
🕯️ Daily Candle Structure: Long-Legged Bearish
Today’s daily candle adds a strong bearish tone to the chart:
Open: Flat to Mild Gap-Up
High: 24,365.45
Low: 23,847.85
Close: Deep in red
Despite a small attempt at recovery near the lows, buyers couldn’t even regain the opening level. What’s left is a long-legged bearish candle, indicating volatility, intraday recovery attempt, and bear dominance.
📌 This type of candle often signals distribution or exhaustion, especially when it appears after a long rally. If the next session continues the bearish move, this might be the start of a short-term correction. If we get a bullish bounce, then today’s low may act as a temporary support.
🔍 Recalling the Setup:
We previously observed a Hanging Man on April 23, signaling a possible reversal. Then, the Inside Bar formed on April 24—a classic setup for a breakout.
✔️ Our expectation: 1x Mother Bar Range as a move
✔️ Bias: Slightly Bearish due to the Hanging Man and overall overextended rally
❌ Expectation: Didn’t expect this much bloodshed this fast!
📌 Gladiator Strategy Update
ATR: 347.27
IB Range: 405.4 (Extra Large IB)
Market Structure: Balanced
🎯 Trade Highlights:
No System Trade: Setup didn’t align with risk management rules
Additional Trade (Discretionary Contra):
Long Entry Triggered at 12:35 PM
✅ Target Achieved: 1:3.7 Risk-Reward
📉 Index Performance Snapshot:
Nifty 50: -207 Points (-0.86%)
Bank Nifty: -537 Points (-0.97%)
Nifty 500: -332 Points (-1.5%)
Midcap: -1399 Points (-2.5%)
Smallcap: -416 Points (-2.45%)
Midcaps and smallcaps took the biggest hit, showing broad-based weakness across the market.
📌 Key Levels to Watch
📍 Resistance Zones:
24,050
24,120
24,190 ~ 24,225
24,330 ~ 24,360
24,480 ~ 24,540
24,800
📍 Support Zones:
24,000 ~ 23,950 (Immediate)
23,820
23,710 ~ 23,660
23,500
23,410 ~ 23,370
23,215
🧭 Final Thoughts:
"The storm doesn't announce itself with thunder—it begins with silence. Yesterday was silent. Today was the thunder."
The Inside Bar setup has played out, but now eyes are on whether we get follow-through selling or a relief bounce. The next session’s first 30–45 mins might give a clue.
✏️ Disclaimer ✏️
This is just my personal viewpoint. Always consult your financial advisor before taking any action.
#NIFTY Intraday Support and Resistance Levels - 25/04/2025Gap up opening expected in nifty. Expected opening near 24500 level. After opening if nifty starts trading above 24550 level then possible strong upside rally towards the 24750+ level in opening session. Downside 24300 level will act as a strong support for today's session. Any major downside only expected below 24200 level.

Nifty Spot Daily Trend Analysis from April 25, 2025Technical Outlook:
Nifty Spot is approaching a potential resistance near the Gann 720° level at 24,539. A minor correction appears likely, and we are currently awaiting short signal confirmation from one of our proprietary indicators. Should a decline occur, the index may find support around the Sine Wave level of 23,398. A break below this level could suggest a continuation of the bearish momentum.
At present, most indicators are still trending upwards. However, the bar formations on the chart hint at a possible reversal. Once the MastersSignal confirms a short setup, we will reassess confluence around the Gann 720° value to strengthen conviction.
Disclaimer: This is my personal technical view. Traders should conduct their own analysis and implement strict risk management before initiating any trades.

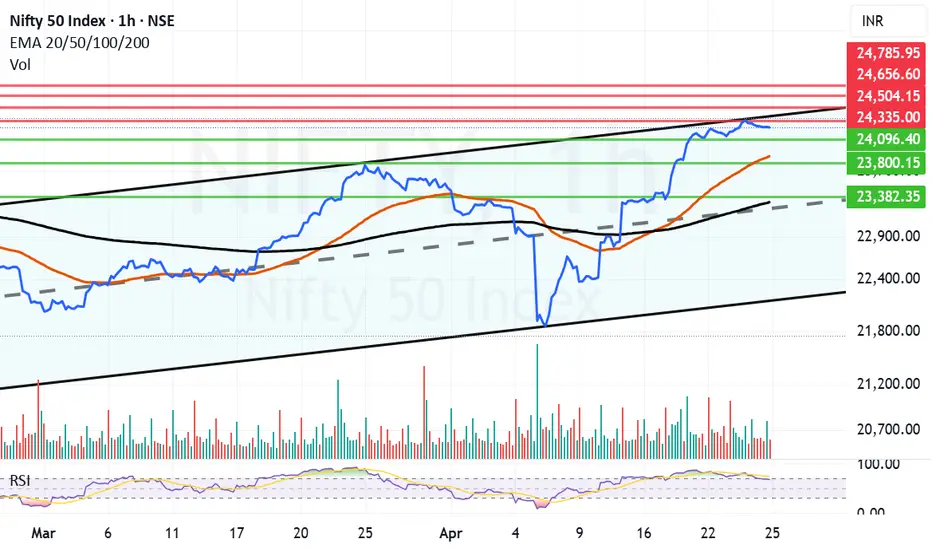
Nifty has hit a channel top with geopolitical events unravellingNifty was swiftly recovering after the Tariff war induced fall. On technical front Nifty has hit a channel top In the hourly line chart. Chanel tops are not easy to conquer and we saw Nifty retrieving today from there. Adding pressure to the rally is the Geo-Political situation after the Dastardly Pahalgam Terrorist Attack. If there is any action by India like Balakot (Swift and fast) any way it will be denied by Pakistan so nothing much will happen to Index. If there is only Political/Geopolitical long term steps taken again it will have less effect on the market. Market may decline drastically only if there is a full blown war between the 2 countries or more than 2 countries. (Possibility of that happening is less but we never know). Not much is in our hand if such a scenario arises. FIIs were seen buying big today so that is something to watchout in the coming days.
Technical Supports for Nifty remain at: 24096, 23882 (Mother Line Support), 23800 and 23316 (Father Line Support). (Mid channel support is also around 23300) so this zone presents a strong support zone.
Technical Resistances Remain at: 24335 (Major Channel Top Resistance), 24504, 24656 and 24785.
Disclaimer: The above information is provided for educational purpose, analysis and paper trading only. Please don't treat this as a buy or sell recommendation for the stock or index. The Techno-Funda analysis is based on data that is more than 3 months old. Supports and Resistances are determined by historic past peaks and Valley in the chart. Many other indicators and patterns like EMA, RSI, MACD, Volumes, Fibonacci, parallel channel etc. use historic data which is 3 months or older cyclical points. There is no guarantee they will work in future as markets are highly volatile and swings in prices are also due to macro and micro factors based on actions taken by the company as well as region and global events. Equity investment is subject to risks. I or my clients or family members might have positions in the stocks that we mention in our educational posts. We will not be responsible for any Profit or loss that may occur due to any financial decision taken based on any data provided in this message. Do consult your investment advisor before taking any financial decisions. Stop losses should be an important part of any investment in equity.
Nifty Analysis EOD - April 24, 2025🟢 Nifty Analysis EOD - April 24, 2025 🔴
Inside Bar Alert—Calm Before the Storm?
📊 Market Recap:
Nifty opened at 24,284, marking a Gap Down of 51 points (-0.21%) from the previous close. The day began on a surprisingly calm note, but that didn’t last long. Within just 15 minutes, Nifty spiked over 100 points, rushing toward PDH (Previous Day’s High)—only to reverse sharply in the next 15 minutes and create a new intraday low.
📉 This wild back-and-forth action in the first hour was nothing short of a nightmare for intraday traders—especially those trying to catch a trend early. If anything, scalpers might’ve had the best time, capitalizing on the swift movements in both directions.
For the remainder of the session, Nifty oscillated within the CPR zone, with a few false breakout candles that quickly retraced. The structure remained range-bound, indecisive, and tricky to navigate.
📅 Expiry Day Check: Deja Vu, Minus the Volatility
If we set aside the unusually directional move of April 17th expiry, today looked like a textbook expiry day, much like the past 10 before it:
Movement hugging VWAP
Small false breakouts on either side
No follow-through
Today’s range: 132 points
Avg range of last 10 expiries: 192 points
This time, however, the volatility was muted, despite early session fireworks.
🕯 Daily Candle Structure: Inside Bar + Shooting Star
On the Daily chart, today’s price action has formed a bearish Shooting Star–like candle, but here’s the kicker—it’s also an Inside Bar setup.
📌 What’s an Inside Bar?
An Inside Bar pattern occurs when today’s high and low are completely within yesterday’s range (the “mother bar”). This signals consolidation or indecision, and often precedes a strong breakout.
📖 How to trade it?
Wait for a decisive breakout above the mother bar high or below the mother bar low. Add confirmation with volume surge to gauge the strength of the breakout.
👉 Remember: The Inside Bar doesn’t predict direction—it just tells you a move is brewing.
📌 Gladiator Strategy Update
ATR: 328.34
IB Range: 108.40 (Small IB)
Market Structure: Balanced
🎯 Trade Highlights:
No Trade Opportunity Presented — The structure didn’t offer any valid setups within strategy rules.
🧠 Index Performance Snapshot:
Nifty 50: -82 Points (-0.34%)
Bank Nifty: -168.65 Points (-0.30%)
Nifty 500: -57 Points (-0.26%)
Midcap: -71 Points (-0.13%)
Smallcap: -6 Points (-0.04%)
📌 Key Levels to Watch
📍 Resistance Zones:
24,330 ~ 24,360
24,480 ~ 24,540
24,800
📍 Support Zones:
24,190 ~ 24,225
23,950 ~ 24,000 (Immediate)
23,820
23,660 ~ 23,710
23,500
23,400 ~ 23,430
23,200 ~ 23,190
🧭 Final Thoughts:
"Inside Bars are like market whispers—subtle, quiet, but worth listening to. The next breakout might just surprise you."
✏️ Disclaimer ✏️
This is just my personal viewpoint. Always consult your financial advisor before taking any action.
Nifty--Demand Zone and Liquidity @23400 Nifty index is broken the strong resistance at 23800 levels and taken the liquidity at 24220 levels...
now price action is sideways or trading in a range bound market.
expecting some pullback for further continuation....
wait for buyers exhaustion before short...
we have a clear demand zone at 23400 levels...
when price confirms the bullishness here, after the liquidity grab below the demand will observe a strong up move again...
there are bullish gaps @22800 levels...price has to give pullback for further upside move...
the above one is a clear buying plan for the targets of 24800 and 25200 liquidity.
--->>still we have no sign of bearishness is seen in Nifty.

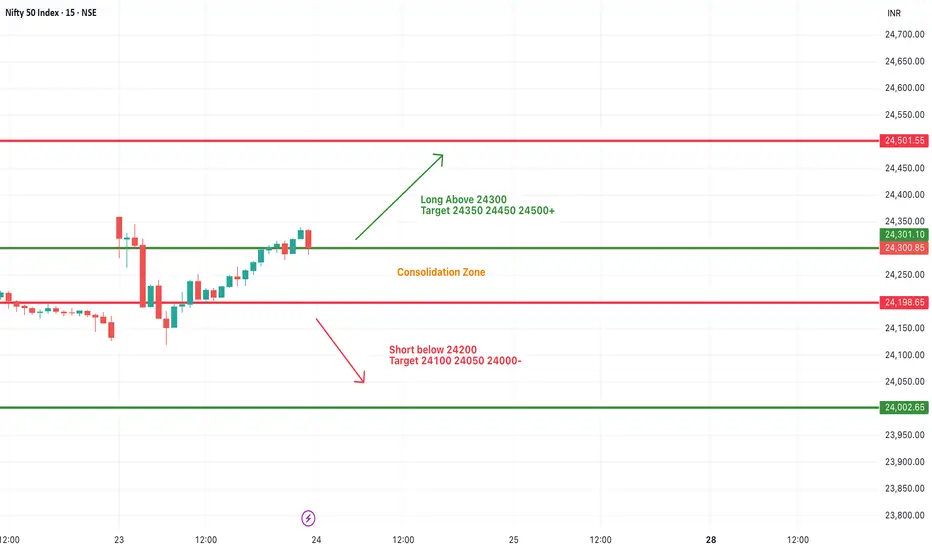
#NIFTY Intraday Support and Resistance Levels - 24/04/2025Gap down opening expected in nifty. Expected opening near 24200 level. 24200-24300 levels are the consolidation zone for the today's session. Strong upside rally expected if nifty starts trading and sustain above 24300 level. Any downside only expected below 24200 level. Downside 24000 level will act as a strong support for today's session.
ASTRAL LTD | At Key Trendline Resistance | Breakout or Rejection🟢 Buy Recommendation (Breakout Trade)
Entry: Buy only on breakout and daily close above ₹1,420–₹1,430 (above trendline resistance).
Target 1: ₹1,550
Target 2: ₹1,650
Stop Loss: ₹1,320 (below recent consolidation support)
📌 Rationale: If price breaks above the trendline on good volume and closes above ₹1,430, a trend reversal may begin.
🔴 Sell/Short Recommendation (Rejection Trade)
Entry: Sell if the price gets rejected from ₹1,400–₹1,420 and shows a red candle (confirmation).
Target 1: ₹1,280
Target 2: ₹1,180
Stop Loss: ₹1,445 (above the trendline)
📌 Rationale: If the price fails to break the trendline, it could resume the downtrend. RSI is overbought, and sellers might take over.
for educational purposes only

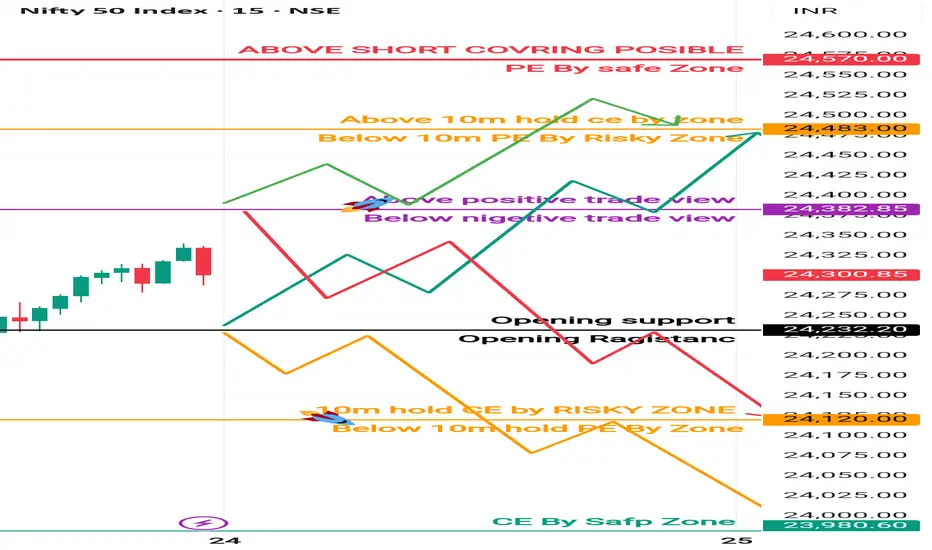
24 April Nifty50 trading zone prediction #Nifty50 #option trading
99% working trading plan
👉Gap up open 24382 above & 15m hold after positive trade target 24483, 24570
👉Gap up open 24382 below 15 m not break upside after nigetive trade target 24233, 24120
👉Gap down open 24233 above 15m hold after positive trade target 24382, 24480
👉Gap down open 24233 below 15 m not break upside after nigetive trade target 24120, 24000
💫big gapdown open 24120 above hold 1st positive trade view
💫big Gapup opening 24483 below nigetive trade view
Trade plan for education purpose I'm not responsible your trade
More education follow & support me
Nifty Analysis EOD - April 23, 2025🟢 Nifty Analysis EOD - April 23, 2025 🔴
"Hanging Man Candle on Bullish Trend—Pause or Plot Twist?"
📊 Market Recap:
As anticipated from the ongoing bullish structure, Nifty opened with a strong Gap-Up at 24,357, adding +192 Points (+0.79%) to the charts. However, what looked like a continuation day quickly turned cautious. The initial candle marked the day’s high (Open = High scenario, nearly exact) and started a gap-filling move, pushing prices back to CPR.
The market respected CPR as a support, then moved back towards its mean (VWAP) where the PDH + R1 zone resisted price action effectively until 1 PM. Post that, Nifty finally broke out, sustained above the zone, and closed at 24,300—still holding gains despite a red candle, which visually seems bearish but technically closes above VWAP + PDH. Hence, a hidden bullish undertone remains.
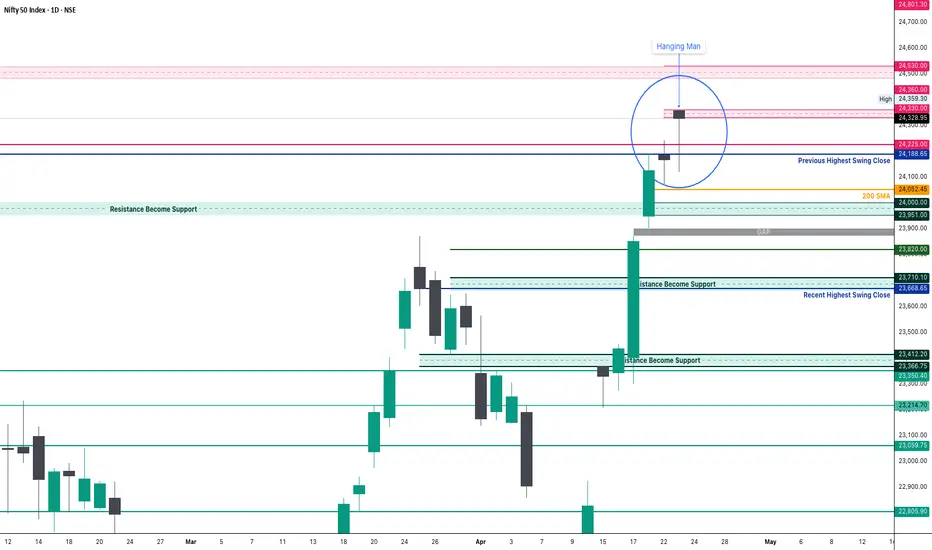
🕯 Daily Candle Check: Is It a Hanging Man?
A textbook Hanging Man candle appears to have formed on the Daily Chart—a bearish reversal pattern that shows potential weakness at the top of a rally.
📌 Candle Stats:
Body: 28 points
Lower Shadow: 209 points
Upper Shadow: 2 points
Shadow-to-body ratio: 209 / 28 = 7.4x
✅ Trend Context: Yes, uptrend present
✅ Candle Structure: Meets all parameters
👉 Verdict: Confirmed Hanging Man Candle
This hints that selling pressure is gradually creeping in while buying strength might be exhausting. But a Hanging Man alone isn't a trade trigger—confirmation is key. So we watch tomorrow’s session to decide whether it’s just a pause or a trend shift.
📈 Intraday Insight: Head & Shoulders Pattern
During the session’s consolidation and bounceback phase, a Head & Shoulders pattern played out intraday with its target being 24,300—achieved successfully by EOD.
🔍 Pattern Recap:
This bullish reversal structure shows three dips, with the central one (head) being the deepest and two shallower ones (shoulders). A break above the “neckline” confirmed bullishness—supporting the rebound above VWAP.
📌 Gladiator Strategy Update
ATR: 350.19
IB Range: 94.75 (Small IB)
Market Structure: Imbalanced
🎯 Trade Highlights:
First Trade: Short – Triggered at 10:05 AM — ✅ 1:1.5 Target Achieved
Second Trade: Long – Triggered at 13:40 PM — ✅ 1:1.5 Target Achieved
Additional Trade (H&S Pattern): Long – Triggered at 11:40 AM — ✅ Pattern Target Achieved
🧠 Index Performance Snapshot:
Nifty 50: +161 Points (+0.67%)
Bank Nifty: -277 Points (-0.5%), but a new ATH at 56,098
Nifty 500: +152 Points (+0.69%)
Midcap: +644 Points (+1.18%)
Smallcap: +74 Points (+0.44%)
📌 Key Levels to Watch
📍 Resistance Zones:
24,330 ~ 24,360
24,480 ~ 24,540
24,800
📍 Support Zones:
24,190 ~ 24,225
23,950 ~ 24,000 (Immediate)
23,820
23,660 ~ 23,710
23,500
23,400 ~ 23,430
23,200 ~ 23,190
🧭 Final Thoughts:
"Reversal or Reset? Structure is key. When levels work, respect them. When they break, adapt."
✏️ Disclaimer ✏️
This is just my personal viewpoint. Always consult your financial advisor before taking any action.
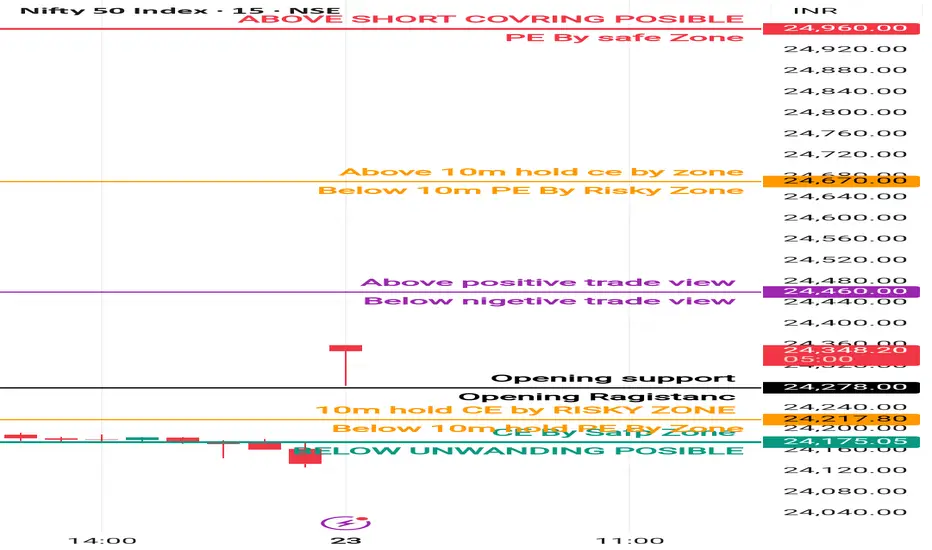
23 Nifty new update level New support 24278 strong
New ragistanc 24460
2nd ragistanc 24670
3rd ragistanc 24960
#NIFTY Intraday Support and Resistance Levels - 23/04/2025Gap up opening expected in nifty. After opening if nifty sustain above 24250 level then upside rally upto 24500+ level expected in index. Upside 24500 level will act as a strong resistance for today's session. Any further strong rally only expected after breakout of this level. Any downside movement only expected if nifty starts trading below 24200 level.
