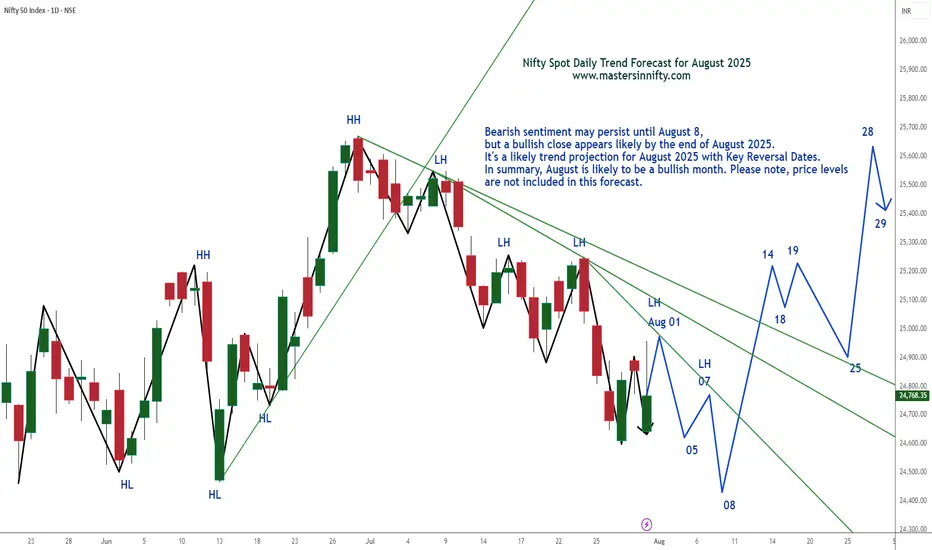
Nifty Spot Index Projection Line for August 2025Bearish sentiment may persist until August 8, but a bullish close appears likely by the end of August 2025.
It's a likely trend projection for August 2025 with Key Reversal Dates. In summary, August is likely to be a bullish month. Please note, price levels are not included in this forecast.
Traders are suggested to conduct own technical studies before entering into the trades and proper risk management is a must.
This is just my personal view.
Best of Luck & Happy Trading.
Niftytrendanalysis
Nifty Chart📉 Nifty Technical Outlook – Bearish Bias with Macro Overhang
Nifty continues to show bearish momentum, having taken strong resistance near the 25450–25800 zone, which aligns with the runaway gap on the daily chart and the 78.6% Fibonacci retracement level from the recent decline.
On the short-term chart, a Head and Shoulder breakdown has already occurred, followed by a retest, which supports the ongoing weak sentiment.
In addition to technical factors, India–US trade talks are currently in focus. Uncertainty around tariffs, tech cooperation, and strategic agreements may keep market participants cautious in the near term. Any negative development could add to downside pressure, while a breakthrough might limit losses.
🔻 Key Technical Levels:
Major Resistance: 25450–25800 (Runaway Gap + Fibo 78.6%)
Immediate Support: 24200 (short-term support zone)
Next Support: 23700 (historical support level)
As long as Nifty stays below 25450, the trend remains bearish, with potential downside toward 24150–24200 and further to 23700, depending on trade talk developments and market sentiment.
📝 Note: This analysis is intended only for study and educational purposes. Please consult a qualified advisor before making any investment decisions. Market behavior is subject to change based on news, global trends, and macroeconomic factors.

Comprehensive Technical Analysis: NIFTY50 ₹25060.90 as of 22/07Long-Term (Monthly/Weekly) - SWING PERSPECTIVE
Trend & Structure:
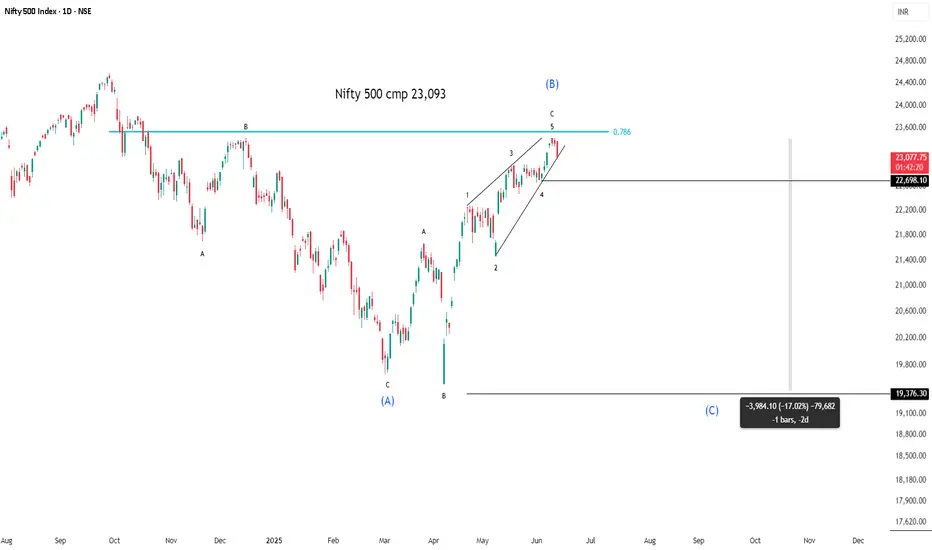
Elliott Wave:
Primary Trend: Bullish (Wave 3 or 5 ongoing since 2023).
Current Phase: Likely final sub-wave (Wave 5) targeting ₹25,800–26,200.
Risk: Completion of Wave 5 may trigger a 10–15% correction (ABC pattern) toward ₹22,500–23,000 (38.2% Fib retracement).
Wyckoff & Volume:
Accumulation/Distribution: Monthly volume declining near highs → early distribution signals.
Key Level: Close below ₹24,800 confirms distribution phase (bearish reversal).
Gann Analysis (Price-Time Squaring):
Square of 9:
Key Resistance: ₹25,317 (√25,060 ≈ 158.3; 158.5² = 25,132 → 159² = 25,281).
Major Support: ₹24,649 (157.5²), ₹24,000 (psychological + Gann 45° angle).
Time Cycle:
Aug-Sep 2025 critical for reversal (90-day cycle from April 2025 high).
Ichimoku (Weekly):
Kumo Cloud: Price above cloud → bullish bias.
Lagging Span (Chikou): Above price (26 weeks back) → no congestion.
Warning: Tenkan (9) below Kijun (26) on weekly → momentum loss.
Moving Averages (Weekly):
Bullish Stacking: EMA(20) > EMA(50) > SMA(100) → trend intact.
Support: EMA(20) at ₹24,200
Medium-Term (Daily/4H) - SWING ENTRY
Candlestick Patterns:
Daily: Doji/Spinning Top near ₹25,060 → indecision.
4H: Bearish Shooting Star → resistance at ₹25,150–25,200.
Harmonic Patterns:
Bullish Bat potential (PRZ: ₹24,600–24,750).
Bearish Crab if price rejects ₹25,300 (PRZ: ₹25,280–25,350).
Gann Angles:
1x1 Angle Support (from June 2025 low): ₹24,900 (break → accelerates selling).
Price-Time Squaring:
24th July = 180° from Jan 2025 low → watch for volatility.
RSI + Bollinger Bands (Daily):
RSI(14): 68 (neutral-bearish divergence → weakening momentum).
BB(20,2): Price near upper band (₹25,200) → overbought.
VWAP (4H): Price above VWAP → intraday bullish, but divergence at highs.
Intraday (1H/30M/15M/5M)
Ichimoku (1H):
Tenkan (9) > Kijun (26): Bullish.
Kumo Twist: Support at ₹24,950 (cloud top).
Sell Signal: If price breaks below Kijun (₹25,010).
Moving Averages (30M):
EMA(20): ₹25,040 (intraday support).
Death Cross: EMA(20) < SMA(50) on 15M → short-term bearish.
RSI + BB (15M):
RSI(14): 72 → overbought.
BB Squeeze: Bands narrowing → expect breakout (bearish bias below VWAP).
Gann Intraday Levels (5M):
Resistance: ₹25,100 (1x1 angle), ₹25,180 (2x1).
Support: ₹24,980 (1x1 downside), ₹24,920 (2x1).
Synthesis & Trading Plan
Bullish Scenario (Swing):
Trigger: Hold above ₹24,900 (Gann 1x1) + RSI > 60 on weekly.
Target: ₹25,800–26,200 (Wave 5, Gann Square 159²).
Stop Loss: ₹24,650 (Harmonic Bat PRZ).
Bearish Reversal (Intraday/Swing):
Trigger: Close below ₹24,950 (Ichimoku cloud) + RSI < 50.
Target: ₹24,600 (Harmonic Bat), ₹24,000 (monthly SMA).
Stop Loss: ₹25,200 (Bollinger upper band).
Intraday Levels (23rd July):
Resistance Support
₹25,100 (1H VWAP) ₹25,000 (psych)
₹25,180 (Gann 2x1) ₹24,950 (Ichimoku)
₹25,280 (Sq9) ₹24,800 (daily pivot)
Key Risk Factors
Gann Time Cycle: 24–28 July = high volatility (price-time square).
Elliott Terminal Wave: Wave 5 exhaustion → strict stop losses.
VWAP Divergence: Failure to hold above VWAP on 4H → short.
Instrument: NIFTY50
Strategy:
Swing: Wait for daily close above ₹25,150 (confirms bullish) or below ₹24,800 (bearish).
Intraday: Sell rallies to ₹25,100–25,150 (RSI>70, BB squeeze) for ₹24,950.
Verified Tools:
Gann Square of 9 + Ichimoku for precision entries.
RSI/BB for overbought/oversold filters.
For those interested in further developing their trading skills based on these types of analyses, consider exploring the mentoring program offered by Shunya Trade.(world wide web shunya trade)
I welcome your feedback on this analysis, as it will inform and enhance my future work.
Regards,
Shunya Trade
world wide web shunya trade
⚠️ Disclaimer: This post is educational content and does not constitute investment advice, financial advice, or trading recommendations. The views expressed here are based on technical analysis and are shared solely for informational purposes. The stock market is subject to risks, including capital loss, and readers should exercise due diligence before investing. We do not take responsibility for decisions made based on this content. Consult a certified financial advisor for personalized guidance.


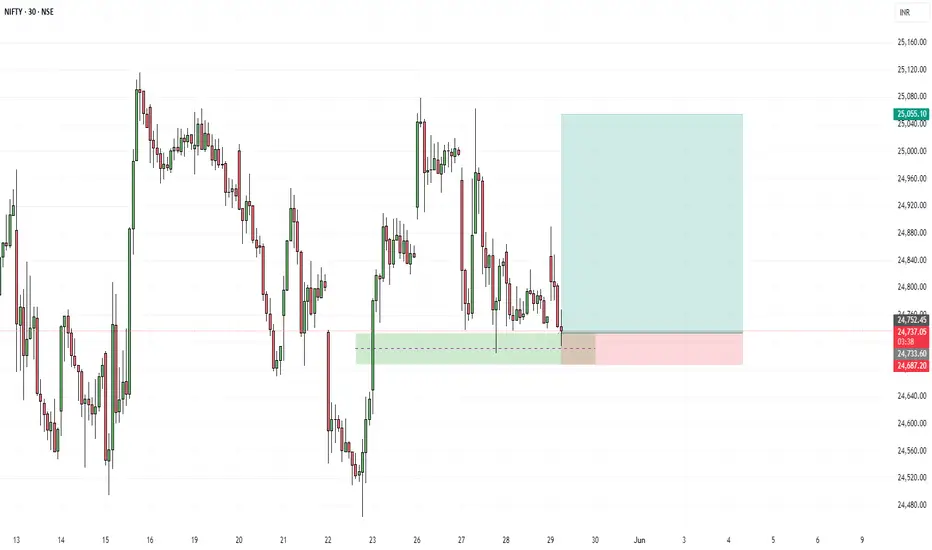
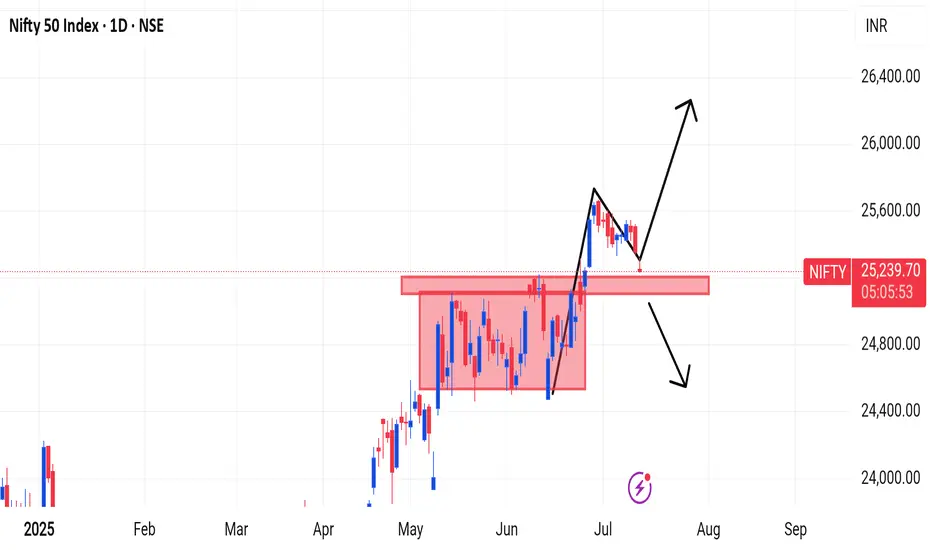
NIFTY 1. Rectangle Box (Sideways Zone)
Nifty had earlier made a strong range-bound consolidation around 24,400 -25,000.
This has now become a strong support zone (red shaded area).
2. Breakout & Retest Pattern:
Nifty then broke out of this zone and went to around 25,600.
Now it is retesting the same old resistance (now support).
3. Price Action Zones:
Support Zone: 24,950 25,100
Resistance Zone: 25,600 - 25,800
If you find this helpful and want more FREE forecasts in TradingView, Hit the 'BOOST' button
Drop some feedback in the comments below! (e.g., What did you find most useful?
How can we improve?)
Your support is appreciated!
Now, it's your turn!
Be sure to leave a comment; let us know how you see this opportunity and forecast.
Have a successful week
DISCLAIMER: I am NOT a SEBI registered advisor or a financial adviser. All the views are for educational purpose only
Nifty in Volatile Range#NIFTY FUT– 25,508.0
S1 – 25,395.0
S2 – 25,348.0
R1 – 25,658.0
R2 – 25,718.0
Doji formation has seen post Red
candle with inline volume,
indicates consolidation on daily
chart. Nifty has closed above 7, 14
and 21 DMA that seen at 25487,
25337 and 25222 levels. Nifty
future has resistance at 25658
levels while support seen at 25395
level..
More support and Resistance Show in chart...
All information Education Purpose only
Mount Fuji Series- Old runners waking upMount Fuji Series- Old runners waking up -
TARC - started running after 50-70 levels.. hope getting ready again.
Realty company with good land holding. Funda strong company.

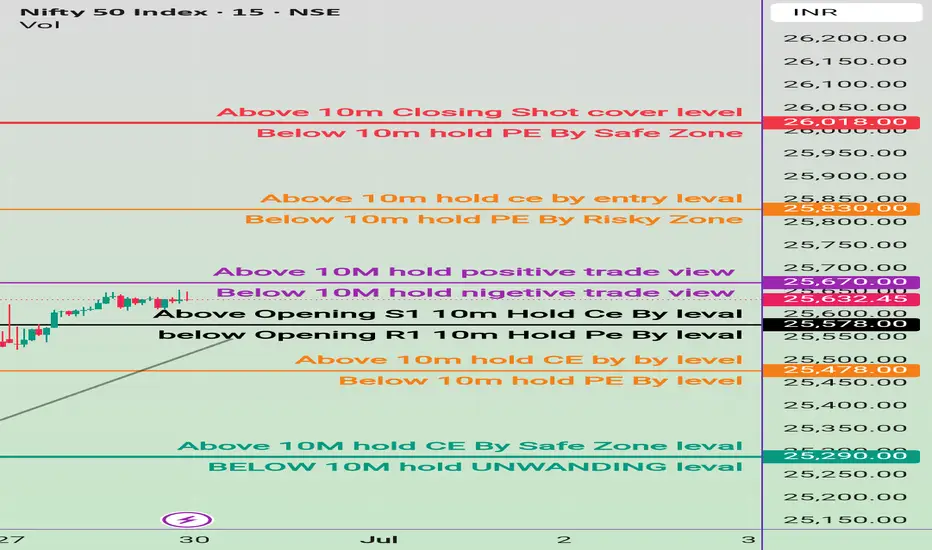
28 june Nifty50 brekout and Breakdown leval ✅ Level 1: ₹26,018
Above 10-Min Candle Closing
🔹 Indicates a short covering zone
🔸 Strategy: Close all PE positions, shift to CE or book profits
Below 10-Min Candle
🔹 Hold PE positions (Safe Zone)
🔸 Suggests market facing resistance here
✅ Level 2: ₹25,830
Above 10-Min Candle
🔹 Entry-level for holding CE positions
🔸 Possible bullish breakout
Below 10-Min Candle
🔹 Hold PE – but this is a Risk Zone
🔸 Caution: Trend reversal may happen
✅ Level 3: ₹25,670
Above 10-Min Candle
🔹 Indicates positive market sentiment
🔸 Hold CE (Calls)
Below 10-Min Candle
🔹 Indicates negative trade view
🔸 Hold PE (Puts)
✅ Level 4: ₹25,578
Above Opening S1 Level (10-Min Candle)
🔹 CE buy/hold confirmation
Below Opening R1 Level (10-Min Candle)
🔹 PE hold confirmation
🔸 Market turning weak
✅ Level 5: ₹25,478
Above 10-Min Candle
🔹 Buy/Hold CE
Below 10-Min Candle
🔹 Buy/Hold PE
🔸 Important pivot level – directional bias confirmation
✅ Level 6: ₹25,290
Above 10-Min Candle
🔹 Safe Zone to hold CE
Below 10-Min Candle
🔹 Unwinding zone
🔸 Exit CE positions, reduce longs – possible sharp fall
📊 Live Market Reference
Current Market Price (CMP): ₹25,632.45
Below ₹25,670 = Negative Bias
Strategy: Until price crosses ₹25,670 and sustains for 10 min, avoid CE entries or keep trailing SL on PE.
🎯 Sample Option Strategy (Example):
If price is below ₹25,670:
✅ Buy PE (Put Option)
Strike: ATM or slightly ITM (e.g., 25,600 PE)
Stop-Loss: If price moves above ₹25,670
Target: ₹25,478 / ₹25,290
If price is above ₹25,670:
✅ Buy CE (Call Option)
Strike: ATM or slightly OTM (e.g., 25,700 CE)
Stop-Loss: If price breaks back below ₹25,670
Target: ₹25,830 / ₹26,018
📌 Important Notes:
This strategy is intraday based on 5-min chart levels.
Levels like ₹25,478 and ₹25,290 are key for risk management.
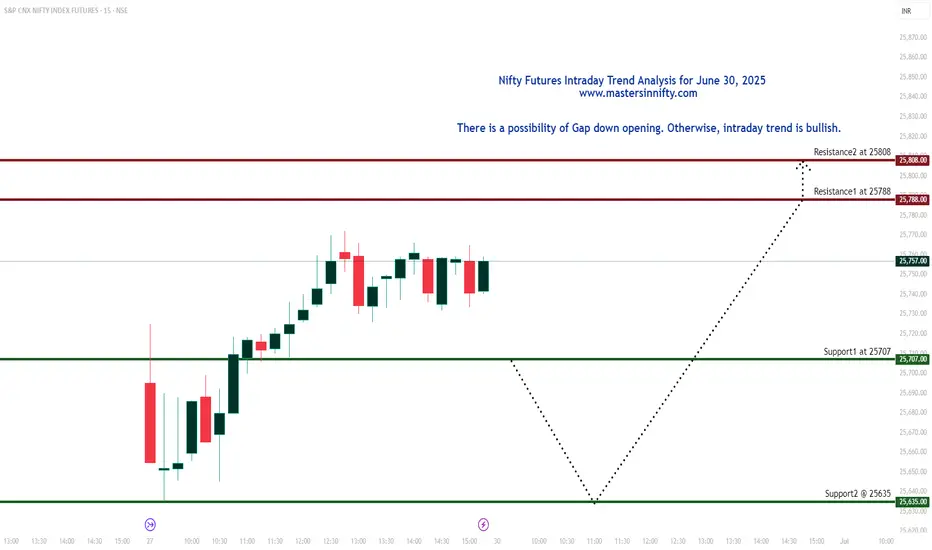
The Nifty Futures Intraday Trend analysis on June 30, 2025According to my analysis and time cycle study, a Gap Down opening is likely on Monday, June 30, 2025. However, the intraday trend appears bullish. Key support levels are at 25,707 and 25,635, while resistance is seen at 25,788 and 25,808. I consider 25,808 to be a strong resistance level—if breached, it may trigger further bullish momentum.
The magnitude of the gap remains uncertain. These levels reflect my personal analysis and are not guaranteed.
Trading in Futures and Options involves significant risk. Traders are strongly advised to conduct their own technical analysis before making trading decisions.
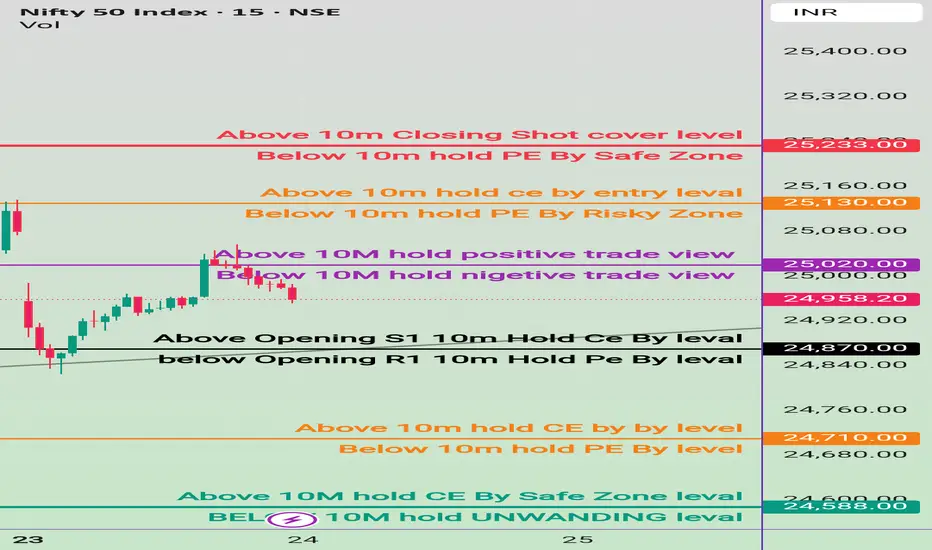
24 June nifty breakout & breakdown levels 🔺 Bullish (Call Option / CE) Strategy:
✅ Buy CE (Call Option) when:
Above 24,710 → Entry for bullish trade
"Above 10m hold CE by buy level"
Above 24,870 → Stronger confirmation
"Above Opening S1 10M Hold CE By level"
Above 25,020 → Positive trade view
"Above 10M hold positive trade view"
Above 25,130 → Safer CE entry zone
"Above 10M hold CE by entry level"
Above 25,233 → Closing shot level
"Above 10M Closing Shot cover level"
🔻 Bearish (Put Option / PE) Strategy:
✅ Buy PE (Put Option) when:
Below 24,710 → Entry for bearish trade
"Below 10m hold PE By level"
Below 24,870 → Bearish confirmation
"Below Opening R1 10M Hold PE By level"
Below 25,020 → Negative trade view
"Below 10M hold nigeative trade view"
Below 25,130 → Risky PE zone
"Below 10M hold PE By Risky Zone"
Below 25,233 → Safer PE Zone
"Below 10M hold PE By Safe Zone"
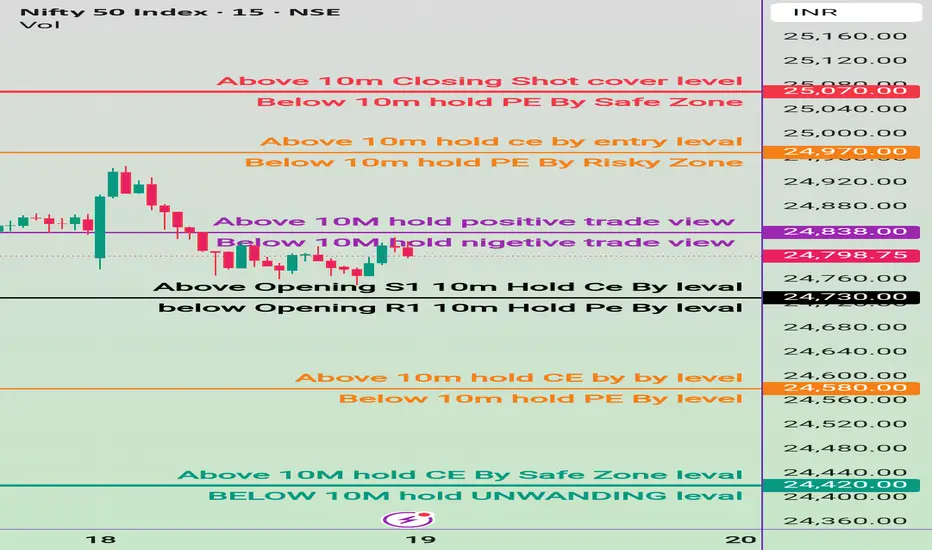
19 june Nifty50 brekout and Breakdown leval
✅ Safe Buy Zone (Support Levels):
24,437.70 → Above 10M: Hold CE by Safe Zone Level
24,420.00 → Below 10M: Hold Unwinding Level
→ Breach below could trigger unwinding / profit booking.
🔴 Resistance & Bearish PE Zones:
25,070.00 – Above 10m closing: Short Cover Level
→ Strong resistance; if crossed and sustained, short covering possible.
24,970.00 – Above 10m: Hold CE by Entry Level
→ Bullish entry confirmation level.
24,838.00 – Above 10M: Hold Positive Trade View
→ Indicates shift to bullish bias if held above.
⚫ Opening Based Levels:
24,730.00
→ Above Opening S1: Hold CE by Level
Below Opening R1 (level not clearly marked with value but appears near 24,730)
→ Hold PE by Level
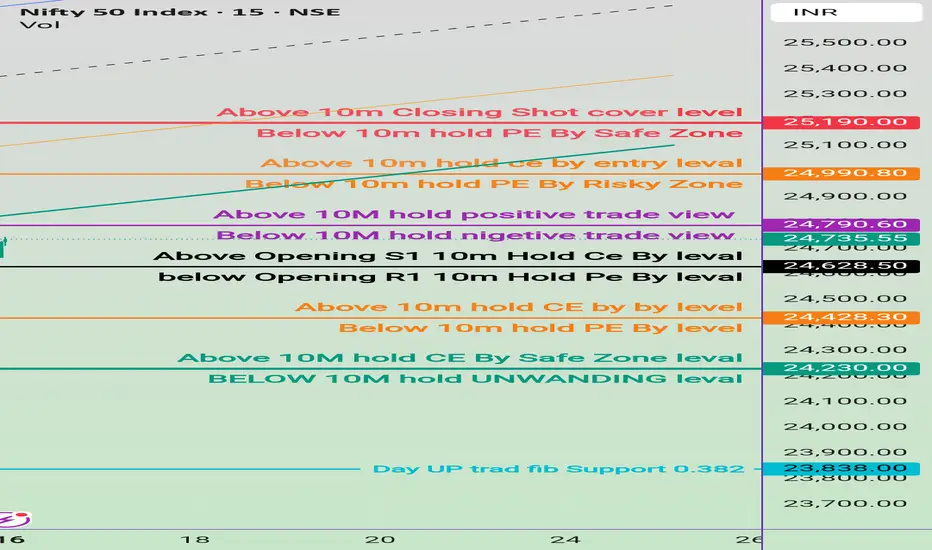
16 june Nifty50 brekout and Breakdown leval
🔺 Resistances / CE (Call) Holding Zones:
25,190.00 – 🔴 Above 10m Closing Shot Cover Level
24,990.80 – 🟠 Above 10m Hold CE by Entry Level
24,790.60 – 🟣 Above 10M Hold Positive Trade View
24,628.50 – ⚫ Above Opening S1 10m Hold CE by Level
24,428.30 – 🟠 Above 10m Hold CE by Level
24,230.00 – 🟢 Above 10M Hold CE by Safe Zone Level
🔻 Supports / PE (Put) Holding Zones:
Below 25,190.00 – Below 10m Hold PE by Safe Zone
Below 24,990.80 – Below 10m Hold PE by Risky Zone
Below 24,790.60 – Below 10M Hold Negative Trade View
Below 24,628.50 – Below Opening R1 10m Hold PE by Level
Below 24,428.30 – Below 10m Hold PE by Level
Below 24,230.00 – Below 10M Hold Unwinding Level
Nifty 12-JUNE-25 VIEW Everything is on chart for SWING view
AREA UP AREA LOW SPACE
AND MY VIEW FOR LONGTERM IS SAME

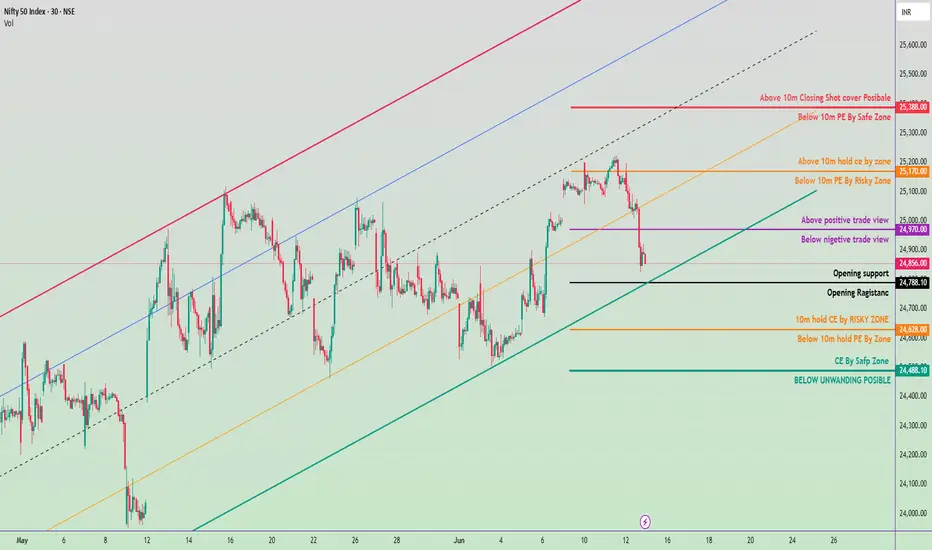
13june Nifty50 brekout and Breakdown leval✅ Bullish (Buy/Call - CE) Zones:
24628–Above 10m hold CE by zone
24788 –Above 10m hold CE by zone
24970 –Above 10m hold CE by zone
25170 –Above 10m hold CE by zone
25388 - Above 10m Closing: Shot Cover Possible
24488 -Above 10m hold CE By Safe Zone
Bearish (Buy/Put - PE) Zones:
25388 -Below 10m hold PE by zone
25170 –Below 10m hold PE by zone
24970 -Below 10m PE By Risky Zone
24628 -Below 10m Hold PE by Risky Zone
24488. BELOW UNWINDING POSSIBLE
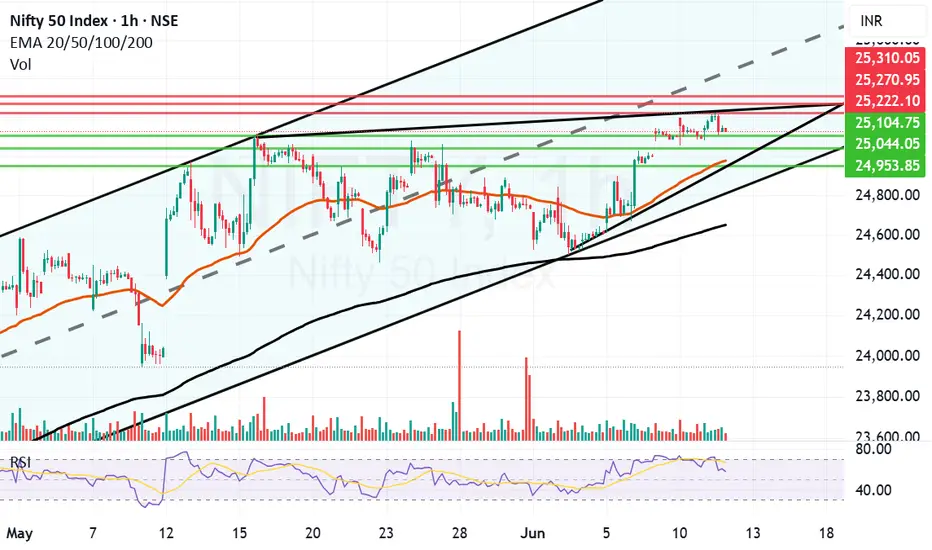
Nifty Facing resistnace above 25200 zoneToday Nifty closing above 25141 is a positive sign but it is evidently facing resistnace above 25200 zone. Nifty made a high of 25222 today but could not sustain at those levels and fell but eventually closed in the positive. The daily candle formed is an indecisive Doji.
IT Sector seems to be on the verge of a Reverse Head and Shoulder Breakout. If this breakout happens and Nifty gets support from other heavy weights we can see it growing further.
The resistances for Nifty now are at 25222, 25270 and 25310.
The supports for Nifty are at 25104, 25044, 24977 (Mother line support of Daily chart and 24953 Channel bottom. Things are in balance with shadow of the candle slightly positive.
Disclaimer: The above information is provided for educational purpose, analysis and paper trading only. Please don't treat this as a buy or sell recommendation for the stock or index. The Techno-Funda analysis is based on data that is more than 3 months old. Supports and Resistances are determined by historic past peaks and Valley in the chart. Many other indicators and patterns like EMA, RSI, MACD, Volumes, Fibonacci, parallel channel etc. use historic data which is 3 months or older cyclical points. There is no guarantee they will work in future as markets are highly volatile and swings in prices are also due to macro and micro factors based on actions taken by the company as well as region and global events. Equity investment is subject to risks. I or my clients or family members might have positions in the stocks that we mention in our educational posts. We will not be responsible for any Profit or loss that may occur due to any financial decision taken based on any data provided in this message. Do consult your investment advisor before taking any financial decisions. Stop losses should be an important part of any investment in equity.
10 june Nifty50 brekout and Breakdown leval
🔼 Call Option (CE) Buy Levels:
Above 25,030 (Risky Zone)
"10m hold CE by RISKY ZONE"
Above 25,190 (Positive Trade View Zone)
Confirm bullishness and enter CE trades cautiously.
25,270"Above 10m hold CE by zone" – Strong confirmation.
25,390"Above 10m Closing Shot cover Possible" – Higher breakout level.
🔽 Put Option (PE) Buy Levels:
Below 25,030
"Below 10m hold PE by Zone"
Below 25,190
"Below nigetive trade view" – Sentiment turning bearish.
25,270 Below 10m PE by Risky Zone" – Confirmation of downward pressure.
Below 25,390 10m PE By Safe Zone" – Strong PE entry.
✅ Extra Key Zones:
Opening Support: 25,070
Opening Resistance: 25,030
CE Safe Zone: Above 24,970
Below 24,970: Possible unwinding (strong downside)

9 june Nifty50 brekout and Breakdown leval
🔵 Call (CE) Buy Levels:
24,768 – Above 10m hold CE by Risky Zone
25,122 –Above 10m hold CE Zone
25,290 – Above 10m hold CE by Zone
25,490 – Above 10m closing, short covering possible
🔴 Put (PE) Buy Levels:
25,290 – Below 10m PE by Risky Zone
25,490 – Below 10m PE by Safe Zone
24,768 – Below 10m hold PE by Zone
🟢 Other Key Zones:
24,530 – CE by Safe Zone
➤ Below this: Unwinding Possible
25,122 – Above: Positive Trade View
➤ Below: Negative Trade View

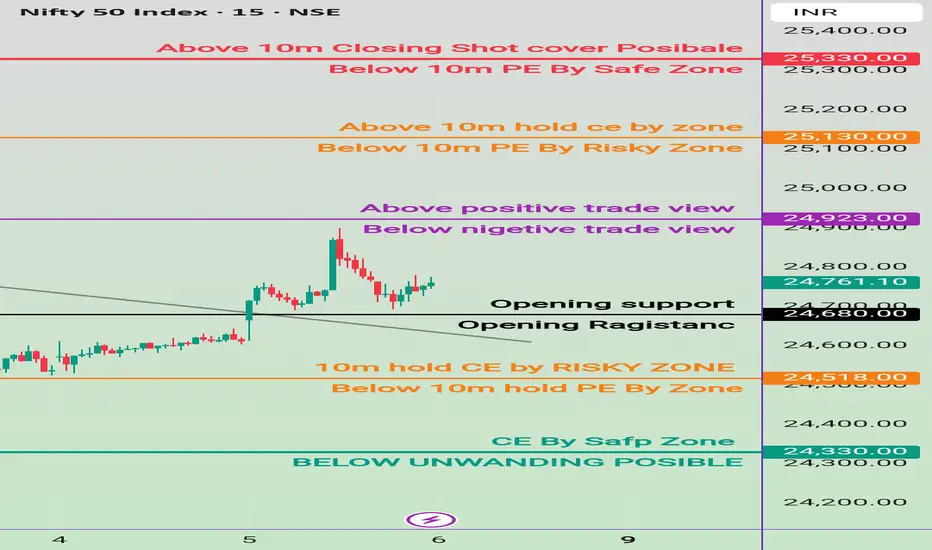
6 June Nifty breakout & breakdown levels
🔼 CALL (CE) Buy Levels :
24,680 (Opening Support Zone)
CE entry possible if price10m holds above this level.
24,923 (Above Positive Trade View)
Strong bullish sentiment above this zone.
Buy CE if 10-min candle holds above this level.
24518 (Above 10m hold ce by level) bullish momentum
🔽 PUT (PE) Buy Levels:
24,680 (Opening below Resistance Zone)
Below 24,518 (Below 10m Hold PE by Zone)
Below 25,130 (Below 10m PE by Risky Zone)
Risky but possible PE buy if fails to hold
Below 25,330 (Below 10m hold PE by Safe Zone)
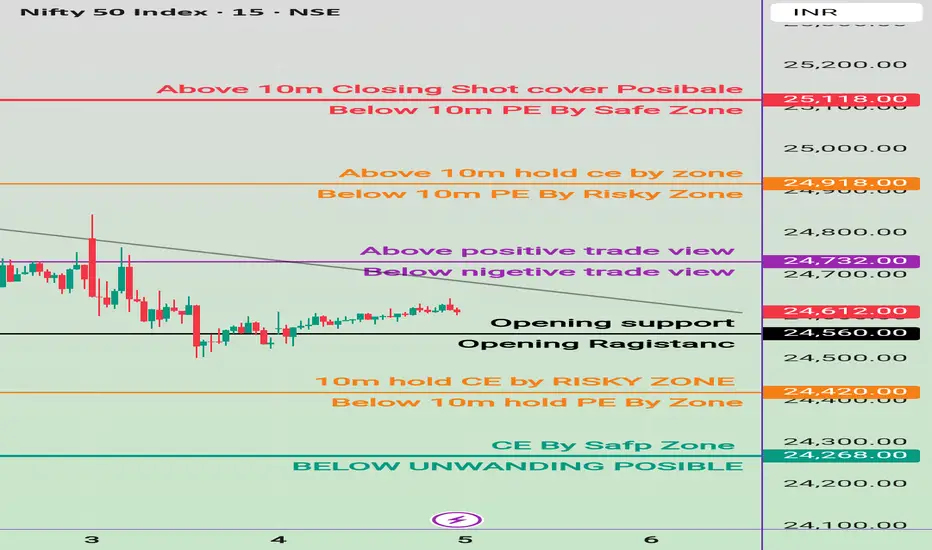
5 june Nifty50 brekout & break down level
🔼 Call Option (CE) Trade Levels:
25,118 – Above 10m Closing → Short covering possible (Bullish breakout zone)
24,918 – Above 10m Hold → CE by zone (Bullish confirmation zone)
24,437.70 – 10m Hold → CE by risky zone (Uncertain upside attempt)
24,268 – CE by safe zone (Good support; possible long build-up)
🔽 Put Option (PE) Trade Levels:
25,118 – Below 10m → PE by safe zone (Bearish rejection from breakout)
24,918 – Below 10m → PE by risky zone
24,420 – Below 10m Hold → PE by zone (Bearish confirmation)
Below 24,268 – Unwinding possible (Breakdown leval)
📊 Neutral / Trade View Levels:
24,732 – Above this → Positive trade view
24,700 zone – Below this → Negative trade view
24,570 –flat Opening support
24,570 –gap down Opening resistance zone
Nifty Analysis EOD – June 4, 2025 – Wednesday🟢 Nifty Analysis EOD – June 4, 2025 – Wednesday 🔴
A Pause with a Purpose: Calm Before the Storm?
Today’s Nifty price action was quiet and composed. The index opened with a mild 33-point gap-up, only to find resistance around the 24,600 mark—tested multiple times through the day. Eventually, it retraced to fill the gap, took support near the 24,500 zone, and spent most of the session within a tight initial balance of just 82 points.
A mid-session breakout attempt gave bulls a fleeting 30-point push, but the rally fizzled at the 24,625–24,640 resistance zone, and the index settled at 24,620.20, wrapping up the day in a 114-point range.
While the range was narrow, the price structure hints at a market in wait mode, possibly anticipating upcoming events or news flow. Patience is the key here.
🛡 5 Min Chart with Levels
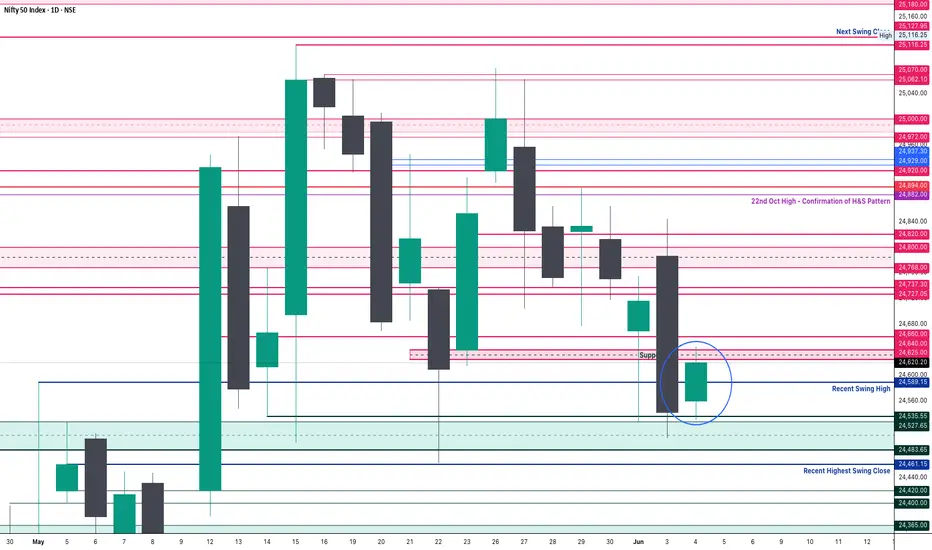
📦 Bigger Picture: Still Trapped in the Box
This was the 14th session and 20th trading day stuck in a 653-point box range (24,462–25,116) formed since the 15th May breakout candle.
Nifty is now near the bottom of that range, and the 15th May Master Candle low of 24,494 is becoming crucial.
🔴 A close below that level could potentially unlock lower zones near 24,000 or even 23,800.
No need to pre-empt the move—let the market trigger, then respond.
🕯 Daily Time Frame Chart
🕯 Daily Candle Breakdown
Open: 24,560.45
High: 24,644.25
Low: 24,530.45
Close: 24,620.20
Net Change: +77.70 (+0.32%)
Candle Structure
Real Body: 59.75 pts (Green)
Upper Wick: 24.05 pts
Lower Wick: 30.00 pts
Interpretation
A quiet session with modest gains. The candle shows buyers stepping in after yesterday's sell-off, but the recovery lacked strength. The small body and limited wicks signal a day of balance—neither bulls nor bears fully in control.
Candle Type
🟩 Neutral Bullish Candle / Basic Continuation Bar
Indicates pause in selling pressure, but not yet a confirmation of bullish reversal.
Key Insight
A close above 24,645 is needed to validate any recovery attempt.
As long as 24,530–24,500 holds, short-term sentiment stays cautiously optimistic.
Tomorrow’s session will be crucial to set the tone.
🛡 5 Min Intraday Chart
⚔️ Gladiator Strategy Update
ATR: 262.59
IB Range: 82.3 → Small IB
Market Structure: Balanced
Trades:
❌ No trade triggered today
📌 Support & Resistance Zones
Resistance Levels
24,625 ~ 24,640
24,660
24,727 ~ 24,737
24,768 ~ 24,800
24,820
24,882
24,894 (Strong Resistance)
Support Levels
24,600
24,530 ~ 24,480
24,460
24,420 ~ 24,400
24,365 ~ 24,330
24,245 ~ 24,240
💭 Final Thoughts:
A day of controlled consolidation in a narrow range. While the broader market may look indecisive, this could be accumulation or energy build-up for the next big directional move. Stay observant—levels are speaking louder than volume right now.
📌 "When markets whisper, smart traders listen. The quiet days often precede the loudest moves."
✏️ Disclaimer
This is just my personal viewpoint. Always consult your financial advisor before taking any action.
4 June Nifty50 best trading zone#Nifty50 #option trading
🚀 If you like my trading plan and levels, don't forget to boost the post
99% working trading plan
👉Gap up open 24640 above & 15m hold after positive trade target 24840, 25033
👉Gap up open 24640 below 15m not break upside after nigetive trade target 24390 , 24220
👉Gap down open 24390 above 15m hold after positive trade target 24640
👉Gap down open 24390 below 15m not break upside after nigetive trade target 24220, 24090
📌 Trade plan for education purpose I'm not responsible your trade
More education follow social media and boost my idea
📌 koi bhi trade leval se 20 point ke sl ke bhina karan nahi hi
📌 koi trade app activate tabhi karana hota hi level pe 2 candle uper ya niche closing aati hai to
📌 leval par Ane pe turant trade plan na kare ...
📌 Full risk apaki hi hi meri nahi

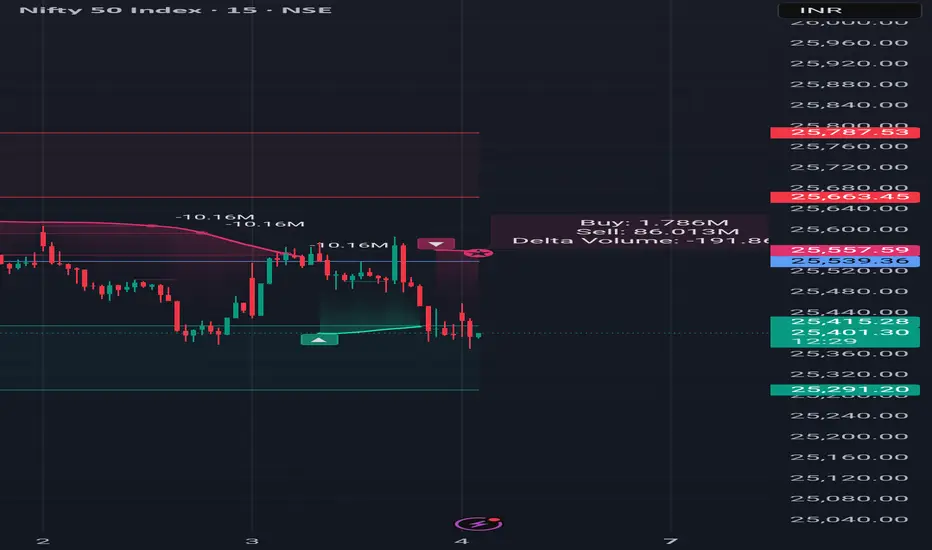
My Recent Trade In Nifty 50 ... On 1 hour time frame nifty is coming to get liquidity on FVG drew here.. after it may go to 25,000. let's see what happens...