Nikkei225trade

US30/Nikkei225 - (Continuation) SHORT; SELL it until ...... it can be shorted no more!!
Here is the original post;
Been making stupid amounts of money in this spread, ever since!3
Obviously, this still has quite a few country miles left in it (SHORT). - Then, on the top of it, factor in the currency differential and Baam! ... Probably the best (passive) index trade out there, bar none.

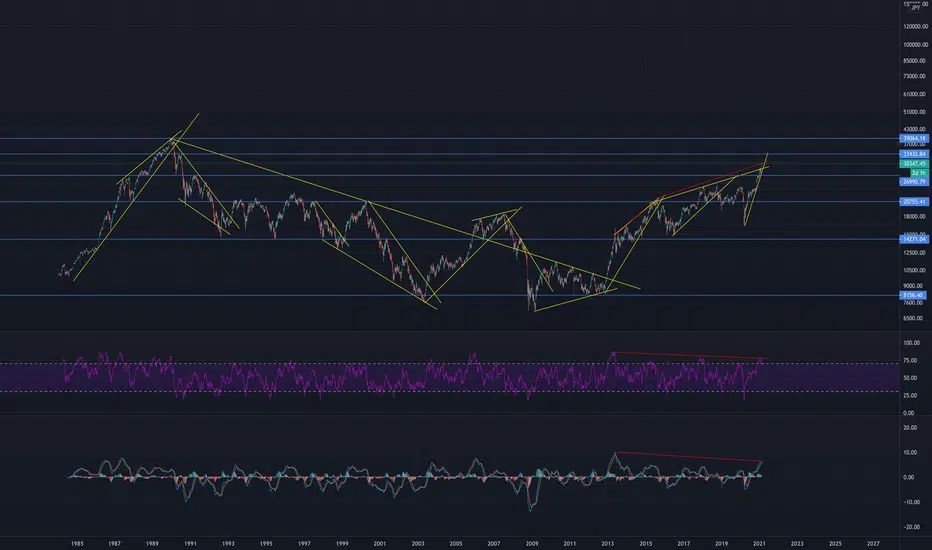
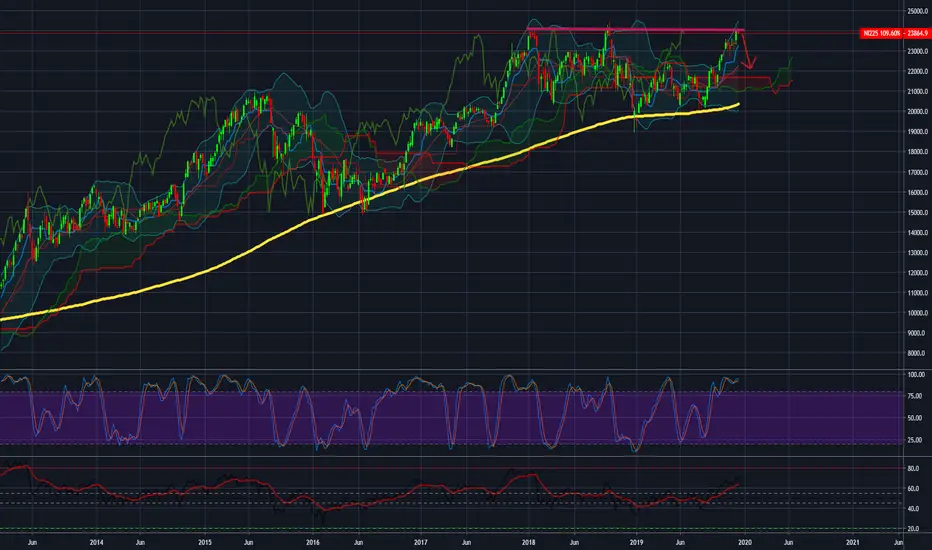
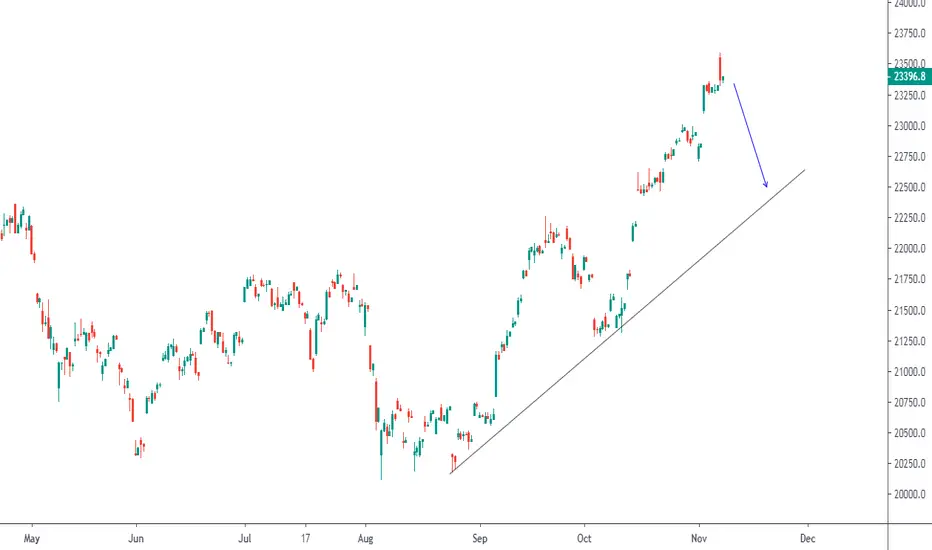
Negative divergent keep extending on Nikkei 225 weekly chartAs Nikkei 225 keep pushing higher, it continues to extend negative divergent. Given the size of divergent, it projects pretty large drop in Nikkei. Break of current steep rising trend line should do the trick.
Have a good trade everyone,
T.
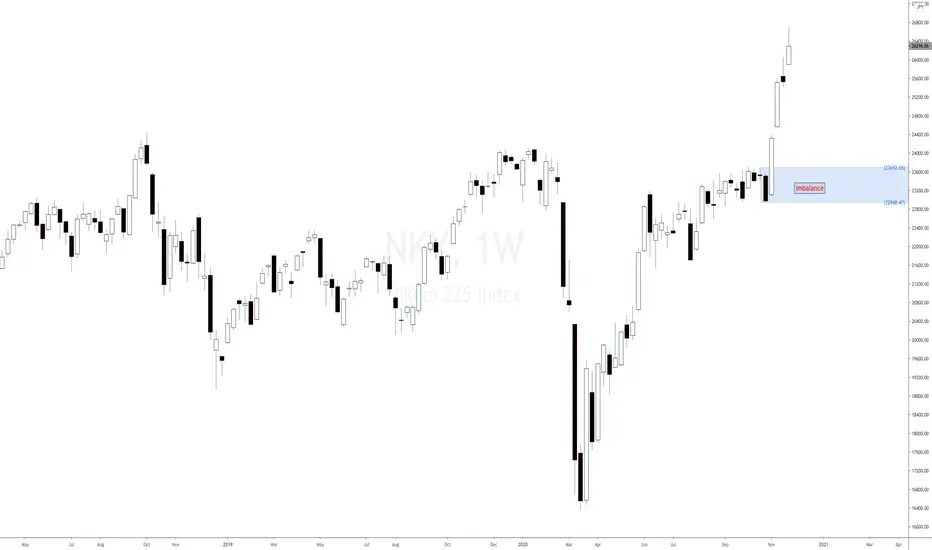
Nikkei Index futures forecast 2020Nikkei Index futures are moving higher breaking price levels from September 2018. As expected and mentioned in previous Nikkei 225 index analysis, a new strong bullish impulse has been created around 23,572 price level. The strength of that movement has turned that bullish impulse into a strong demand imbalance for the Japanese index. The timeframe attached corresponds to the weekly timeframe. That means that every candlestick represents a week of time. For many of you intraday and shorter stock traders, that will be like a lot of time. Unfortunately, time flies and a few weeks of time can pass in the blink of an eye.
There is definitely a bullish bias on the Japanese Nikkei 225 index for the year 2020 and 2021. A lot of things have to happen for the index to reverse and give us a bearish bias. As supply and demand traders, we do not need to take into consideration any type of fundamental analysis for the Japanese index, price action and the strength of the imbalances is what matters the most.
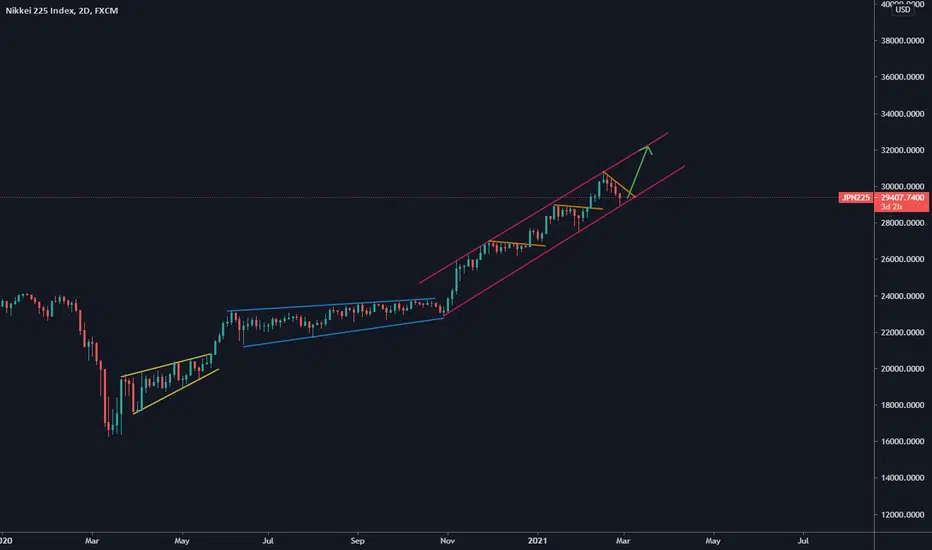
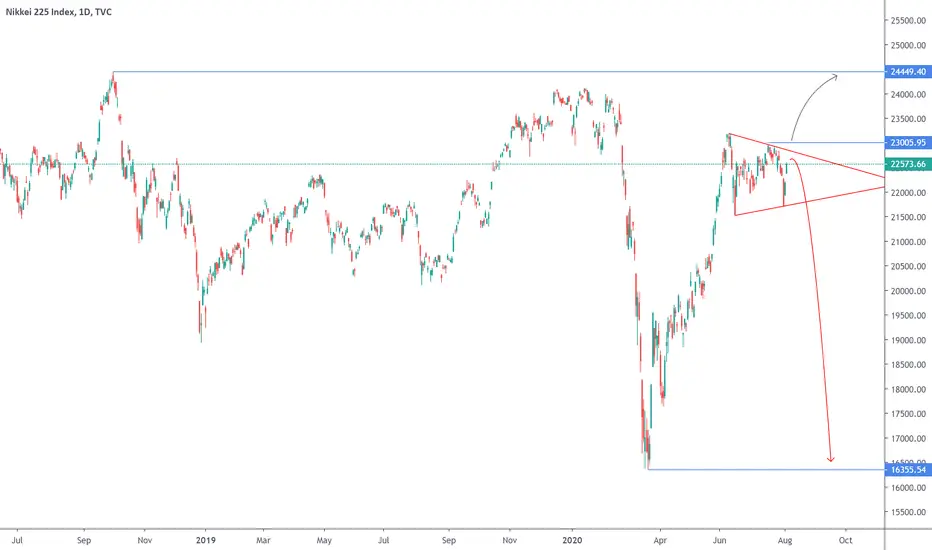
Nikkei 225 - Will the market Fade to a consistent level?➖⚡➖ KEY TAKEAWAYS ➖⚡➖
✔️ Strong rally only natural to retrace
➖⚡➖ TECHNICAL ANALYSIS ➖⚡➖
Bullish Outlook:
A break above the most recent level of ascending resistance (in yellow) would expose further upside
Bearish Outlook:
I think it's only natural to see some profit taking on a strong bullish rally. Question is though, how much of a retracement should we expect? Well historically speaking, the 50% fib level is the most common level.
Regards,
Michael Harding 😎 Chief Technical Strategist @ LEFTURN Inc.
RISK DISCLAIMER
Information and opinions contained with this post are for educational purposes and do not constitute trading recommendations. Trading Forex on margin carries a high level of risk and may not be suitable for all investors. Before deciding to invest in Forex you should consider your knowledge, investment objectives, and your risk appetite. Only trade/invest with funds you can afford to lose.

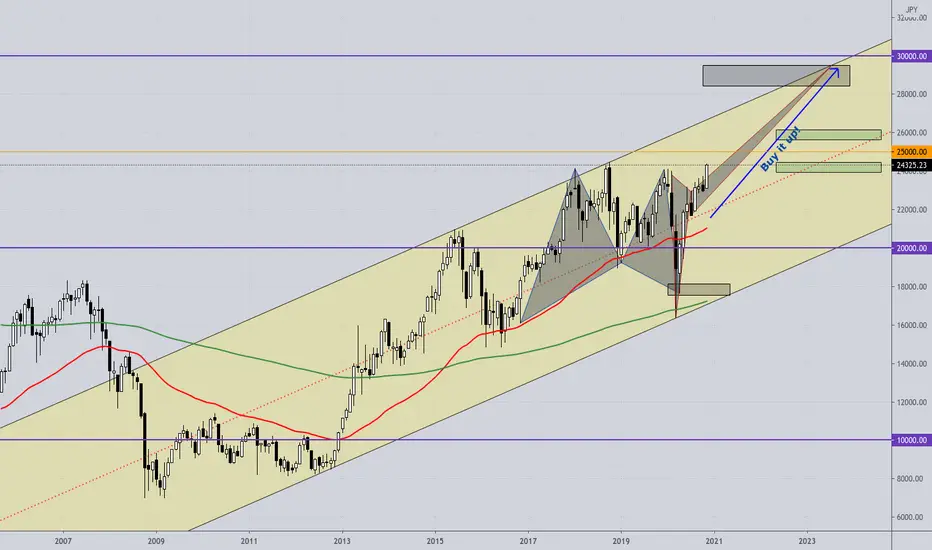
NIKKEI225 LONG; Best of the G10, long term.Currently the best outlook of the developed markets.
- As opposed to the DAX and US Equities, the former being an absolute dog, the later under a mass delusion price wise.
The DAX
E.g. If one must be long Equities, the proper spread would be LONG NIKKEI, CAC, SHORT Dow, DAX.
This spread has an annual 8%-10% advantage, including FX differentials, over any other G10 Equity Long!
Nikkei 225 (NKY NI225 JPN225) - Breakdown - Now at Demand ZoneTVC:NI225 has broken down from the uptrend, however now in demand zone.

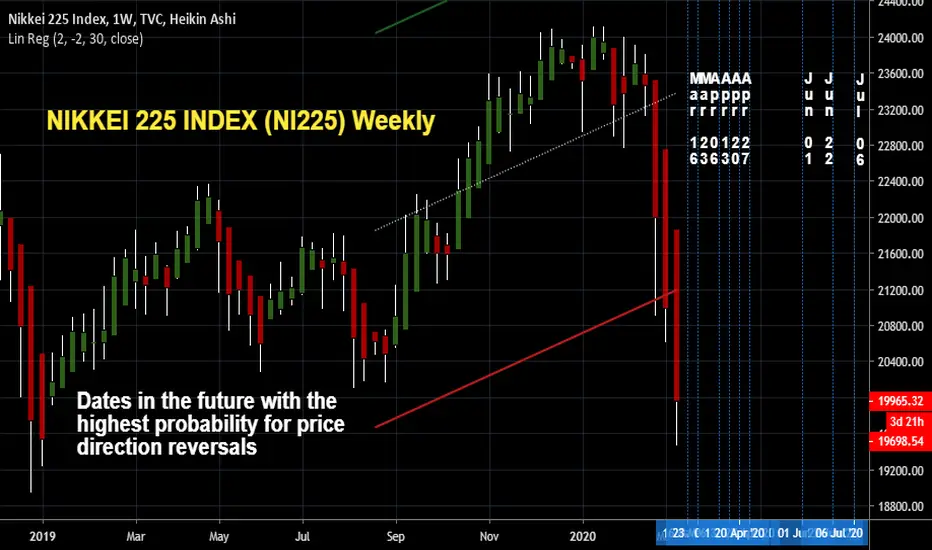
NIKKEI 225 INDEX (NI225) WeeklyDates in the future with the highest probability for price direction reversals
NIKKEI bounced from support, potential for a further rise!
NIKKEI bounced off 23645.0 where it could potentially rise further to 24540.0.
Trading CFDs on margin carries high risk.
Losses can exceed the initial investment so please ensure you fully
understand the risks.

Nikkei bounced from support, potential for a further rise!
Nikkei bounced off 23660.0 where it could potentially rise further to 24540.0.
Trading CFDs on margin carries high risk.
Losses can exceed the initial investment so please ensure you fully
understand the risks.

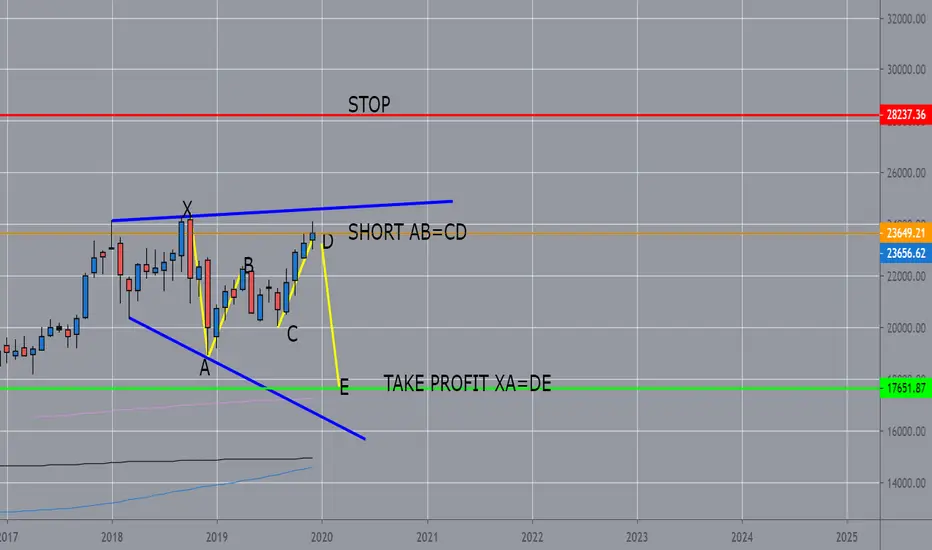
NIKKEI225 SHORT MONTHLY CHART GARTLEY PATTERN OF AB=CDNIKKEI225 can easy go down now to end the Gartley pattern and test the blue Trendline and the SMA200 there.
Nikkei 225 bounced from support, potential for a further rise!
Nikkei 225 bounced off 23645.0 where it could potentially rise further to 24540.0.
Trading CFDs on margin carries high risk.
Losses can exceed the initial investment so please ensure you fully
understand the risks.

#NIK225,Signal with huge potentialPerfect resistance line, the NIK225 has already been stopped twice in the above resistance line and it seems that this time it will also fail to break.
The Stochastic in Overbought, and has the same model as it had in the previous 2 times.
The trend is an uptrend but following the data we mentioned above, we recommend sell
Target: 22000
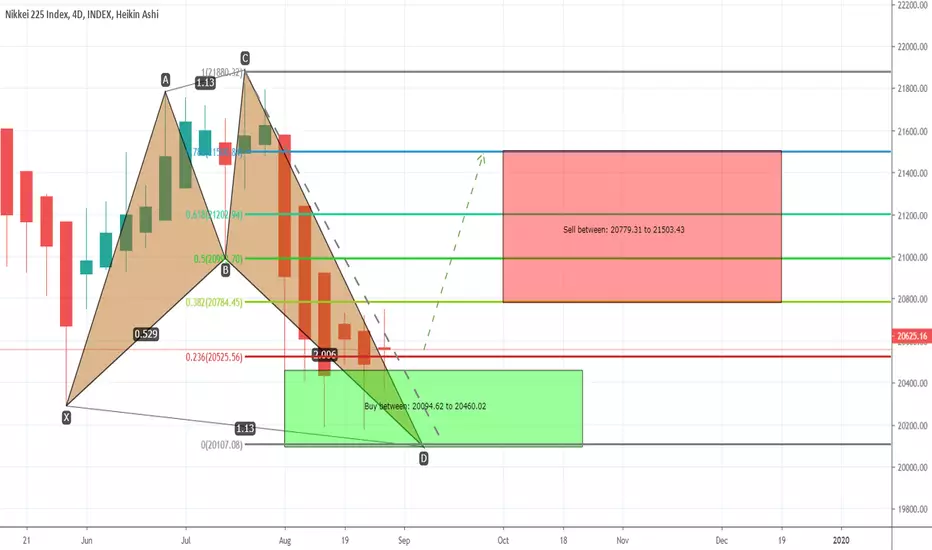
Nikkei 225 index formed bullish Shark | A good long opportunityPriceline of Nikkei 225 index has formed a bullish shark and entered in potential reversal zone.
I have defined the targets using Fibonacci sequence as below:
Buy between: 20094.62 to 20460.02
Sell between: 20779.31 to 21503.43
Regards,
Atif Akbar (moon333)
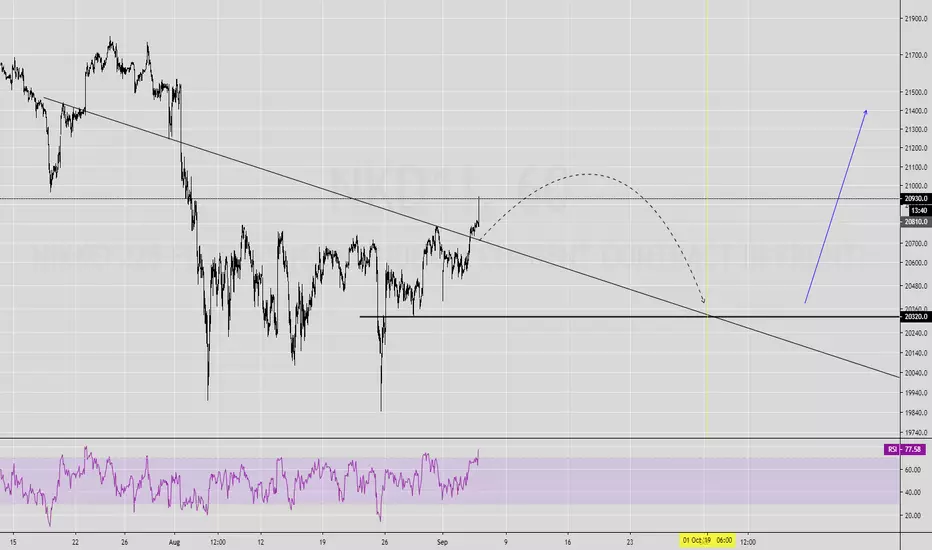
Nikkei225 price action setuoLooking forward for further upside & correction PA, by 1st half of October '19.
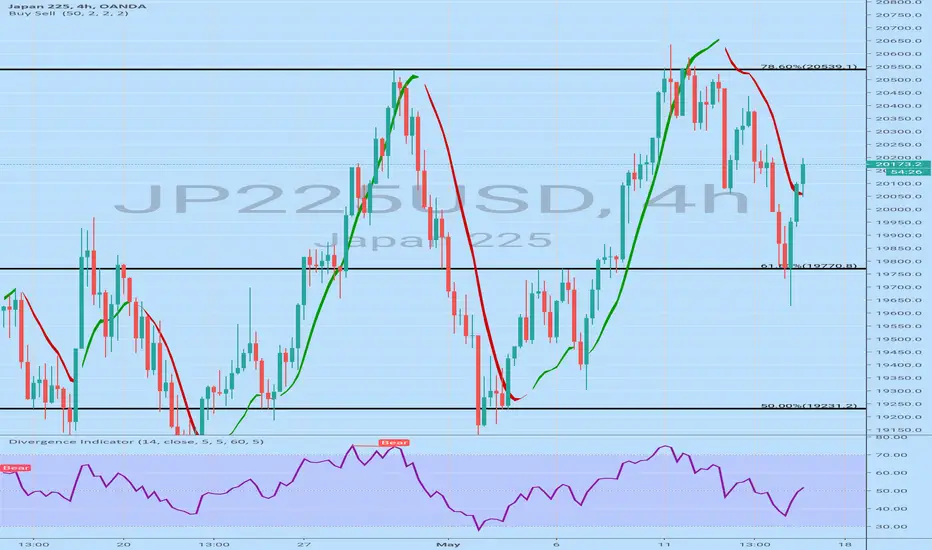
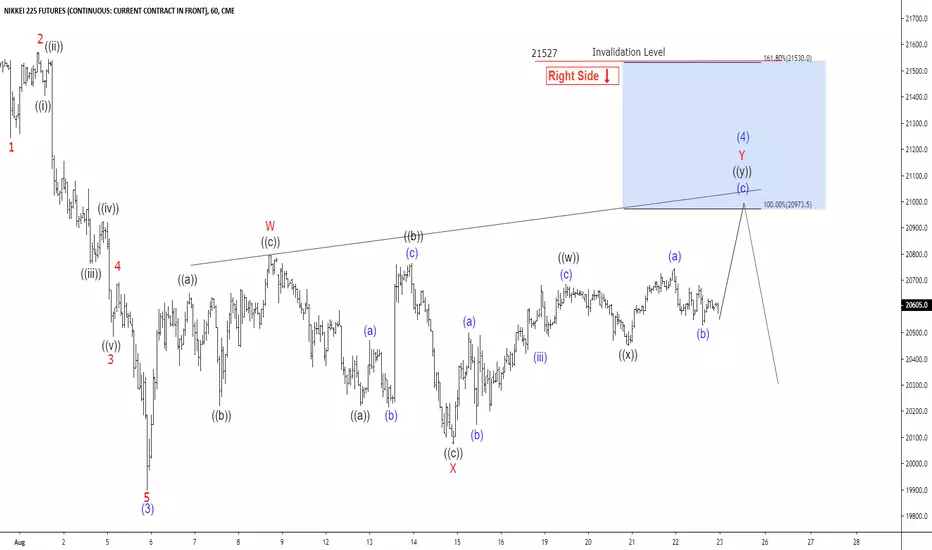
Elliott Wave View: Nikkei Looking for More DownsideShort Term Elliott Wave View in Nikkei suggests the decline to 19900 on August 6 ended wave (3). The Index is currently in wave (4) bounce and the internal subdivision is unfolding as a double three Elliott Wave structure. Up from 19900, wave W ended at 20795 as a zigzag. Wave ((a)) of W ended at 20650 and wave ((b)) of W ended at 20220. Then the move higher to 20795 completed wave ((c)) of W.
The Index then pullback to 20075 which ended wave X with internal subdivision as a zigzag. Wave ((a)) of X ended at 20300, wave ((b)) of X ended at 20765, and wave ((c)) of X ended at 20075. Wave Y is in progress with the internal subdivision of a double three in lesser degree. Up from 20075, wave ((w)) ended at 20685 and wave ((x)) ended at 20450. Near term, while above 20075, Index has scope to extend higher towards 20974 – 21530 area to end wave Y of (4). Expect sellers to appear from the above area and Index to either resume lower or pullback in 3 waves at least. We don’t like buying the Index.
Head/Shoulders at $JPN225 $NIKKEI open tonightIn pre-market we are backtesting the neckline. Get ready for some follow through after today's rebound.
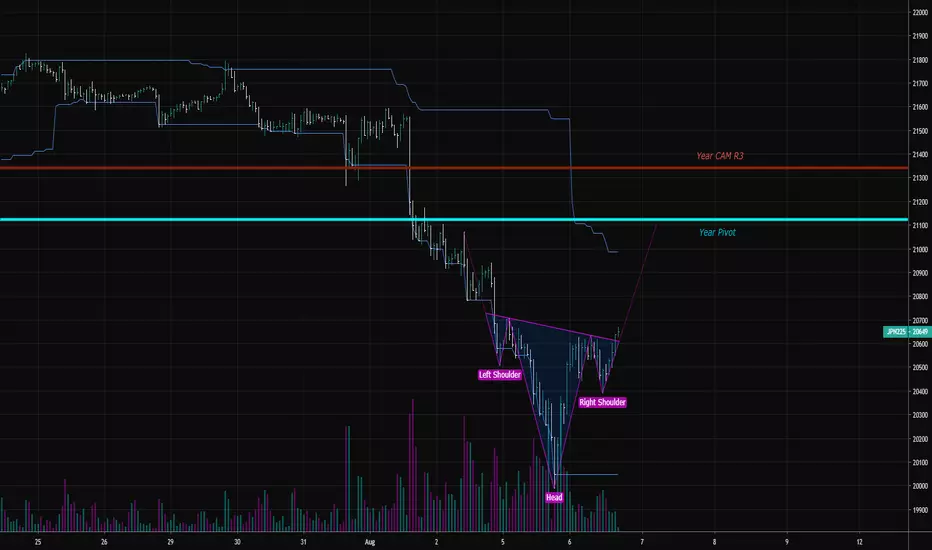
Hit volume support Price hit kumo cloud on 4 hrs and also volume (AD) support. We should see a bounce to the next swing high.
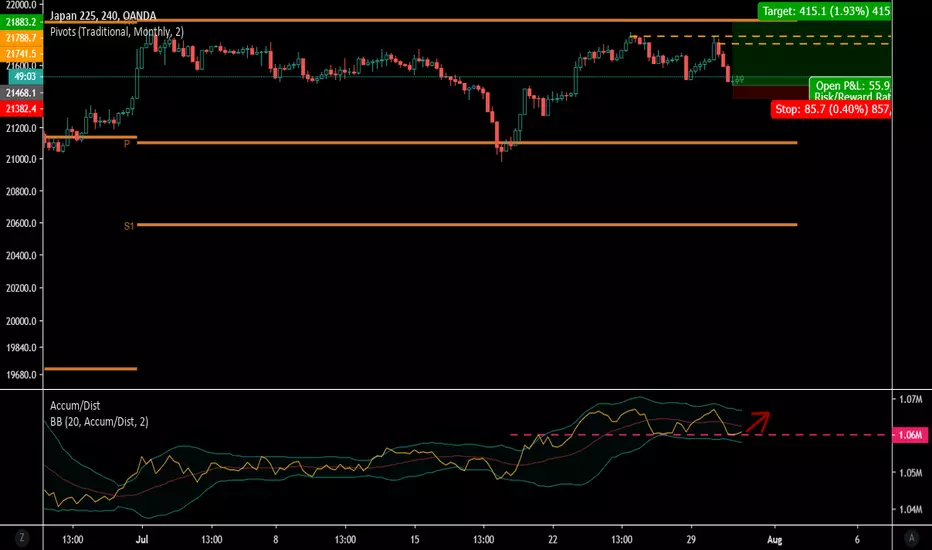
Global Financial Engineering Swing Trading Strategy for Nikkei We have decided to take a bullish trade at 21309 with a Global Stop Loss(GSL) at 21100 and a Global Profit Target at 22498
The Primary Trend (PT) given by the Monthly TIME BAR (MTB) is currently Bearish
The Secondary Trend (ST), given by the Weekly TIME BAR (WTB) is currently Bullish
The Medium Term Trend (MTT), given by the Daily TIME BAR (DTB) is currently Bullish
The Short Term Trend (STT), given by the Four Hour TIME BAR (FHTB) is currently Bullish
This is a high risk trade since the Primary and Secondary Trend are still bearish. We are taking this trade in the direction of the Medium Term Trend which is given by the Global Daily Time Bars(GDTB).
In light of the above trend analysis we will start a bullish trade using Global Trading Strategy #4 on the Global Automated Trading System #4 which trade in the direction of the Global Daily TIME BARS (GDTB).
Global Entry Signal: Buy @21309
Global Stop Loss: 21100
Global Target Profit: 22498
Global Trade Management Strategy: We will applied the Global Trailing Stop System for Global Trading Strategy #4
--------------------------
The analysis in this material is provided for information only and is not and should not be construed as an offer to sell or the solicitation of an offer to buy any security.
To the extent that this material discusses general market activity, industry or sector trends or other broad-based economic or political conditions, it should not be construed as research or investment advice.
To the extent that it includes references to specific securities, commodities, currencies, or other instruments, those references do not constitute a recommendation by Global Financial Engineering,Inc. to buy, sell or hold such investments.
This material does not and is not intended to take into account the particular financial conditions, investment objectives or requirements of individual customers.
Before acting on this material, you should consider whether it is suitable for your particular circumstances and, as necessary, seek professional advice.
