Elliott Wave View: Impulsive Decline in NikkeiOur Elliott Wave view on Nikkei suggests the rally to May 4, 2019 high (22505) ended wave w. This ended cycle from December 26, 2018 low and the Index is in the process of at least doing a larger 3 waves pullback. Short Term, decline in Nikkei from May 4, 2019 high is unfolding as an Elliott Wave impulse structure. Down from 22505, wave 1 ended at 21935 and wave 2 ended at 22245. Wave 3 ended at 21080 low.
Expect wave 4 bounce to fail in 3, 7, or 11 swing as far as wave 2 pivot at 22245 stays intact. Possible target for wave 4 is 23.6 – 38.2 retracement of wave 3 at 21539 – 21672. Alternatively, Index can end the entire 5 waves from May 4, 2019 high already. In this case, it should do a larger 3 waves bounce to correct the cycle from May 4 high before the decline resumes. We don’t like buying the Index and expect further downside in the Index to complete a 5 waves down.
Nikkei225trade

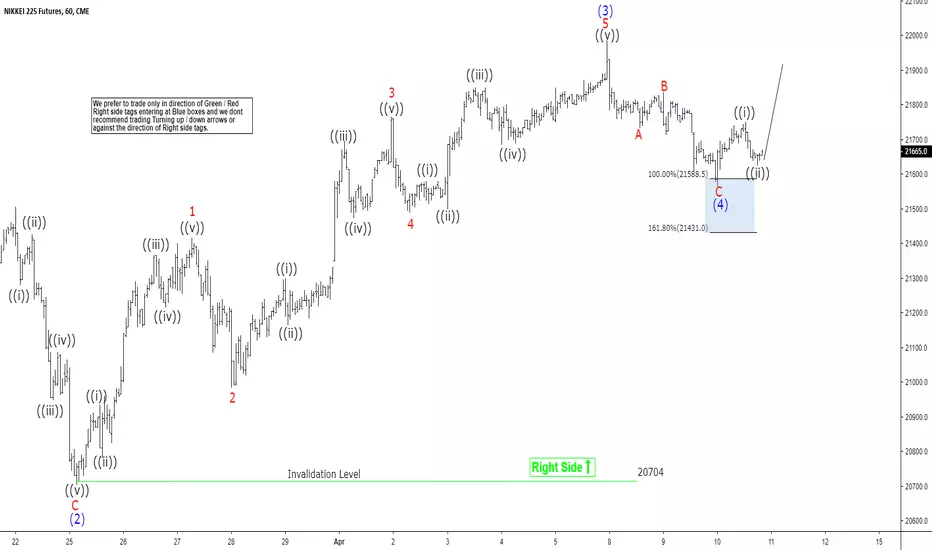
Elliott Wave View: Nikkei Still Missing Wave 5Short Term Elliott Wave view on Nikkei Futures suggests the pullback to 20704 ended wave (2). The Index then resumed higher in wave (3) which ended at 21985. The internal of wave (3) subdivided as an impulse Elliott Wave structure. Up from 20704, wave 1 ended at 21415, wave 2 ended at 20985, wave 3 ended at 21765, wave 4 ended at 21490, and wave 5 of (3) ended at 21985. We can also see the internal of wave 1, 3, and 5 all subdivide as an impulse (5 waves) of lesser degree. This is an illustration of fractal within Elliott Wave where each wave consists of smaller waves and the pattern repeats indefinitely.
Wave (4) dips appears complete after a 3 waves pullback ended at 21588+ blue box area. The internal of wave (4) unfolded as a zigzag Elliott Wave structure where wave A ended at 21735, wave B ended at 21835, and wave C ended at 21565. At this stage, Nikkei still needs to break above wave (3) at 21985 to avoid a double correction in wave (4). While dips continue to stay above wave (2) low at 20704, expect Index to extend higher in wave (5). If bounce from the blue box fails to break above (3) high and it breaks the recent low, then structure of wave (4) should become a double three Elliott Wave structure and would be labelled as WXY. We would be able to define the next blue box area for a bounce if the bounce does fail and breaks the recent low.
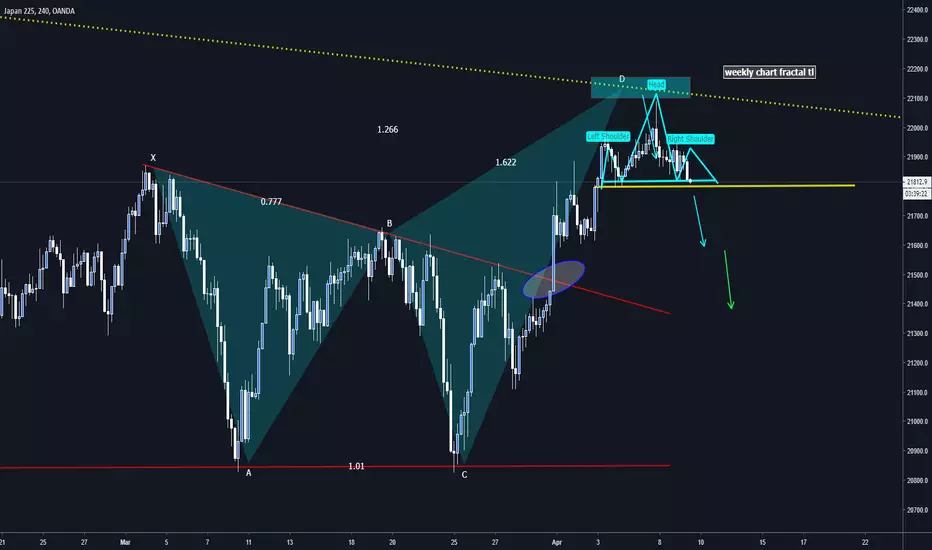
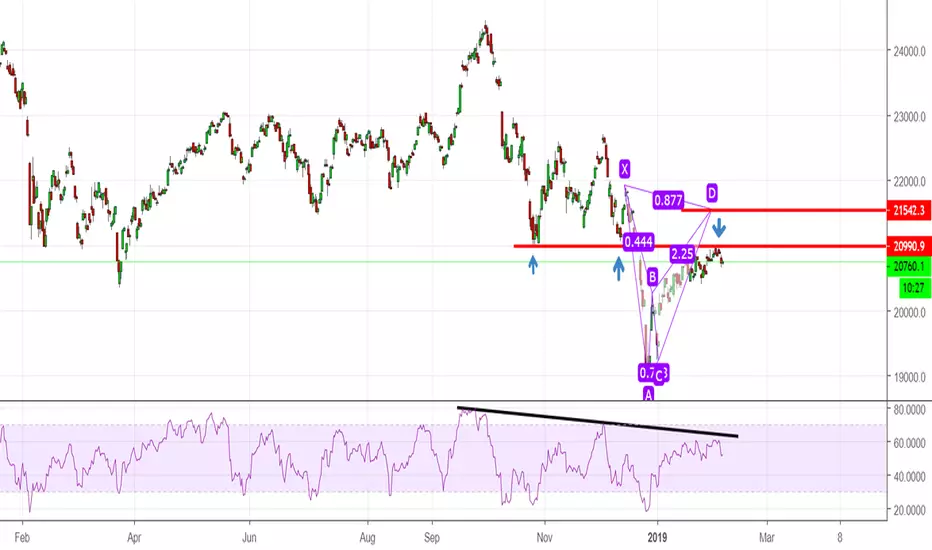
Nikkei Index Update: Head And Shoulders PatternButterfly worked as predicted.
Wait for the breakout of the neckline of SHS at 21.800 to add short
Not a Fan of that Resistance or PerformanceWhile there is much room to go before we hit resistance, I am really not a huge fan of this overall lackluster performance. Keep in mind, the BoJ owns upwards of 80 percent of the entire Japanese ETF market. 80 percent. Let that sink in. Also, export data is weak in an economy where exports make up 18 percent of GDP. If we gain five percent from today, nobody will be happier than me as my overall macro view will gladly change. I can sleep at night being wrong on five percent. But really though what could possibly lead to that given the last three months where some Asian markets like the Shanghai Composite would gain 5 percent in a single day while Japan is asleep? Just not convinced. More fundy and technical analysis on Asian markets as they move today here: anthonylaurence.wordpress.com

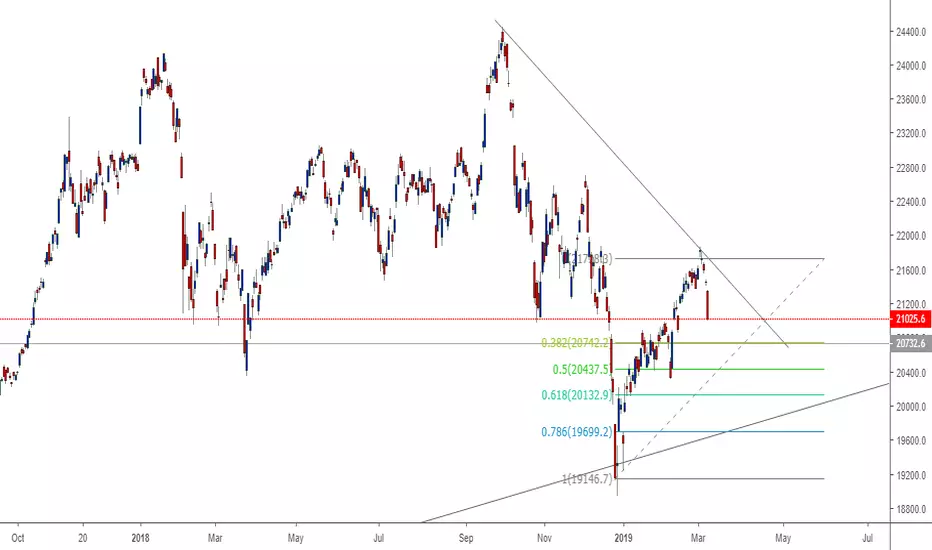
Nikkei225 (NI225) LONGI am expecting price to rebound from the bearish streak at the 20742.2 price level, which also represents a fibonacci zone. However, it should be noted that the price is creating somewhat a triangle pattern and it is thus wise to watch out for further downside movement below the 20742.2 price level as prices might be heading to retest the upward trendline from the monthly timeframe. Either way, i will only wait for long trades one this one
Long Term Trend for Nikkei on Weekly ChartSELL When:
- Touches the RED Line with RSI reaches 70
- Bearish RSI Divergence occurs
BUY When:
- Touches the GREEN Line with RSI reaches 35
- Bullish RSI Divergence occurs

Nikkei 225 approaching resistance, potential drop!Nikkei 225 is approaching our first resistance at 21868.6(horizontal swing high resistance, 100% Fibonacci extension, 78.6%Fibonacci retracement) where a strong drop might occur below this level pushing price down to our major support at 21159.1(23.6% Fibonacci retracement , Horizontal swing low support)
Stochastic (89,5,3) is also approaching resistance where we might see a corresponding drop in price.
Trading CFDs on margin carries high risk. Losses can exceed the initial investment so please ensure you fully understand the risks.

Nikkei Moving in Downtrend I think Nikkei will move in a downtrend next days and I have many reason for this claim
it's at a resistance zone . Broken support transform to resistance
it's near PRZ of the Bat pattern
The RSI indicator is moving in downtrend and touched the trend line.
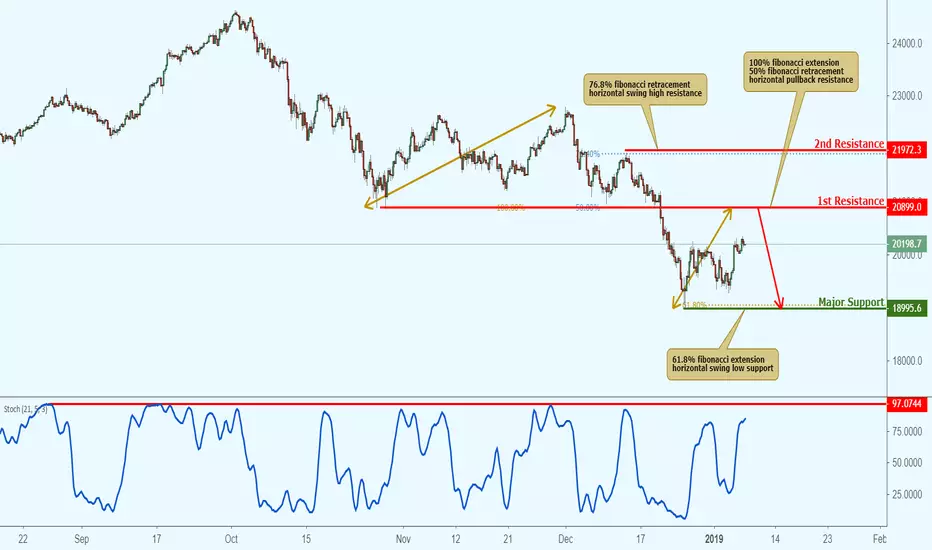
NIKKEI approaching resistance, potential drop! Nikkei is approaching our first resistance at 20899 (100% fibonacci extension, 50% fibonacci retracement, horizontal pullback resistance) and a strong drop might occur below this level pushing price down to our major support at 18995 (61.8% fibonacci extension, horizontal swing low support).
Stochastic (21,5,3) is also approaching resistance and we might see a corresponding drop in price should it react off this level.
Trading CFDs on margin carries high risk.
Losses can exceed the initial investment so please ensure you fully understand the risks
NIKKEI 225: Not Yet The Bottom?Find Winning Trades In Seconds >> efcindicator.com (Special Discount)
The end of subwave 5 should lead us to visit 18000 levels before a rebound.

NIKKEI (JPN225): WXY CORRECTION ENDED - BEARISHNIKKEI (JPN225): WXY CORRECTION ENDED - BEARISH
This is for my trade journal only, feel free to comment.

NI225 SHORT idea Hi huys and Merry Christmas. I post my recent for short possitions at Nikkei 225 with target 18025 ! Which is a high profit move or a trade if you got the whole picture of global markets and not for intraday investing. As we see ADX and Vortex Index signs 2 very solid sell signals through crossovers between the negative variables and positive variables. Invest with wisdom guys and be carefull !

Strength on Nikkei225Very highly possible trade towards 22300 and 22600. However wait for a retrace back to 22000-21800 for a low risk entry. Stop Loss should be place around 21400.
Happy Monday everyone!
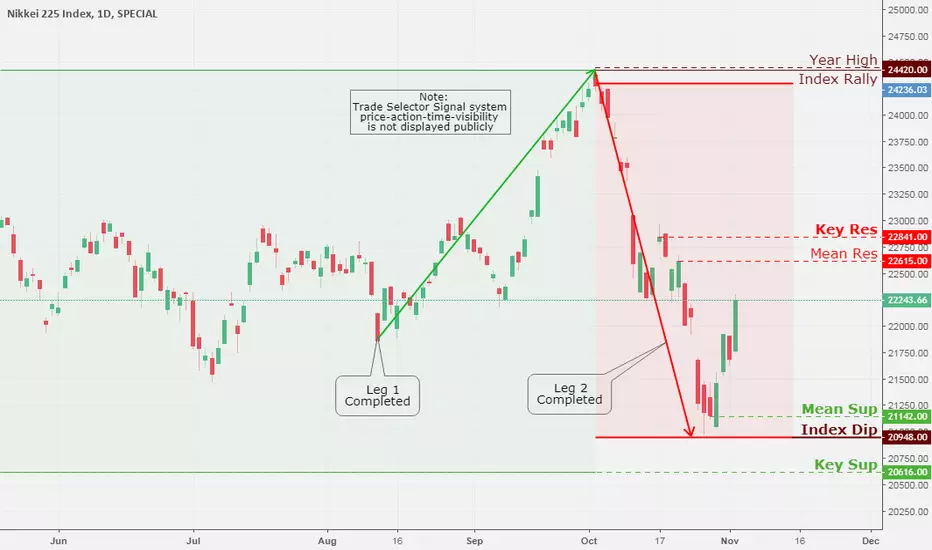
NIKKEI 225 Index, Daily Chart Analysis 11/3Technical Analysis and Outlook
With the Index Dip 20948 completion, we have two critical, pivotal points at stake: Key Resistance 22841 on the upside and Mean Support 21142 on the downside.
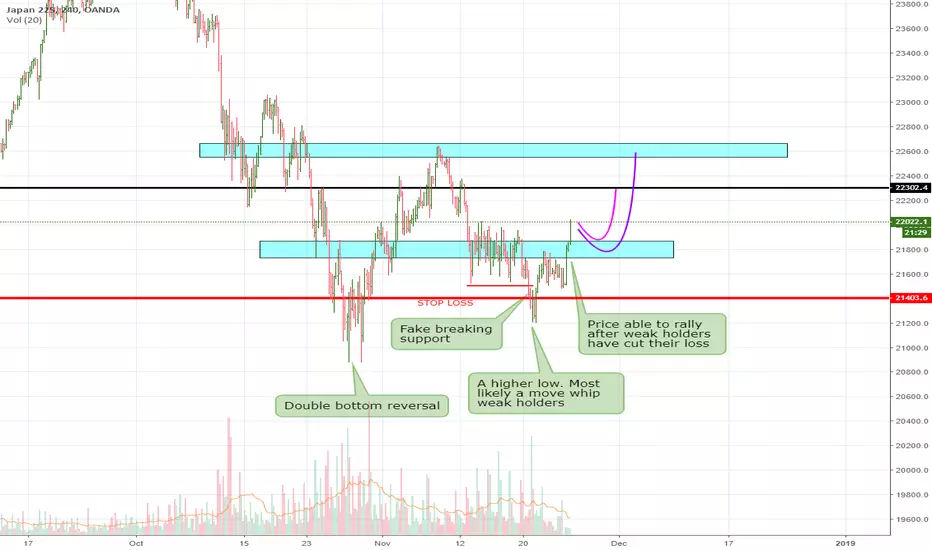
Possible upside for NikkeiDouble bottom is seen. Once the resistance at 21550 is broken, a recovery towards 22050 and 22400 is high possible. However, this is still a counter trend trade, thus take profits once the target are hit. Have a good week everyone.

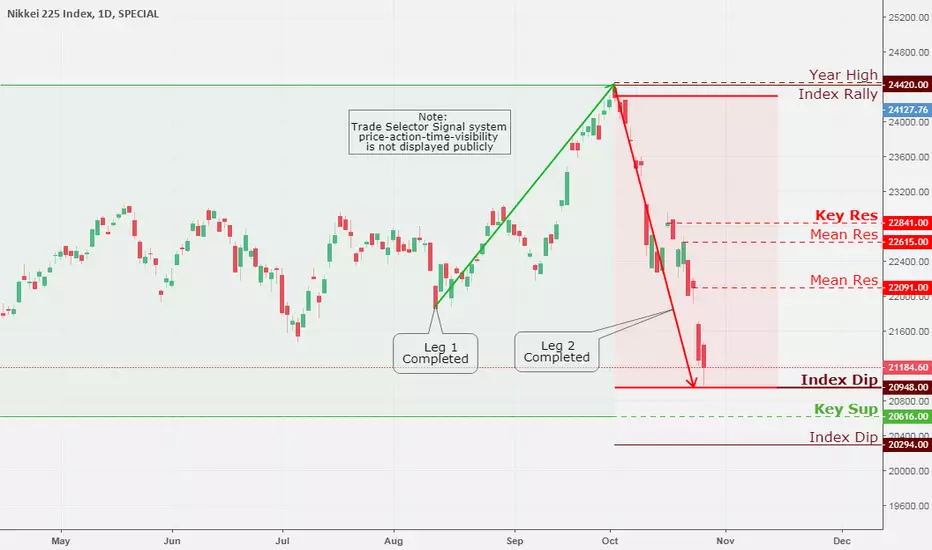
NIKKEI 225 Index, Daily Chart Analysis 10/28Technical Analysis and Outlook
The Nikkei Index finished lower bouncing off by completing Index Dip 20948 . The next stage for transforming from the bearish down move is Dead-Cat-Bounce to Mean Resistance 22091 . The confirmation of Index Rally 20948 is a must before the bounce must be taken seriously; otherwise, the index is heading lower to Key Support 20616 and next Index Dip 20294 .
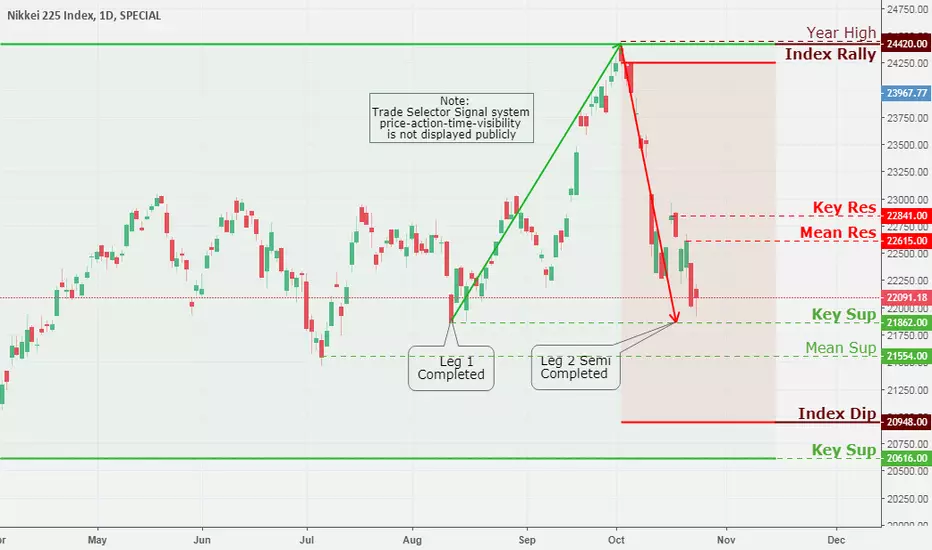
NIKKEI 225 Index, Daily Chart Analysis 10/24Technical Analysis and Outlook
The Nikkei Index finished small higher bouncing off the Key Support 21862 zone. The next stage for transforming from the bearish down move is Dead-Cat-Bounce to Mean Resistance 22615 . The retesting and reconfirming Key Support 21862 is a must before the bounce must be taken seriously, otherwise, the index is heading lower to Mean Support 21554 .
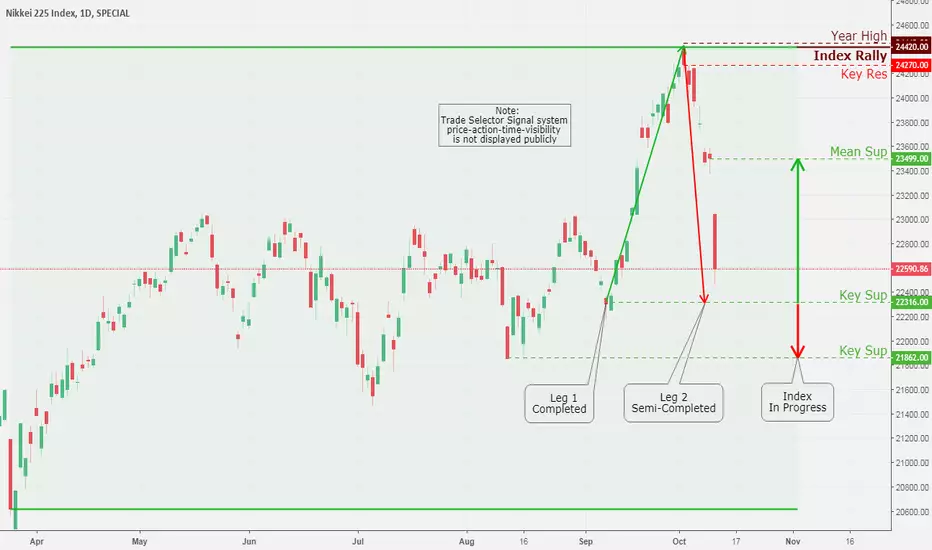
NIKKEI 225 Index, Daily Chart Analysis 10/11Technical Analysis and Outlook
Japanese stocks concluded trading session positive on Oct 10, with the Yen currency holding onto the previous day's advance; however, it was only once the wall street opened did the fun begin for the trading day. Today Oct 11 Nikkei Index did react with a negative bias as one were to expect by plunging 315 points or (-3.89%).
The Index did peel-off from its Index Rally 24420 completion, All-Time High 24448 printed on Oct 2, and Key Resistance 24270 .
Currently, we see Leg 2 approaching primary Key Support 22316 , while the market may very well proceed all the way down to secondary Key Support 21862 .
The Key Support 22316 level may hold at this level: however, the dive towards secondary Key Support 21862 or thereabouts in the interim is not to be taken lightly.
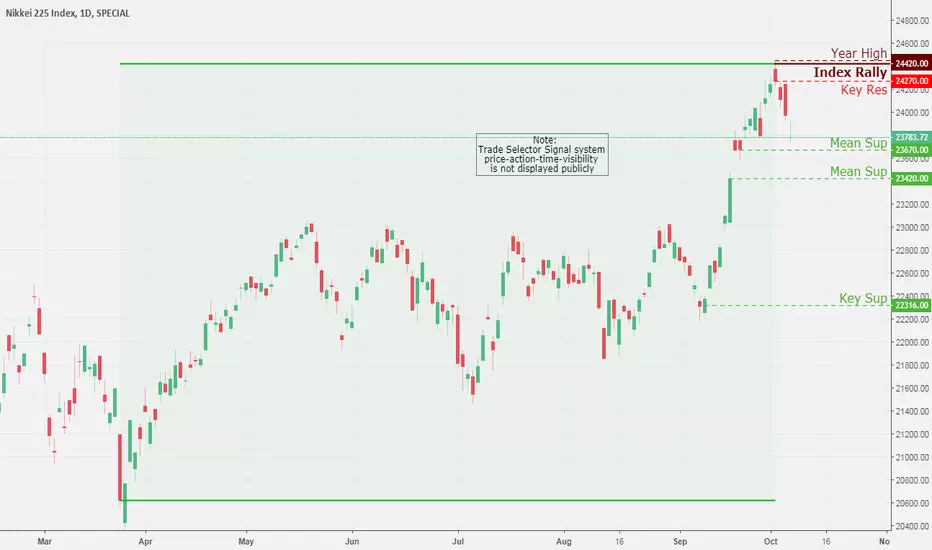
NIKKEI 225 Index, Daily Chart Analysis 10/5Implications and Outlook
The Japan Nikkei225 retreated from the more recent highs when it comes to cash terms but late in Thursday session held on to somewhat better than Asian counterparts, by slipping just minus 0.56%.
The index with further long-term bullish momentum has completed Index Rally 24420 and created Mean Resistance at 24270 . For the last three days, Index is heading downwards to find Mean Support 23670 and 23420 respectively.
Nikkei Elliott Wave Right Side Calling HigherHello Traders,
Nikkei short-term Elliott wave view suggests that the decline to 22161 on 9/06/2018 low ended red wave 2. Above from there, red wave 3 remain in progress, nesting higher in an impulse structure. With lesser degree cycles showing sub-division of 5 waves structure in each leg higher i.e black wave ((i)), ((iii)) & ((v)) expected to unfold in 5 waves structure. Also, it’s important to note that the right side is up & instrument is having a bullish sequence tag available in below chart. This suggests that the selling is not recommended.
Up from 22161 low, the initial rally to 22750 high black wave ((i)) in 5 waves. The decline to 22535 low ended black wave ((ii)) pullback.
Then the rally higher from there ended black wave ((iii)) at 24120 high. The pullback to 23817 low ended black wave ((iv)). Above from there black wave ((v)) of 3 remain in progress, looking to extend higher as long as the pivot at 23817 stays intact.
Afterwards, the index is expected to do a wave 4 pullback in 3, 7 or 11 swings before further upside is seen. We don’t like selling it & expect buyers to appear in 3, 7 or 11 swings against 23817 low.

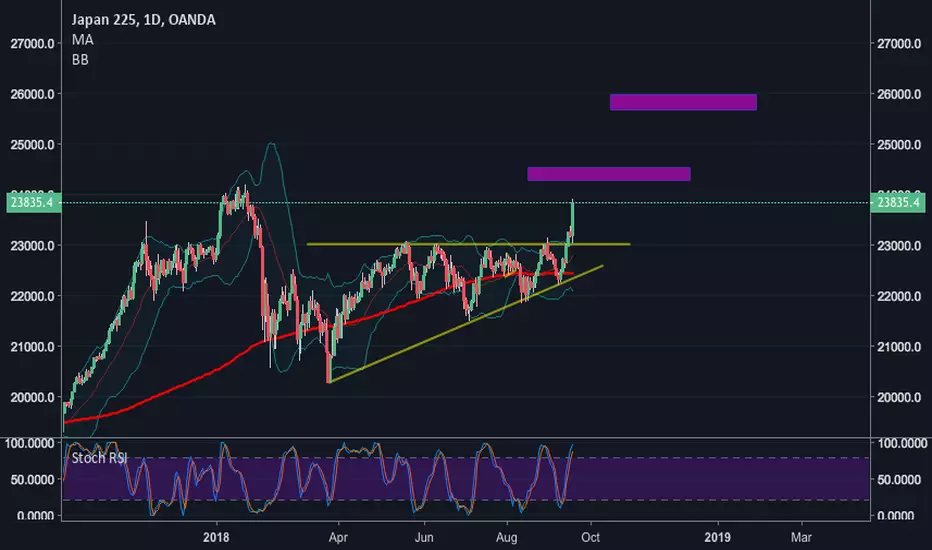
NIKKEI BREAKOUTThe Nikkei has broken out of its multi-month ascending triangle. If resistance at 24.2 zone can be overcome, targets are 24.4 area and 25.8 area.
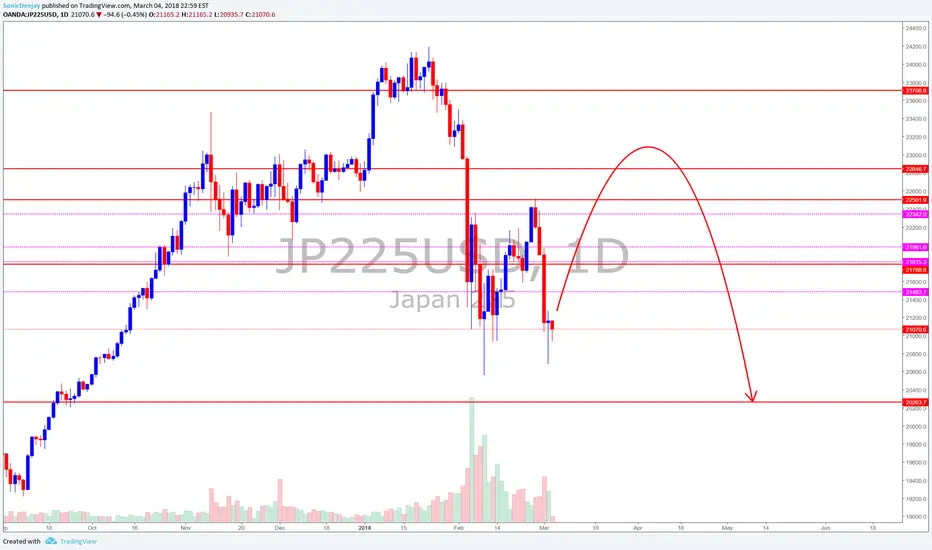
Nikkei (Japan Stock Index) *So, now you know it is BearishIt is true that xxxjpy pairs should be a long-term down-trend and so is Nikkei.
Now. I am seeing a potential oversold situation, as a lot of noobs has jumped in the sell wagon and it 'may be' time for a swing up to hunt their stop.
So, if you are looking into short. Stay light.
I expect it shall back go down sooner or later. Stay Alert guys.
Trade Safe
s0nic
Disclaimer:
The information contained in this presentation is solely for educational purposes and does not constitute investment advice. We may or We may not take the trade.
The risk of trading in securities markets can be substantial. You should carefully consider if engaging in such activity is suitable to your own financial situation.
We,Sonicr Mastery dot com is not responsible for any liabilities arising from the result of your market involvement or individual trade activities.