Nikkei 225 Index Rises Towards the 42,000 LevelNikkei 225 Index Rises Towards the 42,000 Level
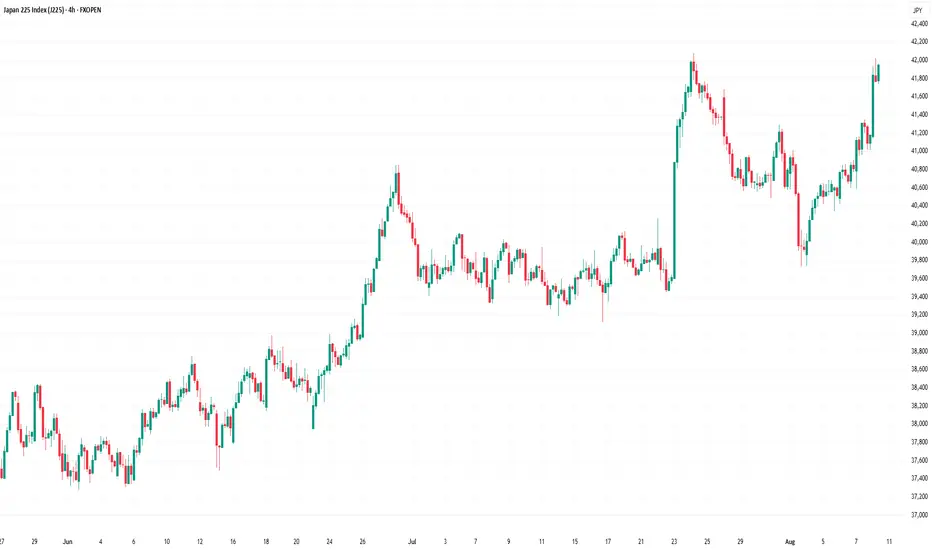
As the chart indicates, the Nikkei 225 stock index has today risen to the 42,000 mark, which is just below its all-time high.
Among the bullish drivers:
→ Corporate news. Strong quarterly results were reported by Sony Group and SoftBank.
→ Trade agreement developments. Positive news flow surrounds a potential tariff agreement between the United States and Japan, which could be finalised in the near term. According to Reuters, the Japanese government stated on Thursday that the US has pledged to adjust overlapping tariffs on Japanese goods to avoid double taxation.
Technical Analysis of the Nikkei 225 Chart
Previously, we highlighted the ascending channel that has shaped price action throughout 2025. This pattern remains valid, with the price now entering the upper half of the channel. The channel’s median line might act as a support level going forward.
The recent price behaviour attracts attention: a long bullish candle has formed on the chart – immediately following a breakout above the 41,280 resistance level (as indicated by the arrow). This signals a clear imbalance in favour of buyers.
From a bearish perspective:
→ The psychological resistance at 42,000 may hold – in late July, the price failed to stay above this level.
→ The RSI indicator has entered overbought territory.
→ Failure by the bulls to sustain a break above 42,000 could validate a potential Double Top bearish pattern.
From a bullish perspective:
→ The price might advance towards the upper boundary of the ascending channel.
→ The bullish candle displays characteristics of an FVG (Fair Value Gap) bullish pattern, which might serve as a future support level.
→ Further support could be provided by the orange trendline, as well as the former resistance at 41,280.
A bullish breakout attempt above 42,000 cannot be ruled out. However, will market optimism persist if the price approaches the upper limit of the channel?
This article represents the opinion of the Companies operating under the FXOpen brand only. It is not to be construed as an offer, solicitation, or recommendation with respect to products and services provided by the Companies operating under the FXOpen brand, nor is it to be considered financial advice.
Nikkeianalysis
JPN225 (The Nikkei) slowly being squeezed to the upsideTake a look at the daily chart - the flat top and an upward sloping trendline. You would agree that for the past 4 months, a slow squeeze to the upside has been happening. Price is now also above the 200dma and this gives me a bullish bias. Ideally, price being contained in the upper part of the triangle would be another factor of confluence. Another one or two bounces off the trendline will add more confirmation. The situation will become clearer in the next few days and continued build up to the bullish side will motivate me to go long with 42,400 as target.
This is not a trade recommendation, merely my own analysis. Trading carries a high level of risk, so only trade with money you can afford to lose and carefully manage your capital and risk.
If you like my idea, please give a “boost” and follow me to get even more. Please comment and share your thoughts too!!
It’s not whether you are right or wrong, but how much money you make when you are right and how much you lose when you are wrong – George Soros
