NILUSDT Forming Potential BullishNILUSDT is currently forming an interesting technical setup on the daily chart, hinting at a potential bullish move in the near term. The price structure recently broke out from a consolidation phase and tested the previous support-turned-resistance zone, which is now acting as a key demand area. The market has shown some short-term correction but is likely preparing for a bounce from this level, targeting a potential gain of 40% to 50%.
The projected move is supported by a healthy uptick in volume, suggesting accumulation and growing investor interest. With price action forming a potential higher low near the support zone, this area could become a strong launchpad for the next leg up. The market sentiment for NILUSDT seems to be shifting toward the bullish side, which aligns with the setup shown on the chart.
Technically, if buyers regain control and push the price above the recent local high, we may see rapid movement toward the target zone marked around a 52% gain from current levels. This makes NILUSDT a favorable candidate for short to mid-term traders looking to capitalize on breakout continuation setups.
Overall, NILUSDT appears to be at a crucial technical junction. The current zone could offer a good risk-to-reward entry opportunity for trend-following traders watching for bullish confirmations.
✅ Show your support by hitting the like button and
✅ Leaving a comment below! (What is You opinion about this Coin)
Your feedback and engagement keep me inspired to share more insightful market analysis with you!
Nilbtc

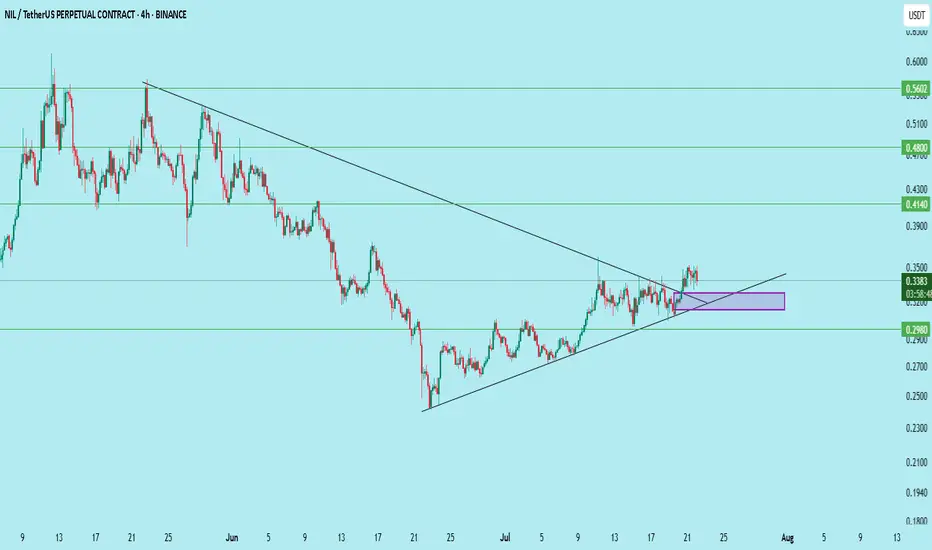
$NIL/USDT – Bullish Breakout Retest Setup (4H Timeframe)NIL has successfully broken its descending trendline and is now retesting the confluence zone of:
– Breakout support
– Ascending wedge
– Demand zone (rectangle)
Entry: 0.312–0.325
Stop Loss: Below 0.2971
Targets:
• 0.414 (+25%)
• 0.480 (+44%)
• 0.560 (+68%)
This is a textbook breakout–retest–continue pattern.
Spot buyers can scale in around the purple box.
Close below 0.2971 invalidates the setup.
DYOR. Not financial advice.
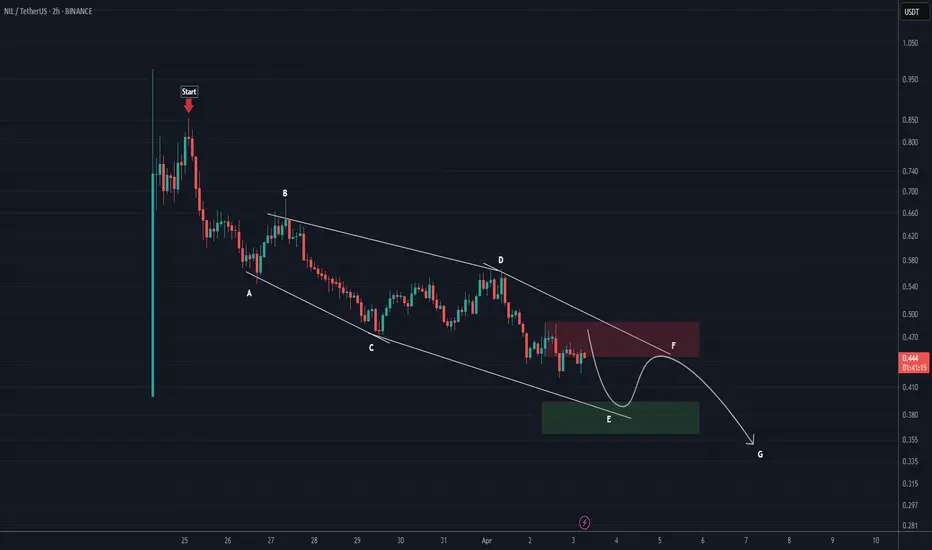
NIL ANALYSIS (4H)The NIL correction started from the point we marked as Start on the chart.
This correction appears to be a Diametric, and it seems we are currently in wave E of this pattern. The price is expected to follow the path indicated by the arrow.
A daily candle close above the invalidation level will invalidate this analysis.
invalidation level: 0.521$
For risk management, please don't forget stop loss and capital management
When we reach the first target, save some profit and then change the stop to entry
Comment if you have any questions
Thank You