NMDC – Bullish Trend Reversal with Breakout Setup📈 NMDC – Bullish Trend Reversal with Breakout Setup (For Study Purpose Only)
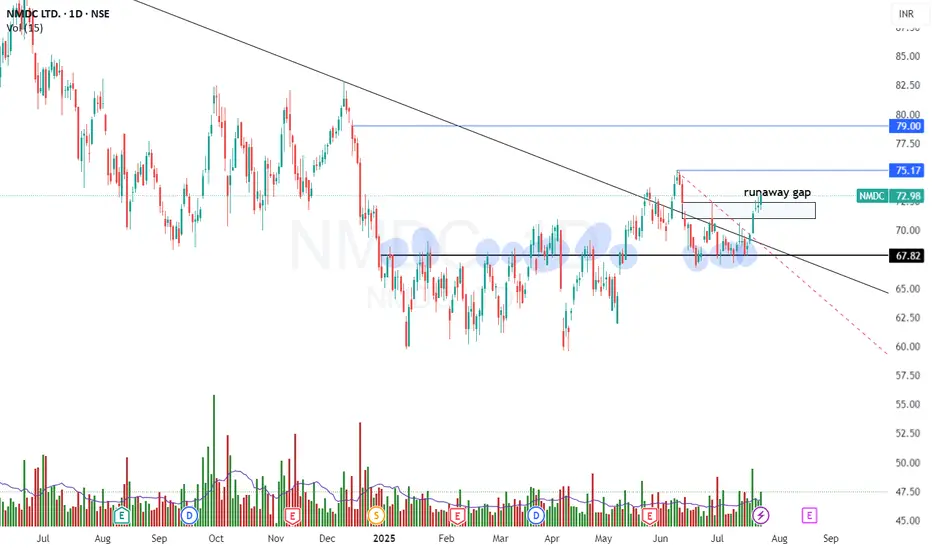
NMDC has displayed a bullish trend reversal following a prolonged 6-month consolidation between ₹60–68. The stock broke out decisively above this range and has since retested the breakout zone successfully, confirming it as a strong support.
Subsequently, the stock entered a 1-month sideways consolidation between ₹67–73, forming a tight base—typically a sign of strength and potential continuation.
🔍 Technical Highlights:
✅ Breakout Zone: ₹68 (now acting as strong support)
🔁 Retest Completed: Post-breakout pullback respected support
🧱 Current Range: ₹70–73 (tight consolidation near highs)
📊 Volume: Gradual increase near resistance, indicating accumulation
📈 RSI & MACD: RSI climbing steadily; MACD shows bullish crossover
🎯 Trade Setup (for study purpose only):
Watch for strength above: ₹73
Stop-Loss (SL): ₹69
Targets: ₹75 (initial), ₹80–82 (extended)
📌 Note:
This analysis is intended for educational and study purposes only. Always conduct your own due diligence or consult a certified financial advisor before making any investment decisions.
Nmdcview
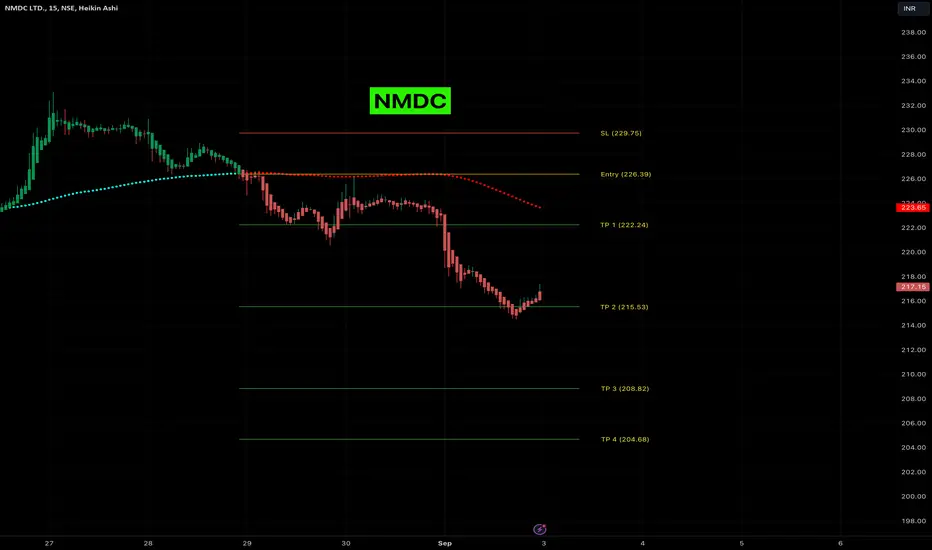
NMDC SHORT Trade Setup and levelsNMDC SHORT Trade Setup and levels
Got a clear short entry on 28 August
Entry: 226
Stoploss: 230
Target 1: 222 (DONE)
Target 2: 215 (DONE)
Target 3: 208
Target 4: 204
Current Trailing Stop loss: 224
Hope this helps.
Support my work by following my profile for more such actionable charts.
Buy NMDC 258 tgt 404/905 avg@ 202/160 Sl below 140 The stock came out of a decade long consolidation making rounding bottom and is visible for food upside in near medium term. It is on fresh breakout before loksabha elections marking its move for fresh lifetime high.

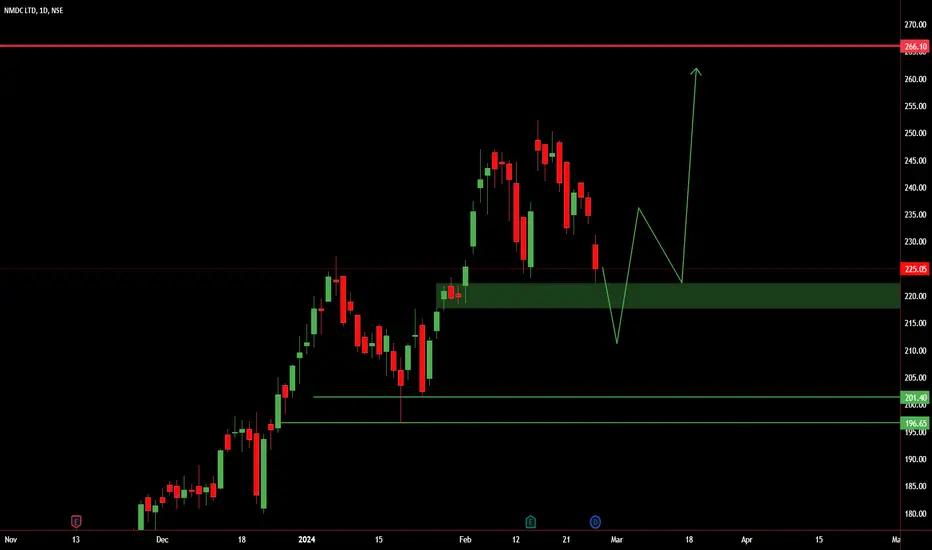
NMDC--Long View??this stock is now its near to the support zone,
previously a strong move is identified from this zone of support.
if price breaks the demand then also keep in long side, we have a strong resistance at 265,price is likely to this resistance before fallback.