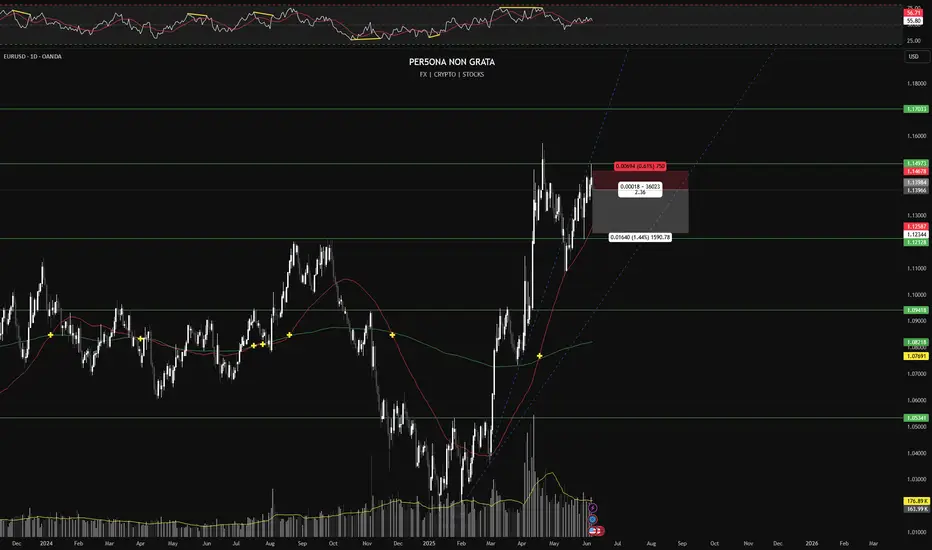
LONG | EUR/USD | 1DCurrent Level: ~1.1662
Revised Entry Zone: 🔄 Buy the dip around 1.1660–1.1670
This aligns with 50-day EMA and daily/4H pivot (~1.1630–1.1670) acting as support.
Stop Loss: 1.1630 (just below 50 EMA & recent low)
Target: 1.1750 → 1.1800 (range high/resistance)
Risk:Reward: ~1:3.8
✅ Institutional Rationale:
Momentum remains bullish, though momentum indicators are cooling—price retesting structural support (mid-BB, pivot zone).
Weekly outlook still favors bulls while above 1.1637–1.1670—suggesting accumulated buy orders in this zone.
Event risk: U.S. employment and Fed speakers imminent—creates ideal buy-on-dip opportunities with tight stops.
Nongrata
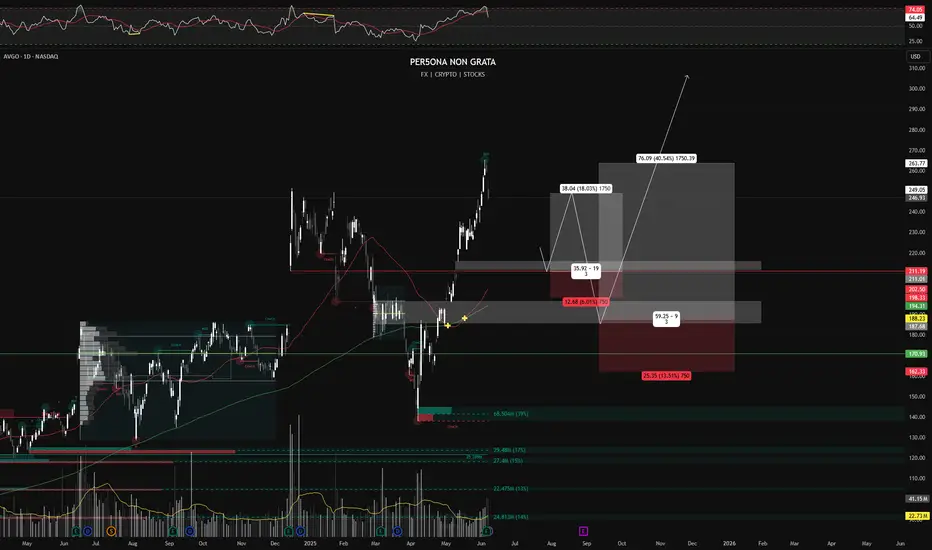
LONG | AVGO (Broadcom) | 1DScenario 1 – Pullback to Structure Zone
Entry: $211.01
Stop Loss: $198.33
Target: $259.05
Risk:Reward: ~1:3
Structure: Pullback to key fib level (~38.2%) and prior breakout base.
Market Logic: Reclaiming structure post pullback; trend resumption with minimal drawdown.
Scenario 2 – Deep Demand Zone
Entry: $187.68
Stop Loss: $162.10
Target: $263.77
Risk:Reward: ~1:3
Structure: 61.8% fib + institutional demand cluster; "if market breaks deep", re-entry possible here.
Market Logic: Value-buy zone; often unfilled unless broad market correction. Ideal for swing/position trader allocations.
_______________________________
Business Model & Sector Positioning
Core Focus: Broadcom designs and develops semiconductors and infrastructure software solutions. Their chips power AI data centers, 5G infrastructure and cloud networking—key growth pillars.
AI Exposure: AVGO provides custom silicon to hyperscalers like Google and Meta. Its next-gen networking and AI accelerator chips are integral to expanding AI workloads, which fuels earnings upside.
Earnings & Financial Momentum
Recent Results (Q2 FY25):
Revenue up ~43% YoY, beating consensus.
EPS surged ~50% YoY, driven by data center demand.
AI-related revenues now make up nearly 25% of total sales.
Guidance Raised: Management upgraded full-year revenue targets—signaling internal confidence.
Analyst Consensus & Institutional Flow
Buy Ratings: >85% of analysts rate AVGO a Buy.
Price Targets: Median PTs have moved from $260 to $285 post-earnings.
Ownership: High institutional interest—Vanguard, BlackRock and State Street are among top holders.
Dividends: Pays a sustainable dividend (~1.8% yield), increasing yearly—strong signal of financial health.
Macro Environment
Interest Rate Outlook: With the Fed expected to cut by late 2025, tech stocks are well-positioned. Lower yields boost growth stock valuations like AVGO.
Capex Trends: Global cloud providers are increasing AI data center spending—Broadcom is a primary beneficiary.
___________________________
Conclusion
Why The Setups Work Fundamentally:
$211.01 Entry: Technical pullback + fundamental tailwind from raised guidance.
$187.68 Entry: Deep value zone backed by secular demand + institutional conviction in AI.
Both zones represent opportunistic entries into one of the most fundamentally sound AI infrastructure plays, with upside tied to macro tech trends, strong earnings, and durable cash flow.
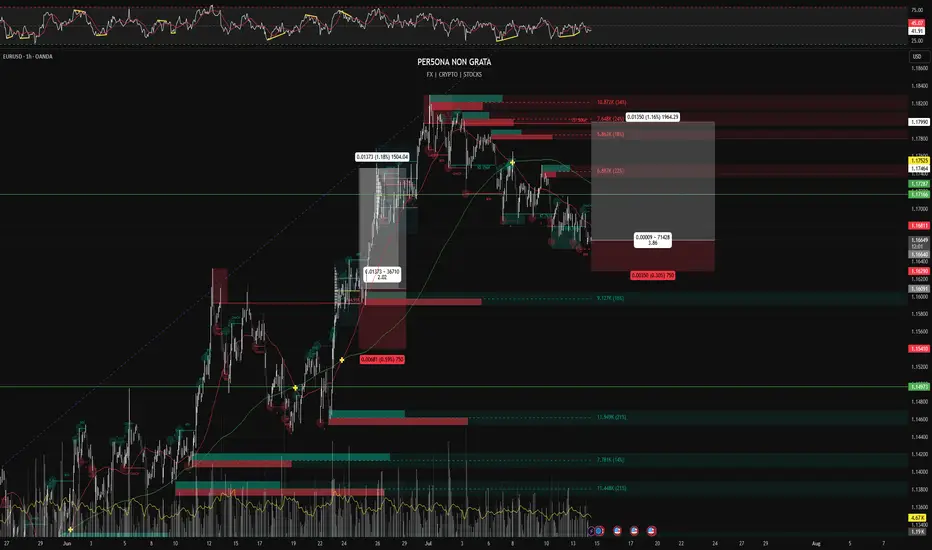
SHORT | EUR/USD | 1DMacro: Dollar strength likely as uncertainty grows from USD economic data; ECB expected to trim dovish tone next week.
Structure: In consolidation after reaching envelope top (~1.1494); forecasting downside to 1.1387–1.1400.
Trigger & Execution:
• Entry: Short on break below 1.1380
• Stop: 1.14678
• Target: 1.12344
• R:R: ~1:2.36
Rationale: Profit-taking above envelope top supports pullback; structural risk limit remains.
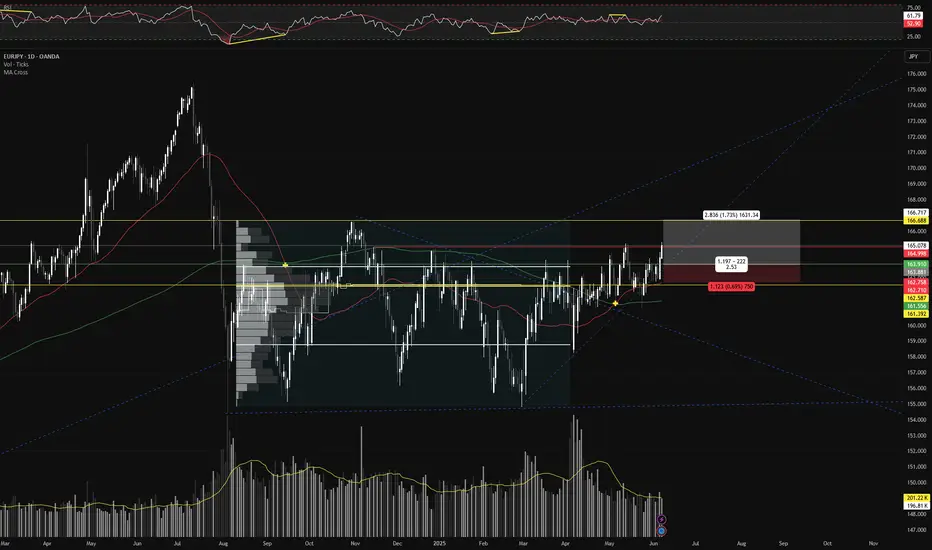
LONG | EUR/JPY | 1D Macro Context: With ECB neutral and BoJ dovish, EUR/JPY favored to drift upward slowly as Yen weakness persists.
Structure: In a long-term bullish channel and recently bounced off the 50‑day MA near 163.0–163.5 .
Trigger:
Entry: Long on pullback to 163.50–164.00.
Stop: 162.80 (below channel support & LVN).
Target: 166.70 (upper channel range) → 168.00 zone.
R:R: ~1:2.5.
Framework: Entry aligns with liquidity sweep and bounce off HVN/50MA, supported by Elliott/Elliott-wave count and broader bullish range.
BUY | KLA Corporation (KLAC) Current Price: $808.00
Change: +16.15 (+2.04%)
Volume: 996,383
52-Week Range: $680.00 – $896.32
Technical Overview:
Trend: Approaching resistance near 52-week highs.
Moving Averages:
50-Day MA: $790.00
200-Day MA: $750.00
RSI: 67 – indicating strong momentum.
Execution Plan:
Entry: $807.00
Stop Loss: $780.00
Take Profit: $850.00
Risk-Reward Ratio: 1:1.6
Rationale:
KLA has seen its Relative Strength Rating improve, indicating growing market leadership. The company is forming a consolidation pattern with a potential breakout, supported by strong earnings growth and increasing sales.

BUY | CyberArk Software (CYBR) Current Price: $403.76
Change: +11.59 (+2.96%)
Volume: 1,530,762
52-Week Range: $230.00 – $421.00
Technical Overview:
Trend: Strong uptrend, approaching 52-week highs.
Moving Averages:
50-Day MA: $390.00
200-Day MA: $350.00
RSI: 65 – entering overbought territory, but momentum remains strong.
Execution Plan:
Entry: $403.8
Stop Loss: $390.00
Take Profit: $430.00
Risk-Reward Ratio: 1:1.8
Rationale:
CyberArk Software addresses the growing demand for cybersecurity solutions, especially with the expansion of AI integration. The company's strong performance reflects its critical role in enterprise data protection.

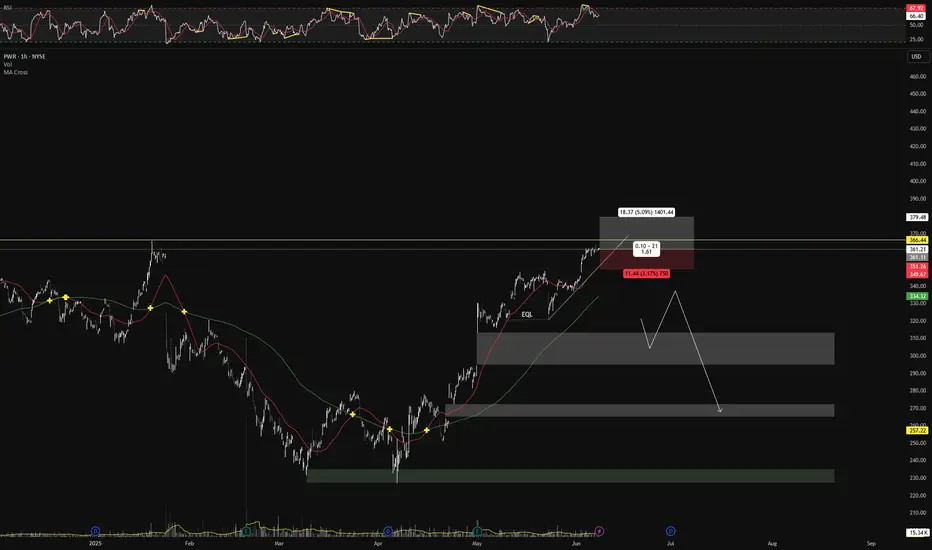
BUY | Quanta Services (PWR)
Current Price: $361.35
Change: +1.63 (+0.45%)
Volume: 701,024
52-Week Range: $280.00 – $365.00
Technical Overview:
Trend: Strong uptrend with higher highs and higher lows.
Moving Averages:
50-Day MA: $345.00
200-Day MA: $320.00
RSI: 67 – indicating bullish momentum.
Execution Plan:
Entry: $361.00
Stop Loss: $350.00
Take Profit: $380.00
Risk-Reward Ratio: 1:1.6
Rationale:
Quanta Services is poised to benefit from growing power demands driven by digitization and AI. The company is well-positioned to capitalize on infrastructure investments.
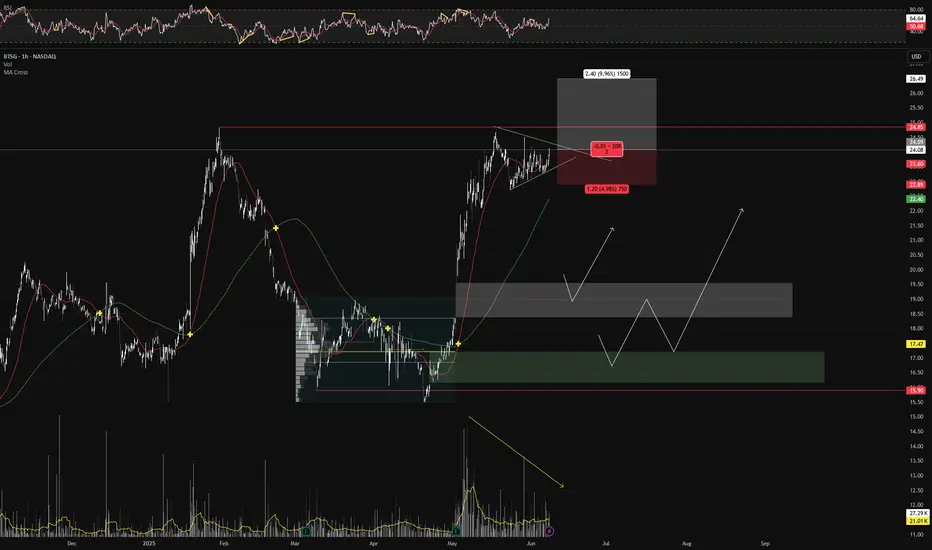
BUY | BrightSpring Health Services (BTSG) Current Price: $24.11
Change: +0.58 (+2.47%)
Volume: 1,529,511
52-Week Range: $17.50 – $24.50
Technical Overview:
Chart Pattern: Forming a bullish cup-with-handle pattern, indicating potential for a breakout.
Moving Averages:
50-Day MA: $22.80
200-Day MA: $21.50
Relative Strength Index (RSI): 65 – approaching overbought territory, but still within a bullish range.
Execution Plan:
Entry: $24.20
Stop Loss: $22.80
Take Profit: $26.50
Risk-Reward Ratio: 1:2
Rationale:
BrightSpring has surged approximately 38% in 2025, significantly outperforming the S&P 500. Analysts project a 269% increase in earnings per share this year, followed by 20% growth next year. The company recently sold its community living business to focus more on its pharmacy division and reduce debt.